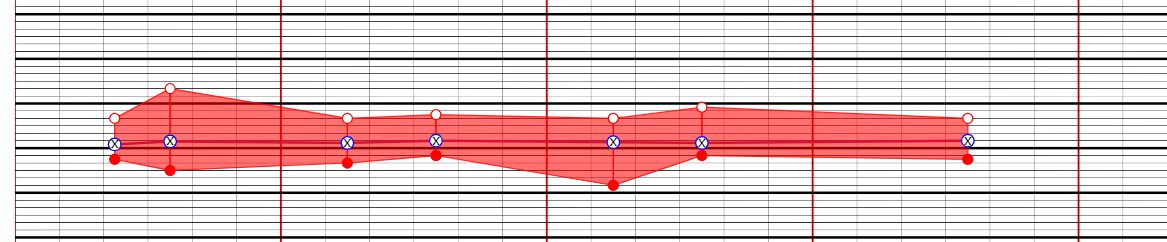
Today, let's draw a line chart.
The following are simulation data
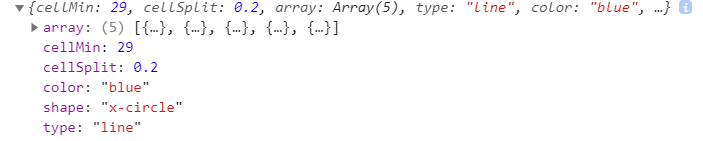
[{"time":19,"text":"enter\n courtyard\n19\n Time\n11\n branch","position":42,"cellMin":29.0,"cellSplit":0.2,"type":"text","color":"red","shape":null},{"time":22,"text":"hand\n art","position":42,"cellMin":29.0,"cellSplit":0.2,"type":"text","color":"red","shape":null},{"time":129,"text":"hand\n art","position":42,"cellMin":29.0,"cellSplit":0.2,"type":"text","color":"red","shape":null},{"cellMin":29.0,"cellSplit":0.2,"y":30.0,"type":"baseline","color":"#000","shape":null},{"cellMin":29.0,"cellSplit":0.2,"y":31.0,"type":"baseline","color":"#000","shape":null},{"cellMin":29.0,"cellSplit":0.2,"y":32.0,"type":"baseline","color":"#000","shape":null},{"cellMin":29.0,"cellSplit":0.2,"y":33.0,"type":"baseline","color":"#000","shape":null},{"cellMin":29.0,"cellSplit":0.2,"y":34.0,"type":"baseline","color":"#000","shape":null},{"cellMin":29.0,"cellSplit":0.2,"y":35.0,"type":"baseline","color":"#000","shape":null},{"cellMin":29.0,"cellSplit":0.2,"y":36.0,"type":"baseline","color":"#000","shape":null},{"cellMin":29.0,"cellSplit":0.2,"y":37.0,"type":"baseline","color":"#000","shape":null},{"cellMin":29.0,"cellSplit":0.2,"y":38.0,"type":"baseline","color":"#000","shape":null},{"cellMin":28.0,"cellSplit":0.2,"y":39.0,"type":"baseline","color":"red","shape":null},{"cellMin":29.0,"cellSplit":0.2,"y":40.0,"type":"baseline","color":"#000","shape":null},{"cellMin":29.0,"cellSplit":0.2,"y":41.0,"type":"baseline","color":"#000","shape":null},{"cellMin":29.0,"cellSplit":0.2,"y":42.0,"type":"baseline","color":"#"Shape": null}, {"cellmin": 29.0, "cellsplit": 0.2, "array": [{"time": 19, "tips": "body temperature 37.1", "value": "37.1", "shape": "X", "break": "false", "type": "temperature", "outer": []], other ": []}, {" time ": 21," tips ":" body temperature 36.9 "," value ":" 36.9 "," value ":" 36.9 "," shape ":" x ":" X ":" x.9 "," X ":" X ":" x ', "X": "X": "X": "shape": "shape": "36.9", "shape": "36.9", "shape": "X". X ":" X ":" X ":" X ". 21" tips ":" body temperature 36.9 "," value ":" 36.9 "," 36.9 "," value ":" 36.9 "," shape ":" 36.9 "," "," break ":" false "," type ":" temperature "," extraar ": []," others ": []}, {" time ": 30," tips ":" body temperature 36.5 "," value ":" 36.5 "“ "Shape": "X", "break": "false", "type": "temperature", "extraar": []], "others": []}, {"time": 38, "tips": "body temperature 36.6", "value": "36.6", "shape": "X", "break": "false", "type": "temperature", "extraar": []], "others": []], "others": []}, {"time": 54, "tips": "body temperature 36.7", "value": "36.7", "shape": "X", "break": "false", "type": "temperature", "extraar": []], [], "other": []], "other": [], "other": [], "other": [], "other": []], "" respectively []], {"time": 54, "tips": "body temperature" 36.7 "," value ":" 36.7 "," 36.7 "," shape ":" X "," break ":" false "," type ":" false "," type ":" temperature[]}], "type": "line", "color": "blue" Shape ':' x-circle '}, {' cellmin ': -10.0,' cellsplit ': 2.0,' array ': [{' time ': 19,' shape ':' empty-circle ',' tips': 'breath 20', 'value': '20', 'break': 'false'}, {'time': 21, 'shape': 'empty circle', 'tips':' breath 20 ',' value ': 20', 'break': 'false'}, {'time': 30, {'time': 30,, {'time': 30,, {'time': 30, ',', 'time': 30 ', {' time ': 21,' shape ':' empty-circle '', 'tips':' breath 20 ',' value '', 'value': 20 ',' break ':' break '::' false '}, {' time ': 30,' time ': 30,' 30, 'time' 'shape ":" empty circle "," tips ":" breath 19 "," value ":" 19 "," break ":" false "}, {" time ": 38," shape ":" empty circle "," tips " Breath 18 ',' value ': 18', 'break': 'false'}, {'time': 54, 'shape': 'empty circle', 'tips':' breath 19 ',' value ':' 19 ',' break ':' false '}], type': Line ',' color ': Black', 'shape': 'empty circle'}, {'cellmin': -2.0, 'cellsplit': 1.0, array ': [{' time ': 19,' tips':: 19, 'tips':: 19', 'breath 19' ',' value ':' 19 ',' break ':' false '}], type': Line ',' line ',' color ': Black', 'shape': 'empty-circle'}, {'empty circle'}, {'cellmin': -2.0, 'cellsplit': 1.0, 'array': [{'time': [{'time': 19, 'tips':: 19,' tips': pain7 "," value ":" 7 "," break ":" false "," type ":" pain "," extraar ": [{" extra ":" 3 "," extra color ":" red "," extra tips ": Pain evaluation 3 "}],," other ": []}, {" time ": 23," tips ":" pain 3 "," value ":" 3 "," break ":" false "," type ":" pain "," extraar ": []],," others ": []}, {" time ": 27," tips ":" pain 3 "," value ":" 3 "," break ":" false "," type ":" pain "," pain "," extraar ": []," other ": []}, {" time ": 33," tips ": 33," tips ": 33," tips ": 33," time ": 33," tips ": 33," time ": 33," tips ": 27," tips ":" pain 3 "," value ":" 3 "," break ":" 3 "," break ":" false "," type ":" pain "," paint "," extraar ": []," other ": []},, {" time ": []},,, {" time ": 33," tips ": 33," tips ": 33," tips ": 33," tips ": 33," tips ": 33," time ": 33,": "pain 3", "value": "3", "break": "false", "type": "pain", "extraar": [], "others": []}, {"time": 39, "tips": "pain 3", "Value": "3", "break": "false", "type": "pain", "extrar": [{"extra": "3", "extracolor": "red", "extra tips": "pain evaluation 3"}],"others":[]},{"time":44,"tips": "pain pain 3", "value": "3", "break": "false", "type": "pain", "extraar": []], "others": []}, {"time": 51, "tips": "pain 3", "value": "3", "break": "false", "type": "pain", "extraar": []], [], [], [],],, "other": []], "" []],, "others": []], [], "[],," pain ": []], [], [],," pain ":" pain 3 "," value ":" 3 "," break ":" false "," break ":" false "," type ":" pain "," pain "," extraar ": []], [], [], [],], [],," pain others ": []}, {" time ": 58," tips ":" pain 3 "Value":3 "," break ":" false "," type ":" paint "," extraar ": [{" extra ":" 3 "," extra color ":" red "," extratips ":" pain evaluation 3 "}],", "other": []]], type ":" line "," color ":" red "," shape ":" empty circle "}, {" bgcolor ":" RGBA (255,0,0,0.7) "," cellmin ": 30.0," cellmin ": 30.0," cellmin ": 30.0.0," cellmin ": 30.0.0," cellmin ": 30.0.0," cellmin ": 30.0.0," cellmin ": 30.0.0," cellmin ": 30.0.0," cellmin ": 30.0.0," cellmin ": 30.0.0.0," cellmin ": 30.0.0," cellmin ": 30.0.0," cellmin ": 30.0.0," lsplit ": 2.0," array ": [{" time ": 19," V1 ": 69," v1tips ":" heart rate 69","v2":69,"v2Tips ":" pulse 69 "," break ":" false "}, {" time ": 21 "V1": 70, "V1 tips": "heart rate 70","v2":70,"v2Tips": "pulse 70", "break": "false"}, {"time": 30, "V1": 83, "V1 tips": "heart rate 83", "V2": 83, "V2": 83, "v2tips": "pulse 83", "break": "false"}, {"time": 38, "V1": 78, "V1 tips": "heart rate 78","v2":78,"v2Tips": "pulse 78", "break": "false"}, {"time": 54, "V1": 77, "V1": 77, "V1 tips": "heart rate 77", "77", "V2": 77, "77," heart rate 77 "," V2 ": 77," 77, "77," V2 ": 77," 77, "heart rate 77," V2 ": 77," 77, "77," heart heart heart heart rate "77," V2 ": 77," 77, "77," V2 ": 77," 77, "77," heart rate: "77," V2 ": 77," 77 v2tips: "pulse 77","Break":"false"}],"type":"area","color":"red","shape":null},{"text":null,"y":"28","cellMin":-10.0,"cellSplit":2.0,"array":[],"type":"tag","color":"black","shape":null},{"text":null,"y":null,"cellMin":30.0,"cellSplit":2.0,"array":[],"type":"tag","color":"black","shape":null}]
First, create the filterData method to filter the data. text line, segment, area, circle. tag can't use today's broken line, so create the zrLine method.
filterData(){
      const data = chartData

      data.forEach(el => {
        switch (el.type) {
          case "text":
            // this.zrText(el)
            break;
          case "line":
            this.zrLine(el)
            break;
          case "area":
            this.zrPolyline(el)
            break;
          case "tag":
            this.zrTag(el)
            break;

          default:
            break;
        }
        });
    }
utli.js let's start with createLine
To create line, you need to pass 5 parameters, namely, the start point's abscissa and the end point's abscissa and the line's style.
To create circle, you need to pass 4 parameters: the radius and style of the horizontal and vertical coordinate circle of the dot.
addHover also needs to add a piece of code (the initialization method created in the previous chapter) in init method to create a div, which will be used when we move the mouse over the circle and the text message pops up.
var div = document.createElement("div")
      div.classList.add("tips")
      document.getElementById("main").append(div)
utli.js
//line segment
export const createLine = (x1,y1,x2,y2,style)=>{
    return new zrender.Line({
        shape:{
            x1:x1,
            y1:y1,
            x2:x2,
            y2:y2
        },
        style:style,
    });
};
// cx Abscissa cy Ordinate r Radius hollow circle
export const createCircle = (cx,cy,r,style)=>{
    return new zrender.Circle({
        shape:{
            cx:cx,
            cy:cy,
            r:r
        },
        style:style,
        zlevel:4
    })
}
//Add to horver Event el Element object config Some configuration items x x Axis coordinate y y Axis coordinate shapeOn Mouse move in some attribute configuration shapeOn Move the mouse out of some attribute configurations shape See the official website for configuration items
export const addHover = (el,config,x,y,shapeOn,shapeOut) => {
    const domTips = document.getElementsByClassName("tips")
    el.on('mouseover',function(){
        domTips[0].innerHTML = config.tips
        domTips[0].setAttribute("style",`position:absolute;top:${y-13}px;left:${x}px;display:block;font-size:10px;background-color:rgba(0,0,0,.7);padding:3px;border-radius:3px;color:#fff`)
        el.animateTo({
            shape:shapeOn
        },100,0)
    }).on('mouseout',function () {
        domTips[0].setAttribute("style",`display:none`)
        el.animateTo({
            shape:shapeOut
          },100,0)
    })
}
//polygon
export const createPolygon = (points,style) => {
    return new zrender.Polyline({
        shape:{
            points:points,
        },
        style:style
    })
}
   var style = {}
      switch (data.shape) {
        case "x-circle":
          style = {
            stroke:data.color,
            fill:"#fff",
            text:"x",
          }
          break;
        case "empty-circle":
          style = {
            stroke:data.color,
            fill:"#fff",
            text:"",
          }
          break;

        default:
          break;
      }
You need to add 2 methods here.
//Obtain X coordinate data Current point in time
    getX(data){
      let XShareOne = this.XShareOne()
      return data * XShareOne
    },
//Transformation y The axis coordinate point is the correct coordinate point because y The axis coordinate is the height of all the vertices increasing by 0 minus the original coordinate with the total height. The remaining height is the correct coordinate point.
    //i Represents a grid represents several heights
    transformY(data,i){
      let YHeight = this.YShareOne()

      //Calculate the remaining height
      let surplusHeight = this.canavsHeight - (YHeight/i) * data
      return surplusHeight
    },
This code means to traverse the data first, calculate the x coordinate value through the time attribute, and calculate the y coordinate on the left side of the x axis, which is basically based on the time. The y axis coordinate calculated based on the time attribute may change with the data change. The Break attribute is whether to Break the line. If you need to Break the line in place, true
      data.array.forEach((el,i) =>{
        if (i > 0) {
          let XShareOne = this.XShareOne()

          let firstX = this.getX(data.array[i-1].time)
          let firstY = this.transformY(data.array[i-1].value,1)
          let x = this.getX(data.array[i].time)
          let y = this.transformY(data.array[i].value,1)

          if (data.array[i-1].Break == "false") {
            let line = createLine(firstX,firstY,x,y,{
                stroke:"#af2377",
                lineWidth:2,
            })
            this.zr.add(line)
          }
        }

        if (el.extraArr && el.extraArr.length > 0) {
            el.extraArr.forEach((item,a) => {
              let x = this.getX(el.time)
              let y = this.transformY(el.value,1)

              let lastY =  this.transformY(item.extra,1)
              let dottedLine = createLine(x,y,x,lastY,{
                  stroke:"#af2377",
                  lineWidth:2,
                  lineDash:[2,2]
              })
              this.zr.add(dottedLine)

              el.extraArr.forEach((item,a) => {
                let getY = this.transformY(item.extra,1)

                let Circle = createCircle(x,getY,5,{
                  stroke:item.extraColor,
                  fill:"#fff",
                })
                this.zr.add(Circle)
                addHover(Circle,{
                    tips:item.extraTips,
                },x,getY,{
                    r:8,
                  },{
                    r:5,
                })
              })
            })
         }
        let getX = this.getX(el.time)
        let getY = this.transformY(el.value,1)

        let Circle = createCircle(getX,getY,5,style)
        this.zr.add(Circle)
        addHover(Circle,el,getX,getY,{
            r:8,
          },{
             r:5,
        })
      })
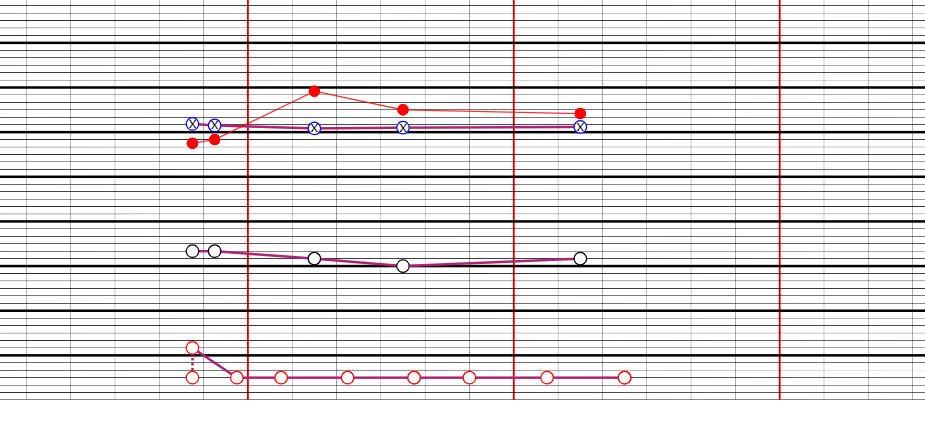
After this step, the line graph should be finished.
Next time we'll talk about the drawing of Shadows