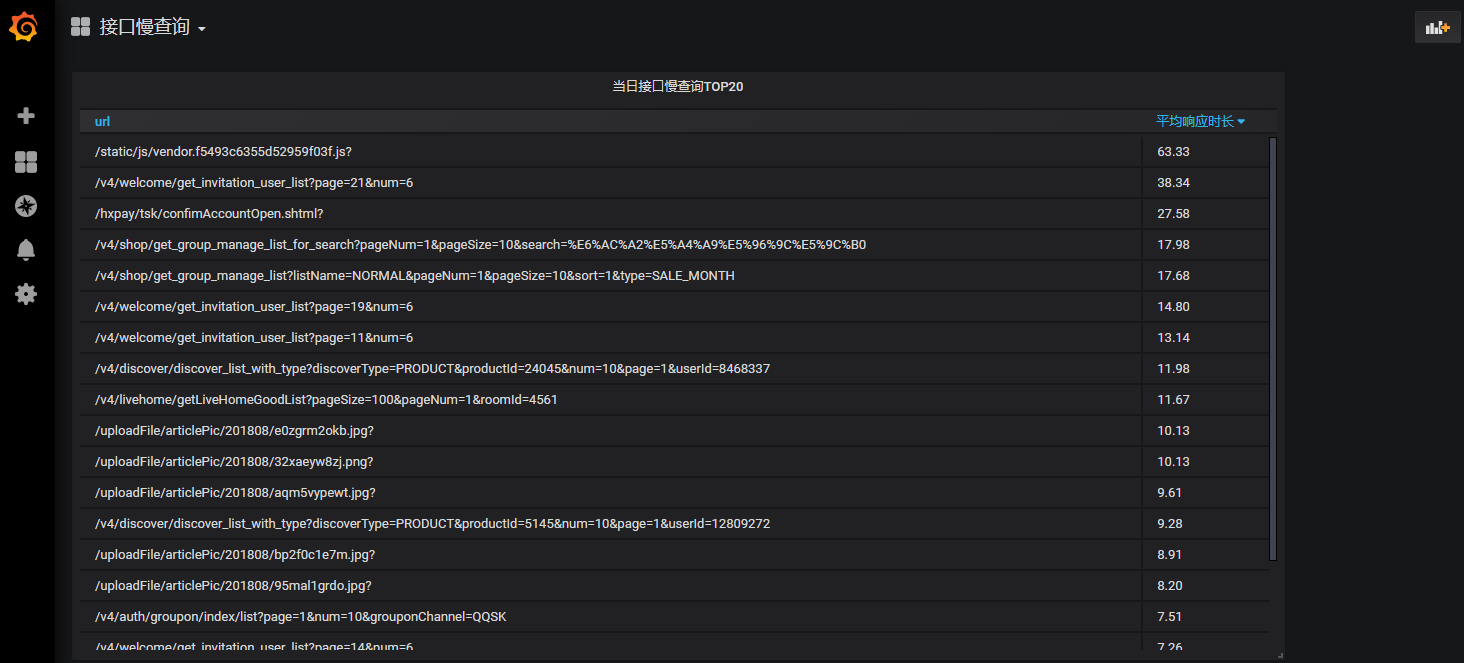
I believe that many small partners have seen the response time and real-time display function of url interface in some commercial products. It can be understood that the slow query of web interface and the slow query of sql have the same magic, but if you want to do it, you have no way to start and don't know how to realize this function, so today we will teach you how to realize this function with grafana+nginx+mysql.
0x0
In fact, nginx itself has the function of interface response time, but it still needs to be modified, for example, recording the response of more than 1000 ms (1 second) separately and writing it into the database. It should be noted that it is not recommended to write records directly to the database, because the database will become a burden of nginx, and indirect writing is enough. You need to modify the log module, involving the file ngx_http_log_module.c Usually in nginx-1.17.9/src/http/modules/ngx_http_log_module.c
About 838 lines, find NGX_ http_ log_ request_ The time function is modified as follows:
static u_char *
ngx_http_log_request_time(ngx_http_request_t *r, u_char *buf,
    ngx_http_log_op_t *op)
{
	ngx_time_t *tp;
	ngx_msec_int_t ms;
    time_t t = time(NULL);
	struct tm *loc_time = localtime(&t);
	tp = ngx_timeofday();
	u_char slow_log[2048];
	memset(slow_log, 0, sizeof(slow_log));
	ms = (ngx_msec_int_t) ((tp->sec - r->start_sec) * 1000
			+ (tp->msec - r->start_msec));
	ms = ngx_max(ms, 0);
	ngx_sprintf(slow_log, "%04d/%02d/%02d %02d:%02d:%02d %V %V?%V waste time %d.%d\n",
			loc_time->tm_year + 1900, loc_time->tm_mon + 1, loc_time->tm_mday,
			loc_time->tm_hour, loc_time->tm_min, loc_time->tm_sec,
			&r->headers_in.server, &r->uri, &r->args, (time_t) ms / 1000,
			ms % 1000);
	int logfd;
	if ((logfd = open("/var/log/nginx/nginx_slow.log", O_RDWR | O_CREAT | O_APPEND,
	S_IRUSR | S_IWUSR)) == -1) {
		ngx_log_error(NGX_LOG_ERR, r->connection->log, 0,
				"can not open file:logfile\n");
	}
	char Server_name[256];
	const char *server_name = "%.*s";
	memset(Server_name, 0, sizeof(Server_name));
	snprintf((char *) Server_name, sizeof(Server_name), server_name,
					r->headers_in.server.len, r->headers_in.server.data);
	/* Only records that are longer than 1 second and the domain name is not grafana.sshfortress.com  */
    if (ms > 1000 && strcmp("grafana.sshfortress.com", Server_name) != 0)
		write(logfd, slow_log, strlen((char *)slow_log));
	close(logfd);
	return ngx_sprintf(buf, "%T.%03M", (time_t) ms / 1000, ms % 1000);
}
Then compile
# ./configure --prefix=/usr/local/nginx1.17.9
# make -j4 ; make install

#mkdir -p /var/log/nginx; chmod -R 777 /var/log/nginx
Simple configuration
server {
listen *:80;
server_name slow.sshfortress.com;
location / {
proxy_set_header Host $host;
proxy_set_header X-Real-IP $remote_addr;
proxy_set_header REMOTE-HOST $remote_addr;
proxy_set_header X-Forwarded-For $proxy_add_x_forwarded_for;
proxy_pass http://127.0.0.1:3000;
}
}
Start nginx. If the interface response time is more than 1 second, then var/log/nginx/nginx_slow.log There will be records in. But it's just a slow query of records. We need sorting and visualization. Records can also be written directly to mysql, but I didn't do so. Why not write directly? The reason is that if mysql responds slowly, it will affect nginx's response, but writing to disk will not happen. Next, we simply write the data to the database synchronously.
0x01
First, create a table to write records synchronously
 CREATE TABLE `nginx_slow` (
  `id` int(11) NOT NULL AUTO_INCREMENT,
  `date` datetime NOT NULL,
  `server_name` varchar(255) NOT NULL,
  `url` varchar(255) NOT NULL,
  `waste_time` decimal(11,3) NOT NULL,
  PRIMARY KEY (`id`)
) ENGINE=InnoDB AUTO_INCREMENT=1 DEFAULT CHARSET=utf8mb4;
After that, a tool for synchronizing data can be realized by shell. The code is as follows:
#!/bin/bash
#    insert_mysql.sh
set -x
if [ $# != 1 ]
  then
 echo "Usage insert_mysql.sh /var/log/nginx/nginx_slow.log"
  exit 1
fi
tail -n 1 -f ${1}|while read var
do
         value=`echo $var|awk '{print $3}'`
         value2=`echo $var|awk '{print $4}'`
         value3=`echo $var|awk '{print $7}'`
         echo "$value $value2 $value3"
         mysql -h 127.0.0.1 -usuper -pxxxxxxxxx -e "use nginx; INSERT INTO nginx_slow( date, server_name, url, waste_time) VALUES ( now(), '${value}', '${value2}', '$value3');"
done
It's easy to run scripts and write data synchronously
# ./insert_mysql.sh /var/log/nginx/nginx_slow.log
0x02
Finally, configure the interface of the day to query TOP 20 slowly in grafana. The related statements are
select n.url,avg(n.waste_time) Average response time
from nginx_slow n
WHERE n.`date` > curdate()
group by 1
order by 2 desc
limit 20
The final rendering is as follows
