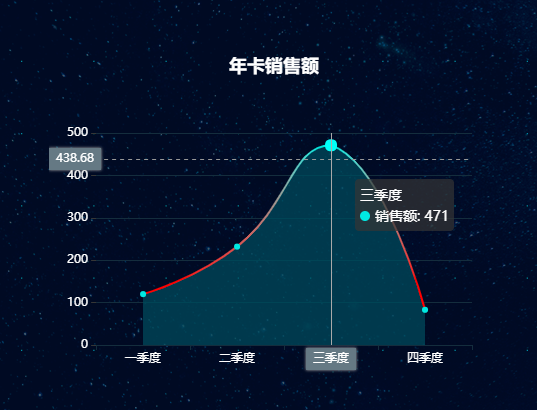
Preface:
echarts is a report plug-in produced by Baidu. It is very rich in chart display and widely used in our development. However, the official examples are very simple. Fortunately, their api documents provide a lot of configuration items, which provides the possibility for us to draw a richer chart.
Pits encountered with echarts:
- Be sure to add width and height to the chart container.
- The chart can be adjusted in the container to make the chart display more complete.
Today's focus: line drawing.
1. Introduce relevant js
<script type="text/javascript" src="../js/jquery-2.1.1.js"></script>
<script type="text/javascript" src="../echarts-4.2.0/echarts.min.js"></script>
2. Determine the container
<div id="line" style="width: 450px;height: 325px;">
</div>
3. Define the method of drawing line chart, and configure the chart parameters
/**
     * Draw a broken line chart
     * @param container container
     * @param titleName Title
     * @param xData x Shaft data
     * @param seriesName Chart name
     * @param seriesData Chart data
     */
    function drawLine(container, titleName, xData, seriesName, seriesData) {
        var myChart = echarts.init(document.getElementById(container));
        myOption = {
            color : [ '#6a7985' ],
            //Title Style
            title : {
                text : titleName,
                textStyle : {
                    color : 'white',
                },
                left : 'center'
            },
            //menu
            legend : {
                show : false
            },
            //prompt box
            tooltip : {
                trigger : 'axis',
                position : 'top',
                axisPointer : {
                    type : 'cross',
                    label : {
                        backgroundColor : '#6a7985'
                    }
                }
            },
            //Figure position
            grid : {
                left : '4%',
                right : '6%',
                bottom : '4%',
                top : 80,
                containLabel : true
            },
            //x axis
            xAxis : [ {
                type : 'category',
                //The strategy of leaving blank on both sides of the coordinate axis, i.e. the starting and ending positions of the x-axis coordinate points are not at the extreme edge
                boundaryGap : true,
                axisLine : {
                    show : true,
                    //x axis style
                    lineStyle : {
                        color : '#17273B',
                        width : 1,
                        type : 'solid'
                    }
                },
                //x-axis font settings
                axisLabel : {
                    show : true,
                    fontSize : 12,
                    color : 'white'
                },
                data : xData
            } ],
            //y axis
            yAxis : [ {
                type : 'value',
                //y-axis font setting
                axisLabel : {
                    show : true,
                    color : 'white',
                    fontSize : 12
                },
                //y axis setting does not display
                axisLine : {
                    show : false
                },
                //Line style parallel to x axis
                splitLine : {
                    show : true,
                    lineStyle : {
                        color : '#17273B',
                        width : 1,
                        type : 'solid',
                    }
                }
            } ],
            series : [ {
                name : seriesName,
                type : 'line',
                //Broken line smoothing
                smooth : true,
                symbol : 'circle',
                symbolSize : 6,
                //Line style
                lineStyle : {
                    color : {
                        type : 'linear',
                        x : 0,
                        y : 0,
                        x2 : 0,
                        y2 : 1,
                        colorStops : [ {
                            offset : 0,
                            // Color at 0%
                            color : '#6ae6dd'
                        }, {
                            offset : 1,
                            // Color at 100%
                            color : 'red'
                        } ],
                        globalCoord : false
                    },
                    width : 2,
                    type : 'solid',
                },
                //Polyline connection point style
                itemStyle : {
                    color : '#00E5DE'
                },
                //Polyline stacked area style
                areaStyle : {
                    color : '#004c5E'
                },
                data : seriesData
            } ]
        };
        myChart.setOption(myOption);
    }
4. Call methods and pass parameters
drawLine('line', 'Annual card sales', [ 'First quarter', 'The two quarter', 'The three quarter', 'Fourth quarter' ], 'Sales volume', [ 120, 232, 471, 83 ]);
5. key points
- In the definition method, some styles and data that need to be displayed dynamically are defined as parameters of the method. Different parameters can be transferred according to different display requirements. Other styles have been written as fixed styles according to page styles.
- The fixed style is only a part of the api. If you want to show more rich and dynamic graphs, you can refer to the official api. The configuration method is the same.
6. upper figure

Line chart.png