Author: Jakub Juszczak
Compile: Dahaha with a beard
Translated text: http://huziketang.com/blog/posts/detail?postId=58e5e0e1a58c240ae35bb8e0
English Connection: Creating stunning charts with Vue.js and Chart.js
For reprinting, please specify the source, keep the links to the original text and the author's information.
Learn more about chart.js options to create beautiful charts. Interactive charts provide a cool way to visualize your data. But most of the out-of-the-box solutions don't have gorgeous graphics with default options.
In this article, I'll show you how to customize the chart.js option to make cool charts.
⚡ Quick Start
We need:
Use vue-cli to build the basic architecture. I hope you have installed it. We use vue-chart.js as a wrapper for chart.js.
vue init webpack awesome-charts
Then install dependencies in the project catalog:
cd awesome-charts && yarn install
Add to vue-chartjs:
yarn add vue-chartjs -S
First chart
Now let's create the first discount table.
touch src/components/LineChart.js && subl .
Now we need to start from vue-chartjs Introduce the base table of the broken line table to create components.
The renderChart() method is invoked in the mount() function using the data and options we have prepared.
    import {Line} from 'vue-chartjs'

    export default Line.extend({
      mounted () {

        this.renderChart({
          labels: ['January', 'February', 'March', 'April', 'May', 'June', 'July'],
          datasets: [
            {
              label: 'Data One',
              backgroundColor: '#FC2525',
              data: [40, 39, 10, 40, 39, 80, 40]
            },{
              label: 'Data Two',
              backgroundColor: '#05CBE1',
              data: [60, 55, 32, 10, 2, 12, 53]
            }
          ]
        }, {responsive: true, maintainAspectRatio: false})

      }
    })
In the code, some instance data and optional parameters are used to pass to the data object of chart.js, and response: true is set to make the chart full of outer containers.
The renderChart() method is available because we inherit BaseChart, which is defined in BaseChart and some properties.
Running & Testing
ok, now delete Hello.vue from App.vue and introduce our chart:
    <template>
      <div id="app">
        <div class="container">
          <div class="Chart__list">
            <div class="Chart">
              <h2>Linechart</h2>
              <line-example></line-example>
            </div>
          </div>
        </div>
      </div>
    </template>

    <script>
    import LineExample from './components/LineChart.js'
    export default {
      name: 'app',
      components: {
        LineExample
      }
    }
    </script>

    <style>
    #app {
      font-family: 'Avenir', Helvetica, Arial, sans-serif;
      -webkit-font-smoothing: antialiased;
      -moz-osx-font-smoothing: grayscale;
      text-align: center;
      color: #2c3e50;
      margin-top: 60px;
    }
    .container {
      max-width: 800px;
      margin:  0 auto;
    }
    </style>
    CopyRaw
Run the dev script in the terminal and you can see the chart.
yarn run dev
Make me more beautiful
Now it's time to do some beautification. (1) chart.js has a lot of cool tricks. You can pass a hexadecimal color data to backgroundColor, you can also pass rgba() values, and you can set the transparency of the color. chart.js uses html canvas to plot, so we use html canvas to plot createLinearGradient().
This is the interesting starting point, and we need canvas objects to use it. But it's not difficult. vue-chartjs A reference to it already exists. We can use this.$refs.canvas to access it.
In LineChart.js, we created two variables to hold the gradient. The code is as follows:
    this.gradient = this.$refs.canvas
     .getContext('2d')
     .createLinearGradient(0, 0, 0, 450)
    this.gradient2 = this.$refs.canvas
     .getContext('2d')
     .createLinearGradient(0, 0, 0, 450)
There is another function that can be used: addColorStop()
Create three color points for each gradient:
    this.gradient.addColorStop(0, 'rgba(255, 0,0, 0.5)')
    this.gradient.addColorStop(0.5, 'rgba(255, 0, 0, 0.25)');
    this.gradient.addColorStop(1, 'rgba(255, 0, 0, 0)');

    this.gradient2.addColorStop(0, 'rgba(0, 231, 255, 0.9)')
    this.gradient2.addColorStop(0.5, 'rgba(0, 231, 255, 0.25)');
    this.gradient2.addColorStop(1, 'rgba(0, 231, 255, 0)');
Now you can pass this.gradient to backgroundColor and get a nice gradient. For better results, you can also set the color of borderColor, alpha to 1 (or hexadecimal), borderWidth to 1, and pointColor.
    borderColor: '#FC2525',
    pointBackgroundColor: 'white',
    borderWidth: 1,
    pointBorderColor: 'white',
    import {Line} from 'vue-chartjs'

    export default Line.extend({
      data () {
        return {
          gradient: null,
          gradient2: null
        }
      },
      mounted () {
        this.gradient = this.$refs.canvas.getContext('2d').createLinearGradient(0, 0, 0, 450)
        this.gradient2 = this.$refs.canvas.getContext('2d').createLinearGradient(0, 0, 0, 450)

        this.gradient.addColorStop(0, 'rgba(255, 0,0, 0.5)')
        this.gradient.addColorStop(0.5, 'rgba(255, 0, 0, 0.25)');
        this.gradient.addColorStop(1, 'rgba(255, 0, 0, 0)');

        this.gradient2.addColorStop(0, 'rgba(0, 231, 255, 0.9)')
        this.gradient2.addColorStop(0.5, 'rgba(0, 231, 255, 0.25)');
        this.gradient2.addColorStop(1, 'rgba(0, 231, 255, 0)');


        this.renderChart({
          labels: ['January', 'February', 'March', 'April', 'May', 'June', 'July'],
          datasets: [
            {
              label: 'Data One',
              borderColor: '#FC2525',
              pointBackgroundColor: 'white',
              borderWidth: 1,
              pointBorderColor: 'white',
              backgroundColor: this.gradient,
              data: [40, 39, 10, 40, 39, 80, 40]
            },{
              label: 'Data Two',
              borderColor: '#05CBE1',
              pointBackgroundColor: 'white',
              pointBorderColor: 'white',
              borderWidth: 1,
              backgroundColor: this.gradient2,
              data: [60, 55, 32, 10, 2, 12, 53]
            }
          ]
        }, {responsive: true, maintainAspectRatio: false})

      }
    })
Last step
The last step is to add some styles to the App.vue container.
    .Chart {
      background: #212733;
      border-radius: 15px;
      box-shadow: 0px 2px 15px rgba(25, 25, 25, 0.27);
      margin:  25px 0;
    }

    .Chart h2 {
      margin-top: 0;
      padding: 15px 0;
      color:  rgba(255, 0,0, 0.5);
      border-bottom: 1px solid #323d54;
    }
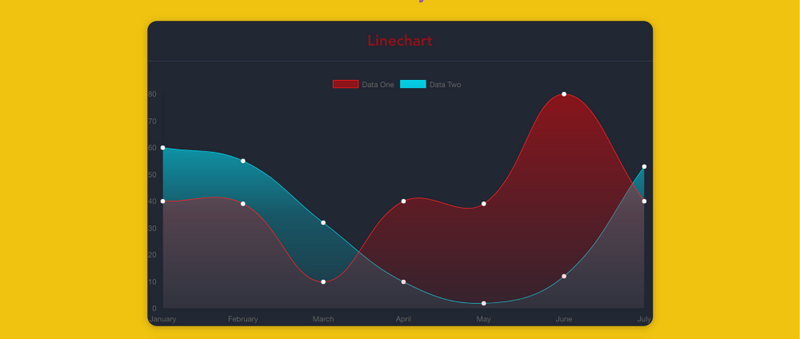
final result
The final result is as follows:
Happy Coding! If this article is helpful to you, please pay attention to my column.- Front-end Daha Publish high quality front-end articles regularly.
I'm writing a Book recently. React.js Books Children's shoes interested in React.js, Welcome to your advice.