You may need to use histogram, pie chart and scatter chart when you are doing a project. So let's talk about it
Use of histogram, pie chart and scatter chart of echars plug-in
Refer to the official website of echars plug-in: https://echarts.baidu.com/index.html
When using the echars plug-in
1. First, you need to reference the echars plug-in,
2. Write a div to hold the echars content,
3. Initialize the echars instance
4. Specify the configuration items and data of the chart
5. Use the specified configuration items and data to display the chart
Configuration parameters of Title
Tooltip prompt box component
Legend component
The x axis in the grid of xAxis rectangular coordinate system
y axis in grid
Series system list,
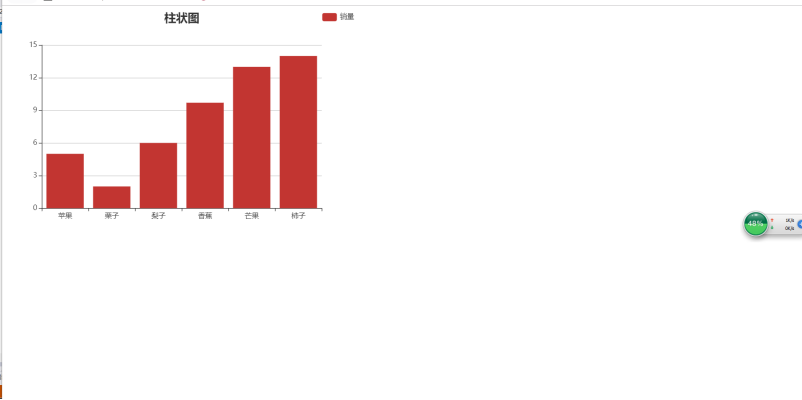
The code is as follows: (histogram)
@{
Layout = null;
}
</div>
<script src="~/Content/Echarts/echarts.js"></script>@*echarts Plug-in unit*@
<script>
    //Initializing the echarts instance
    var myechar = echarts.init(document.getElementById("echart"));
    //Specify configuration items and data for the chart
    var option = {
            title: {//Configuration parameters for title
            text: 'Histogram',//Title name
            left: 'center',//The distance between the title and the left side of the container is 20px, 20%,'left ',' center ',' right '
            textStyle: {//Text style
            fontSize: 20,//Font size of main title text
        }
        },

        tooltip: {//tooltip: prompt box component
            trigger: 'axis'//Triggered by coordinate axis, mainly used in charts where category axis is used, such as bar chart and line chart. There will be a vertical line when the mouse moves to the column
           // trigger: 'item' / / triggered by data item graph, mainly used in scatter chart, pie chart and other charts without category axis.

        },

        legend: {//Legend components.
            orient: 'vertical',//The layout orientation of the legend list. 'horizontal' horizontal 'vertical'
             left: 'right',//20px, 20%,'left ',' center ',' right 'from the left side of the container
          //  bottom: '10%',
           // itemWidth: 10, / / width of legend
            //itemHeight: 10, / / height of legend

            data: ['Sales volume']
        },
        xAxis: {//x axis in grid of rectangular coordinate system
            data: ["Apple", "Chestnut", "Pear", "Banana", "Mango", "Persimmon"]
        },
        yAxis: {//y-axis in grid of rectangular coordinate system

        },
        series: [{//List of series. Each series determines its own chart type by type
            name: 'Sales volume',//Move the mouse to the column display name
            type: 'bar',//Chart type
            areaStyle: {
             normal: {//Modify color
             ...............                }
            },
            data: [5, 2.0, 6, 9.7, 13, 14]//Chart data
        }]
    };
    //Use the configuration items and data you just specified to display the chart.
    myechar.setOption(option)

</script>
Operation result:
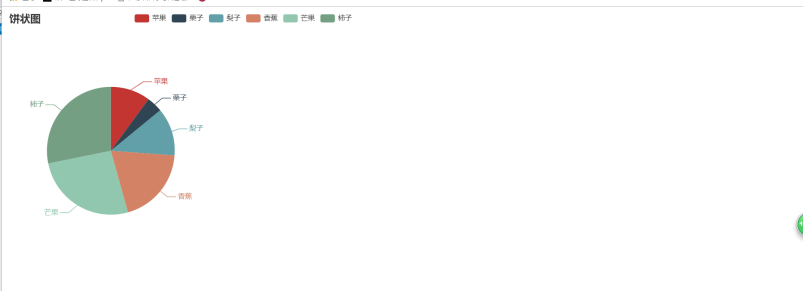
The code is as follows: (pie chart)
@{
Layout = null;
}
</div>
<script src="~/Content/Echarts/echarts.js"></script>@*echarts Plug-in unit*@
<script>
    //Initializing the echarts instance
    var myechar = echarts.init(document.getElementById("echart"));
    //Specify configuration items and data for the chart


   var option1 = {
        title: {
            text: 'Pie chart'
        },
        tooltip: {//tooltip: prompt box component
          //  Formatter: "{a} {B} < br / > number of people: {c}, proportion: {d}%"
            //Pie, dashboard, funnel: {a} (family name), {b} (data item name), {c} (value), {d} (percentage)
        },
        legend: {//legend: legend component
            orient: 'horizontal',//The layout orientation of the legend list. 'horizontal' horizontal 'vertical'
            left: 'right',//Distance from legend assembly to left of container right right
            data: ["Apple", "Chestnut", "Pear", "Banana", "Mango", "Persimmon"]//Data array for Legend
        },
        series: [//Series: list of series. Each series determines its own chart type by type
            {
                name: 'Sales volume',//Family name, for display of toolip, legend filtering of legend
                type: 'pie',//Pie chart
                radius: [0, '55%'],//The radius of the pie chart. The first term of the array is the inner radius, and the second term is the outer radius.
                center: ['30%', '60%'],//The center (Center) coordinate of the pie chart. The first item of the array is the abscissa, and the second item is the ordinate.
                data: [
                    { value: 5, name: 'Apple' },//Name data item name
                    { value: 2.0, name: 'Chestnut' },//Value data value
                    { value: 6, name: 'Pear' },
                    { value: 9.7, name: 'Banana' },
                    { value: 13, name: 'Mango' },
                    { value: 14, name: 'Socks' },

                ]
            }
        ]
    };
//Use the configuration items and data you just specified to display the chart.
myechar.setOption(option1)
</script>
Operation result:
The code is as follows: (scatter)
@{
Layout = null;
}
</div>
<script src="~/Content/Echarts/echarts.js"></script>@*echarts Plug-in unit*@
<script>
    //Initializing the echarts instance
    var myechar = echarts.init(document.getElementById("echart"));
    //Specify configuration items and data for the chart

    var option2 = {
        title: {//title: title Component
            text: 'Scatter plot',//Main title text
            left: 'left',//20px, 20%,'left ',' center ',' right 'from the left side of the container
            textStyle: {
                fontSize: 13,//Font size of main title text
            }
        },
        tooltip: {//Prompt box component.
            trigger: 'axis'//Triggered by coordinate axis, mainly used in charts where category axis is used, such as bar chart and line chart.
          //  trigger: 'item' / / triggered by data item graph, mainly used in scatter chart, pie chart and other charts without category axis.
        },
        legend: {//Legend component
            data: ['Sales volume'],//Legend data array
            left: 'right'//The distance of the legend component from the left side of the container. 20px, 20%, 'left', 'center', 'right'
        },
        xAxis: [//x axis in grid of rectangular coordinate system
            {
                name: 'Product name',
                nameLocation: 'end',//Display position of coordinate axis name 'start','middle','end'
                type: 'category',//Axis type. The 'category' category axis is applicable to discrete category data. When it is of this type, the category data must be set through data.
                data: ["Apple", "Chestnut", "Pear", "Banana", "Mango", "Persimmon"]
                //Category data, valid in the category axis (type: 'category').
            }
        ],
        yAxis: [//y-axis in grid of rectangular coordinate system
            {
                name: 'Sales volume',
                nameLocation: 'end',//Display position of coordinate axis name 'start','middle','end'
                type: 'value',//'value' value axis for continuous data.
            }
        ],
        series: [//List of series. Each series determines its own chart type by type
            {
                name: 'Sales volume',
                type: 'line',//The default is straight line, optional: 'line' | 'shadow'
                areaStyle: {
                    normal: {//Modify color

                    }
                },//
                data: [5, 2.0, 6, 9.7, 13, 14]//data
            }
        ]
    };
    //Use the configuration items and data you just specified to display the chart.

   myechar.setOption(option2)
</script>
Operation result:
