Use of ECharts plug-in
Introduction to ECharts
ECharts, a pure Javascript chart library, can run smoothly on PC and mobile devices, compatible with most current browsers (IE8/9/10/11, Chrome, Firefox, Safari, etc.), the bottom layer relies on the lightweight Canvas class library ZRender, providing intuitive, vivid, interactive, highly customized data visualization chart.
Official website address: https://www.echartsjs.com/zh/index.html
Enter the official website and choose the corresponding version to download. Then a js file is introduced directly.
ECharts, an open source visual chart library implemented by JavaScript, can run smoothly on PC and mobile devices, and is compatible with most browsers (IE8/9/10/11, Chrome, Firefox, Safari, etc.)
ECharts provides regular line graphs, bar graphs, pie graphs, radar graphs, K-line graphs, scatter graphs, etc
This time I mainly talk about six cases. Each case has detailed comments. You can also paste and copy directly to see the running effect. However, it should be noted that the file location of the introduced ECharts plug-in should be based on your own directory.
First case: column chart
<!DOCTYPE html>
<html>
	<head>
		<meta charset="utf-8">
		<title></title>
		<style type="text/css">
			#box{
				width: 500px;height: 350px;margin: 50px auto;border: #000000 1px solid;

			}
		</style>


	</head>
	<body>
		<!--Prepare a container for the chart-->
		<div id="box" ></div>

		<script src="../echarts plug-in unit/echarts.min.js" ></script>
		<script type="text/javascript">
			//Initializing a chart instance for a container
			var MyChart=echarts.init(document.getElementById("box"));

			//Specify chart configuration items and data
			var option={
			title:{
				//left:20 , / / set the distance between the chart title and the left, or the right
				//top:10 , / / set the distance between the top side and the bottom side of the chart title
				//It should be noted that the values left, top, right and bottom are shared by the main title and subtitle. When the main title is set, the subtitle will move with it
				text:'Week N Weekly sales trend',  //Main title
				link:'https://blog.csdn.net/m0_46188681',//Set to assign a connection address to the main header
				target:'self',//Set how to open the connection address
				textStyle:{ //Set the text style of the main title
					color:'#5555ff',
					//fontSize:40
				},
				subtext:'car sales ',   //Subtitle
				sublink:'http://www.baidu.com',//Set to assign a connection address to the subtitle
				subtextStyle:{ //Set text style for subtitles
					color:'#0000ff',
					fontSize:16
				},
			},
				legend:{},//Display the legend description, and display the name value corresponding to the data
				tooltip:{},//Display data information
				xAxis:{//X axis
					data:["Monday","Tuesday","Wednesday","Thursday","Friday","Saturday","Sunday",]  //The name corresponding to the data on the X axis
				},
				yAxis:{},//Y axis
				series:[{
					name:'Car sales',
					type:'bar',//Indicates that the chart type is histogram
					// type:'line', / / indicates that the chart type is histogram
					data:[10,18,15,20,23,28,30]   //Data displayed on Y axis
				}]

			};

			//Display configuration items and data
			MyChart.setOption(option);
		</script>
	</body>
</html>
Operation effect: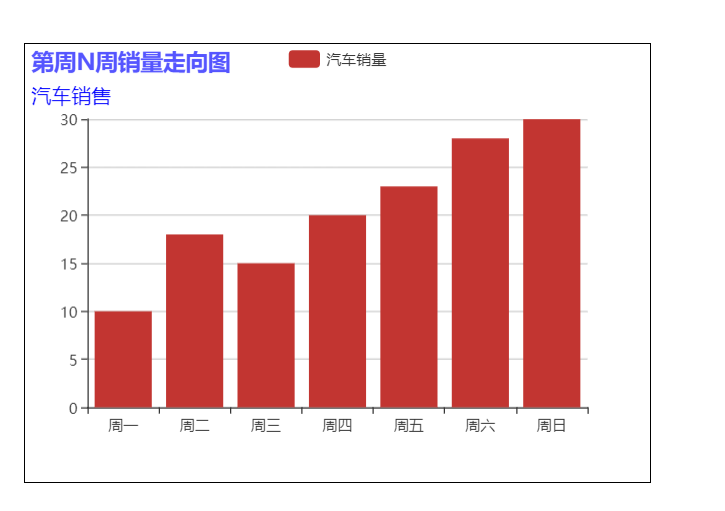
The second case: configuration and style setting of column chart
<!DOCTYPE html>
<html>
	<head>
		<meta charset="utf-8">
		<title></title>
		<style type="text/css">
			#box{
				width: 500px;height: 350px;margin: 50px auto;border: #000000 1px solid;

			}
		</style>


	</head>
	<body>
		<!--Prepare a container for the chart-->
		<div id="box" ></div>

		<script src="../echarts plug-in unit/echarts.min.js" ></script>
		<script type="text/javascript">
			//Initializing a chart instance for a container
			var MyChart=echarts.init(document.getElementById("box"));

			//Specify chart configuration items and data
			var option={
			title:{
				//left:20 , / / set the distance between the chart title and the left, or the right
				//top:10 , / / set the distance between the top side and the bottom side of the chart title
				//It should be noted that the values left, top, right and bottom are shared by the main title and subtitle. When the main title is set, the subtitle will move with it
				text:'Week N Weekly sales trend',  //Main title
				link:'https://blog.csdn.net/m0_46188681',//Set to assign a connection address to the main header
				target:'self',//Set how to open the connection address
				textStyle:{ //Set the text style of the main title
					color:'#5555ff',
					//fontSize:40
				},

			},
				legend:{//Display the legend description, and display the name value corresponding to the data
					//Set the style of the legend name of car sales volume
					right:10,
					//bottom:10,
					top:10,
					textStyle:{
						color:'#55ff00',
						fontSize:20
					},
				},

				tooltip:{},//Display data information
				xAxis:{//X axis
					name:'date',
					nameTextStyle:{  //Axis name style
						color:'#363636',
						fontSize:16,
								},
						axisLine:{  //Coordinate axis setting, the coordinate axis and the text under the coordinate axis will also change together
								lineStyle:{
								color:'#969696',
								width:3  //Set the thickness of the axis
										}
								},
					data:["Monday","Tuesday","Wednesday","Thursday","Friday","Saturday","Sunday",]  //The name corresponding to the data on the X axis
				},
				yAxis:{ //Set y-axis name
					name:'Unit: Vehicle',
					nameTextStyle:{  //Axis name style
						color:'#181818',
						fontSize:12,
								},
						axisLine:{  //Coordinate axis setting, the coordinate axis and the text under the coordinate axis will also change together
								lineStyle:{
								color:'#060606',
								width:3  //Set the thickness of the axis
										}
								},
				},//Y axis
				series:[{
					name:'Car sales',
					type:'bar',//Indicates that the chart type is histogram
					// type:'line', / / indicates that the chart type is histogram
					data:[10,18,15,20,23,28,30]   ,//Data displayed on Y axis

					markLine:{//Chart marking
						data:[{type:"max",name:'Maximum'}],
						//'min' minimum. '' maximum. 'average' average. 'media' median name: the Chinese character displayed when the mouse moves over the line
						lineStyle:{
							color:'#55ff7f',
							width:2
						}

					}
				}]

			};

			//Display configuration items and data
			MyChart.setOption(option);
		</script>
	</body>
</html>
Operation rendering: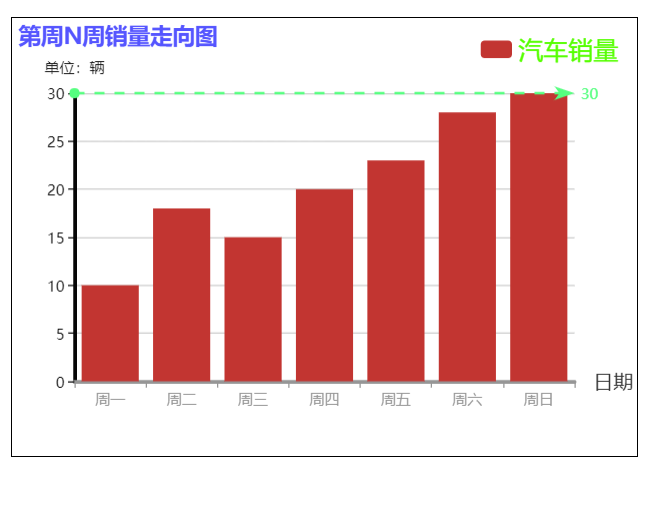
The third case: switching effect of column chart and line chart
<!DOCTYPE html>
<html>
	<head>
		<meta charset="utf-8">
		<title></title>
		<style type="text/css">

			#box{
				width: 600px;height: 500px;
			}
			.button{
				width: 150px;height:30px;line-height: 30px;
				position: relative;left: 600px;top: -480px;
			}
		</style>

			<!--Official website address: https://www.echartsjs.com/zh/index.html-->
			<!--ECharts,One use JavaScript The open source visual chart library can run smoothly in PC Compatible with most current browsers on mobile devices(IE8/9/10/11,Chrome,Firefox,Safari Etc.)-->
			<!--ECharts It provides conventional line chart, histogram, pie chart, radar chartKLine chart, scatter chart....-->
	</head>
	<body>
		<!--Prepare a container for the chart-->
		<div id="box" ></div>
		<!-- Toggle button -->
		<div class="button">
			<button id="line">Line chart</button>
			<button id="bar">Histogram</button>
		</div>

		<script src="../echarts plug-in unit/echarts.min.js" ></script>
		<script type="text/javascript">
			//Initializing a chart instance for a container
			var MyChart=echarts.init(document.getElementById("box"));

			//Specify chart configuration items and data
			var option={
			title:{
				//left:20 , / / set the distance between the chart title and the left, or the right
				//top:10 , / / set the distance between the top side and the bottom side of the chart title
				//It should be noted that the values left, top, right and bottom are shared by the main title and subtitle. When the main title is set, the subtitle will move with it
				text:'Week N Weekly sales trend',  //Main title
				link:'https://blog.csdn.net/m0_46188681',//Set to assign a connection address to the main header
				target:'self',//Set how to open the connection address
				textStyle:{ //Set the text style of the main title
					color:'#5555ff',
					//fontSize:40
				},

			},
				legend:{//Display the legend description, and display the name value corresponding to the data
					//Set the style of the legend name of car sales volume
					right:10,
					//bottom:10,
					top:10,
					textStyle:{
						color:'#55ff00',
						fontSize:20
					},
				},
					// Color: ['× ff0000', '× 00ff00', '× 0000ff'], / / color list of color palette
				tooltip:{},//Display data information
				xAxis:{//X axis
					name:'date',
					nameTextStyle:{  //Axis name style
						color:'#363636',
						fontSize:16,
								},
						axisLine:{  //The coordinate axis setting, the coordinate axis and the text under the coordinate axis will also change together
								lineStyle:{
								color:'#969696',
								width:3  //Set the thickness of the axis
										}
								},
					data:["Monday","Tuesday","Wednesday","Thursday","Friday","Saturday","Sunday",]  //The name corresponding to the data on the X axis
				},
				yAxis:{ //Set y-axis name
					name:'Unit: Vehicle',
					nameTextStyle:{  //Axis name style
						color:'#181818',
						fontSize:12,
								},
						axisLine:{  //Coordinate axis setting, the coordinate axis and the text under the coordinate axis will also change together
								lineStyle:{
								color:'#060606',
								width:3  //Set the thickness of the axis
										}
								},
				},//Y axis
				series:[{
					name:'Car sales',
					type:'bar',//Indicates that the chart type is histogram
					// type:'line', / / indicates that the chart type is histogram
					data:[10,18,15,20,23,28,30]   ,//Data displayed on Y axis

					markLine:{//Chart line
						data:[{type:"max",name:'Maximum'}],
						//'min' minimum. '' maximum. 'average' average. 'median' name: refers to the Chinese character when the mouse moves over the line
						lineStyle:{
							color:'#55ff7f',
							width:2
						}

					}
				}]

			};

			//Display configuration items and data
			MyChart.setOption(option);
			//Switch to bar chart button
			document.getElementById("bar").onclick=function(){
				option.series[0].type='bar';
				MyChart.setOption(option);
			}

			//Switch to line chart button
			document.getElementById("line").onclick=function(){
				option.series[0].type='line';
				MyChart.setOption(option);
			}
		</script>
	</body>
</html>
Operation result: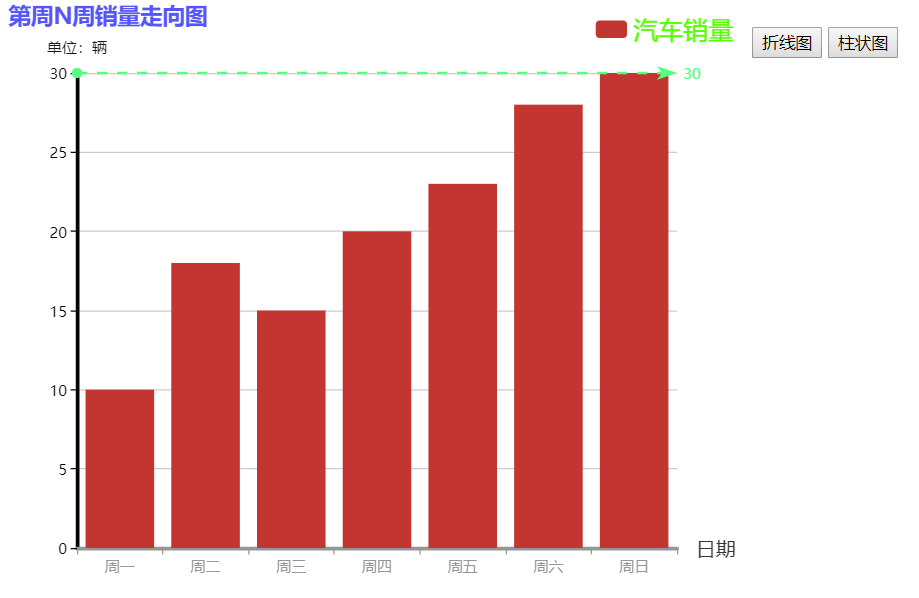
The fourth case: setting method of multiple data
<!DOCTYPE html>
<html>
	<head>
		<meta charset="utf-8">
		<title></title>
		<style type="text/css">
			#box{
				width: 500px;height: 350px;margin: 50px auto;border: #000000 1px solid;

			}
		</style>

			<!--Official website address: https://www.echartsjs.com/zh/index.html-->
			<!--ECharts,One use JavaScript The open source visual chart library can run smoothly in PC Compatible with most current browsers on mobile devices(IE8/9/10/11,Chrome,Firefox,Safari Etc.)-->
			<!--ECharts It provides conventional line chart, histogram, pie chart, radar chartKLine chart, scatter chart....-->
	</head>
	<body>
		<!--Prepare a container for the chart-->
		<div id="box" ></div>

		<script src="../echarts plug-in unit/echarts.min.js" ></script>
		<script type="text/javascript">
			//Initializing a chart instance for a container
			var MyChart=echarts.init(document.getElementById("box"));

			//Specify chart configuration items and data
			var option={
			title:{
				//left:20 , / / set the distance between the chart title and the left, or the right
				//top:10 , / / set the distance between the top side and the bottom side of the chart title
				//It should be noted that the values left, top, right and bottom are shared by the main title and subtitle. When the main title is set, the subtitle will move with it
				text:'Week N Weekly sales trend',  //Main title
				link:'https://blog.csdn.net/m0_46188681',//Set to assign a connection address to the main header
				target:'self',//Set how to open the connection address
				textStyle:{ //Set the text style of the main title
					color:'#5555ff',
					//fontSize:40
				},

			},
				legend:{//Display the legend description, and display the name value corresponding to the data
					//Set the style of the legend name of car sales volume
					right:10,
					//bottom:10,
					top:10,
					textStyle:{
						color:'#1f5f00',
						fontSize:20
					},
				},
					color:['#ff0000','#aaff00','#0000ff'],//Palette color list
				tooltip:{},//Display data information
				xAxis:{//X axis
					name:'date',
					nameTextStyle:{  //Axis name style
						color:'#363636',
						fontSize:16,
								},
						axisLine:{  //Coordinate axis setting, the coordinate axis and the text under the coordinate axis will also change together
								lineStyle:{
								color:'#969696',
								width:3  //Set the thickness of the axis
										}
								},
					data:["Monday","Tuesday","Wednesday","Thursday","Friday","Saturday","Sunday",]  //The name corresponding to the data on the X axis
				},
				yAxis:{ //Set y-axis name
					name:'Unit: Vehicle',
					nameTextStyle:{  //Axis name style
						color:'#181818',
						fontSize:12,
								},
						axisLine:{  //Coordinate axis setting, the coordinate axis and the text under the coordinate axis will also change together
								lineStyle:{
								color:'#060606',
								width:3  //Set the thickness of the axis
										}
								},
				},//Y axis
				series:[{
					name:'Beijing Modern',
					type:'bar',//Indicates that the chart type is histogram
					// type:'line', / / indicates that the chart type is histogram
					data:[10,18,15,20,23,28,30],//Data displayed on Y axis

					markLine:{//Chart line
						data:[{type:"max",name:'Maximum'}],
						//'min' minimum. '' maximum. 'average' average. 'median' name: refers to the Chinese character when the mouse moves over the line
						lineStyle:{
							color:'#55ff7f',
							width:2
						}
					},
				},{
					name:'Benz',
					type:'bar',//It indicates that the chart type is histogram, and of course, it can also be changed into line chart value
					data:[9,12,17,15,18,6,19]   //data
				},
				{
					name:'public',
					type:'bar',//It indicates that the chart type is histogram, and of course, it can also be changed into line chart value
					data:[5,22,12,25,13,16,20]   //data
				}
				]

			};

			//Display configuration items and data
			MyChart.setOption(option);
		</script>
	</body>
</html>
Operation result: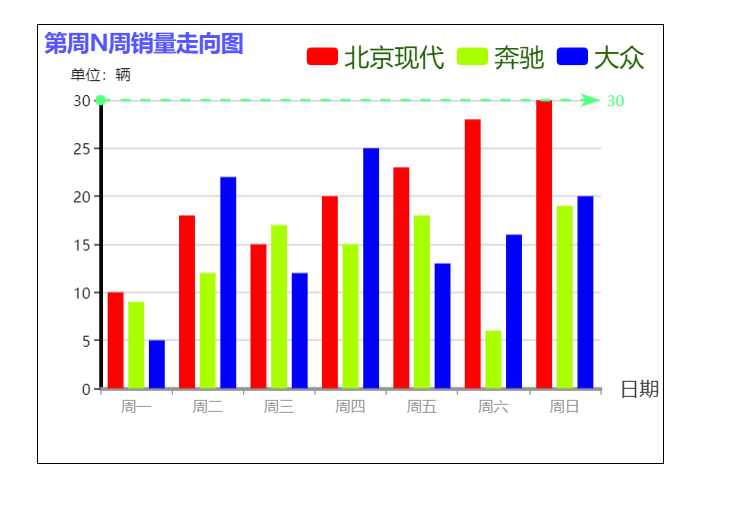
Fifth case: pie chart
<!DOCTYPE html>
<html>
	<head>
		<meta charset="UTF-8">
		<title></title>
		<style type="text/css">
			#box{
				width: 700px;height: 500px;border: 2px solid #000000;margin: 0 auto;
			}
		</style>
	</head>
	<body>

		<!--Prepare a container for the chart-->
		<div id="box" ></div>

			<script src="../echarts plug-in unit/echarts.min.js" ></script>
		<script type="text/javascript">
			//Initializing a chart instance for a container
			var myChart=echarts.init(document.getElementById("box"));

			//Specify chart configuration items and data
			var option={
				title:{text:'Car sales'},
				tooltip:{},
				legend:{},
				series:[{
					type:'pie',//Indicates that the chart type is pie chart
					radius:'60%',//Set pie size
					data:[ //data
						{name:'Monday',value:'10'},
						{name:'Tuesday',value:'12'},
						{name:'Wednesday',value:'18'},
						{name:'Thursday',value:'13'},
						{name:'Friday',value:'119'},
						{name:'Saturday',value:'25'},
						{name:'Sunday',value:'11'},
					]
				}]
			};

			//Display configuration items and data
			myChart.setOption(option);
		</script>


	</body>
</html>
Operation result: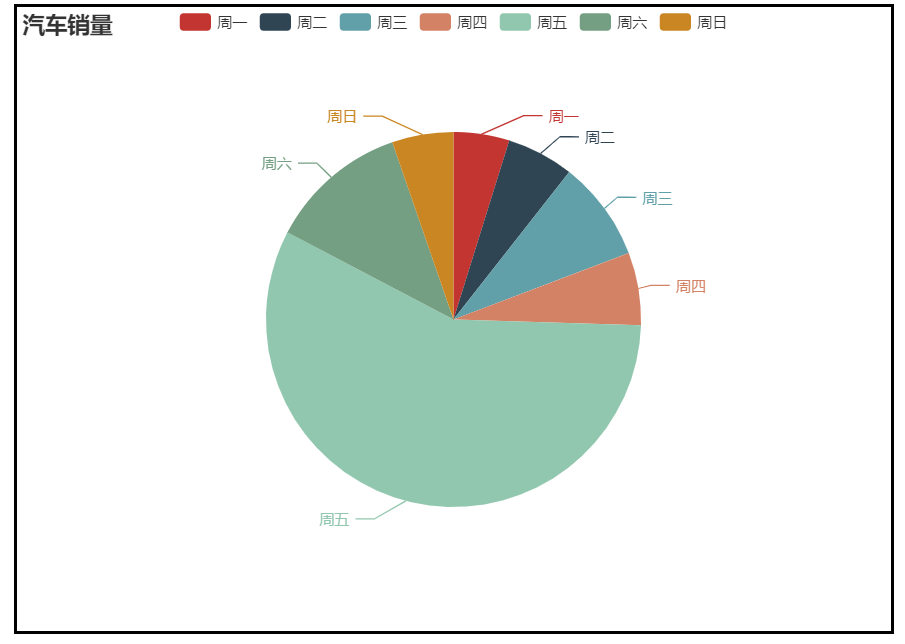
Sixth case: radar map
<!DOCTYPE html>
<html>
	<head>
		<meta charset="UTF-8">
		<title></title>
		<style type="text/css">
			#box{
				width: 600px;height: 500px;border: 1px solid #000000;margin: 0 auto;
			}
		</style>
	</head>
	<body>

		<!--Prepare a container for the chart-->
		<div id="box" ></div>

	<script src="../echarts plug-in unit/echarts.min.js" ></script>
		<script type="text/javascript">
			//Initializing a chart instance for a container
			var myChart=echarts.init(document.getElementById("box"));

			//Specify chart configuration items and data
			var option={
				title:{text:'Car sales'},
				tooltip:{},
				legend:{},
				radar:{//Radar chart coordinate system component, only applicable to radar chart
					name:{//Configuration item of each indicator name in radar chart
						textStyle:{
							color:'#ffffff',
							backgroundColor:'#999',
							padding:[3,5],
							borderRadius:5
						}
					},
					indicator:[//Indicator of radar chart, used to specify multiple variables (dimensions) in radar chart
						{name:'Monday',max:30},
						{name:'Tuesday',max:40},
						{name:'Wednesday',max:50},
						{name:'Thursday',max:50},
						{name:'Friday',max:50},
						{name:'Saturday',max:40},
						{name:'Sunday',max:30},
					]
				},

				series:[{
					type:'radar',//Indicates that the chart type is radar chart
					data:[{
						name:'bmw',
						value:[25,38,48,42,38,18,22]
					},{
						name:'public',
						value:[15,28,26,32,40,38,26]
					}]
				}]
			};

			//Display configuration items and data
			myChart.setOption(option);
		</script>


	</body>
</html>
Operation result: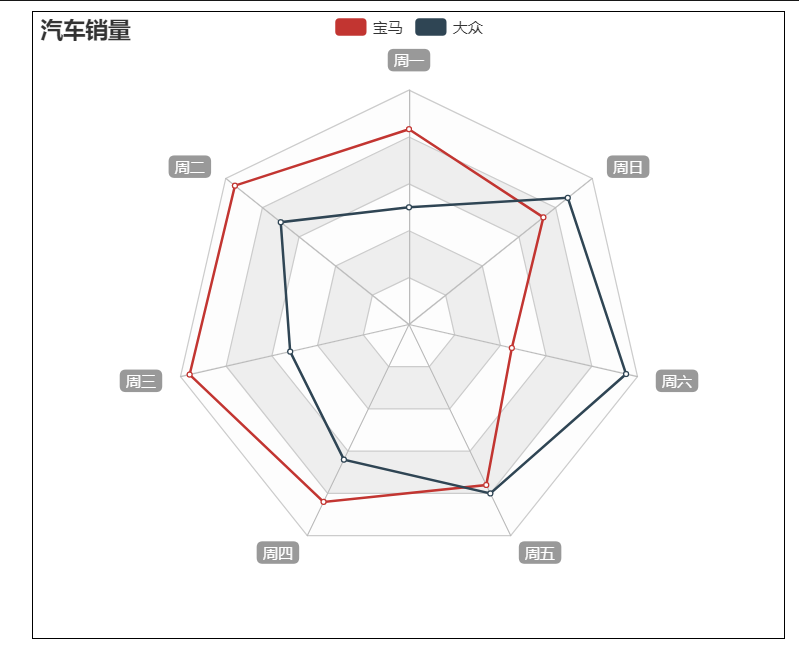
Of course, there are many instances in this official website address. If you have a foundation, you can understand what kind of chart you need at that time by looking at the instance, and then you can modify it yourself.
Instance address: Instance address
.