meerkat is the service monitoring and service downgrade basic component developed by iQIYI mobile service side team. It mainly solves the problem of success rate, response time and QPS index monitoring when calling external interface. At the same time, when the success rate drops below the preset threshold, the call of external interface is automatically cut off, and the request is automatically restored after the success rate of external interface is restored.This article will introduce the usage and advanced features.
Project Home Page: https://github.com/qiyimbd/me...
Why monitor and melt
In our Java services, external interfaces are often called for data acquisition operations. When the success rate of these external interfaces is low, it directly affects the success rate of the service itself. Therefore, we added monitoring of the success rate and response time of external interface calls, which can be pre-discovered and solved before a large number of user impacts occur.At the same time, for non-critical data in the interface, we have adopted a more successful way to determine trigger fuse, automatically stop access to this external interface when power drops below the preset threshold to ensure that critical data can be provided properly, and automatically resume requests when power resumes.
Major meerkat features
Monitoring: Monitor success rates and response time metrics for internal Java operations
Report: log file and Grafhit are two ways of reporting monitoring indicators, supporting the expansion of other reporting methods
Fuse: (optional function) Success rate drops below the preset threshold to trigger fuse protection, temporary access to external interfaces, and automatic recovery of access after recovery of success rate
Basic Use
maven
<dependency>
    <groupId>com.github.qiyimbd</groupId>
    <artifactId>meerkat</artifactId>
    <version>1.0</version>
</dependency>
Define monitored operations
Assuming that our service needs to query the number of playback times of a program from the HTTP interface, to prevent this HTTP interface from overwhelming timeouts affecting the quality of our own service, we can define a query Command:
public class GetPlayCountCommand extends FusingCommand<Long> {

    private final Long videoID;

    public GetPlayCountCommand(Long videoID) {
        this.videoID = videoID;
    }

    protected Optional<Long> run() {
        Long result = 0l;
        // Call the HTTP interface to get the number of times the video is played
        // If the call fails, null is returned or an exception is thrown, the operation is recorded as a failure
        // If the ID is illegal, returning Optional.absent() will record the operation as successful
        return Optional.fromNullable(result);
    }
}
Execute the query:
//Gets the number of times a video with a video ID of 123 is played
GetPlayCountCommand command = new GetPlayCountCommand(123l);
Long result = command.execute(); // Perform a query operation and return null if execution fails or is in a fused state
Configure monitoring reporting
Monitoring reporting needs to be set up when the service is initialized.The following example turns on the printing of monitoring data to a log file
MeterCenter.INSTANCE
    .enableReporter(new EnablingLogReporter("org.apache.log4j.RollingFileAppender"))
    .init();
View statistics
The statistics are grouped by the name of the fuse command class.For example, if the GetPlayCountCommand class we defined earlier and the package name is com.qiyi.mbd.test, the output in the log would look like this:
type=GAUGE, name=com.qiyi.mbd.test.GetPlayCountCommand.normal-rate, value=0.0
type=GAUGE, name=com.qiyi.mbd.test.GetPlayCountCommand.success-rate, value=61.0
type=TIMER, name=com.qiyi.mbd.test.GetPlayCountCommand.time, count=25866500, min=0.0, max=0.001, mean=3.963926781047921E-5, stddev=1.951102156677818E-4, median=0.0, p75=0.0, p95=0.0, p98=0.001, p99=0.001, p999=0.001, mean_rate=649806.0831335272, m1=1665370.7316699813, m5=2315813.300713087, m15=2446572.324069477, rate_unit=events/second, duration_unit=milliseconds
| Monitoring Items | Meaning |
|---|---|
| [classname].success-rate | Success rate |
| [classname].time.m1 | QPS |
| [classname].time.mean | Average response time |
| [classname].normal-rate | Proportion of normal access (non-fused) time in the last minute |
Use monitoring alone
If you don't want to use the fuse function, but just want to monitor the time and success of Java method calls, you can implement it directly using OperationMeter by adding a start and end call before and after the function call:
//Create a counter for an operation
    OperationMeter meter = MeterCenter.INSTANCE.getOrCreateMeter(OperationMeterTest.class, OperationMeter.class);

    //Simulation success rate 60%
    for(int k=0; k<100; k++){
        Timer.Context context = meter.startOperation();
        if(k%10<6){
            meter.endOperation(context, OperationMeter.Result.SUCCESS);
        } else {
            meter.endOperation(context, OperationMeter.Result.FAILURE);
        }
    }
Open the fuse and configure the threshold and duration
First, create an interface, inherited from FusingConfig, that specifies the loading path for the configuration file and also sets the refresh time for the configuration file. For more details, see owner document
@Config.Sources("classpath:app_config.properties")
@Config.HotReload(
        value = 1, unit = java.util.concurrent.TimeUnit.MINUTES,
        type = Config.HotReloadType.ASYNC)
public interface APPFusingConfig extends FusingConfig {
}
Pass in constructor when creating query Command
public class GetPlayCountCommand extends FusingCommand<Long> {

    private final Long videoID;

    public GetPlayCountCommand(Long videoID) {
        super( APPFusingConfig.class);  //Set Profile
        this.videoID = videoID;
    }

    protected Optional<Long> run() {
        Long result = 0l;
        // Call the HTTP interface to get the number of times the video is played
        // If the call fails, null is returned or an exception is thrown, the operation is recorded as a failure
        // If the ID is illegal, returning Optional.absent() will record the operation as successful
        return Optional.fromNullable(result);
    }
}
The configuration file is as follows:
| Monitoring Items | Meaning | Default value |
|---|---|---|
| fusing.[CommandClassName].mode | Fuse mode: FORCE_NORMAL - Turn off the fusing function; AUTO_FUSING - Automatically enters the fuse mode; FORCE_NORMAL - Forced Fuse |
FORCE_NORMAL |
| fusing.[CommandClassName].duration | The duration after triggering a melt, supporting ms,sec,min units.For example, 10sec | 50sec |
| fusing.[CommandClassName].success_rate_threshold | The success threshold for triggering a fuse, below which a fuse will be triggered, e.g. 0.9 means 90% success. | 0.9 |
The CommandClassName in the configuration file is the name of each operation class, and these parameters can be set individually for each operation.At the same time, this profile supports dynamic loading and is willing to trigger or close a melt manually by modifying fusing.[CommandClassName].mode.
Monitoring Indicators Report to Graphite
Our service uses Metric+Graphite+Gafana for collecting, storing and displaying monitoring data. Here's how to configure monitoring data reporting Grafana. For Graphite+Grafana configuration, you can refer to the article: Use graphite and grafana for application monitoring
Define Configuration File
First, define an interface that inherits from GraphiteReporterConfig and defines the load path for the configuration file.For a definition of the profile path, see owner document Here is an example:
@Config.Sources("classpath:config.properties")
public interface MyConfig extends GraphiteReporterConfig {
}
The following are defined in the configuration file:
| Configuration Items | Meaning |
|---|---|
| meter.reporter.enabled.hosts | Open Server List for Monitoring Uploads |
| meter.reporter.perfix | Prefix used for reporting |
| meter.reporter.carbon.host | IP address of grafana(carbon-cache), used to store monitoring data |
| meter.reporter.carbon.port | Port for grafana(carbon-cache) |
The following example opens monitoring data reporting on 192.168.0.0.1 and 192.168.0.0.2 servers, prefixed with project_name.dc:
meter.reporter.enabled.hosts = 192.168.0.0.1,192.168.0.0.2
meter.reporter.perfix = project_name.dc
meter.reporter.carbon.host = hostname.graphite
Since different servers in the same computer room generally have similar access to external interfaces, it is also to save resources to select only some machines to report.Selecting only part of the machine to report does not affect the melting effect.
Initialize Configuration Upload
Monitoring reporting needs to be set up when the service is initialized.In the following example, monitoring data is printed to a log file and Graphite configuration information is loaded through the configuration file specified by MyConfig.
MeterCenter.INSTANCE
    .enableReporter(new EnablingLogReporter("org.apache.log4j.RollingFileAppender"))
    .enableReporter(new EnablingGraphiteReporter(MyConfig.class))   //Monitoring data to Grafana
    .init();
View statistics
The statistics are grouped by the name of the fuse command class.For example, if the GetPlayCountCommand class we defined earlier and the package name is com.qiyi.mbd.test, the output in the log would look like this:
type=GAUGE, name=com.qiyi.mbd.test.GetPlayCountCommand.normal-rate, value=0.0
type=GAUGE, name=com.qiyi.mbd.test.GetPlayCountCommand.success-rate, value=61.0
type=TIMER, name=com.qiyi.mbd.test.GetPlayCountCommand.time, count=25866500, min=0.0, max=0.001, mean=3.963926781047921E-5, stddev=1.951102156677818E-4, median=0.0, p75=0.0, p95=0.0, p98=0.001, p99=0.001, p999=0.001, mean_rate=649806.0831335272, m1=1665370.7316699813, m5=2315813.300713087, m15=2446572.324069477, rate_unit=events/second, duration_unit=milliseconds
| Monitoring Items | Meaning |
|---|---|
| [classname].success-rate | Success rate |
| [classname].time.m1 | QPS |
| [classname].time.mean | Average response time |
| [classname].normal-rate | Proportion of normal access (non-fused) time in the last minute |
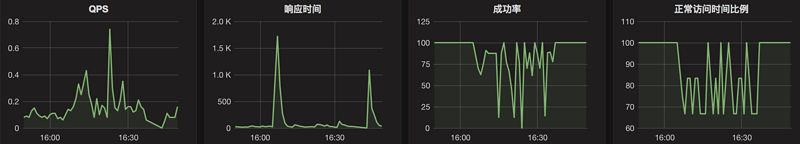
In Grafanna, you can see the following monitoring map:
Custom Monitoring Upload
meerkat uses Metrics Statistics of monitoring data are made so that all reports supported by Metrics can be used for reporting.When adding a report, you only need to implement EnablingReporter and make a call before MeterCenter initializes.The following is the implementation of log reporter for reference
public class EnablingLogReporter implements EnablingReporter {
    private String loggername;

    public EnablingLogReporter(String loggername) {
        this.loggername = loggername;
    }

    @Override
    public void invoke(MetricRegistry metricRegistry, long period, TimeUnit timeUnit) {
        Slf4jReporter.forRegistry(metricRegistry)
                .outputTo(LoggerFactory.getLogger(loggername))
                .convertRatesTo(java.util.concurrent.TimeUnit.SECONDS)
                .convertDurationsTo(java.util.concurrent.TimeUnit.MILLISECONDS)
                .build().start(period, timeUnit);
    }
}
Start reporter when MeterCenter initializes
MeterCenter.INSTANCE
    .enableReporter(new EnablingLogReporter("org.apache.log4j.RollingFileAppender"))
    .init();
Multi-Instance Monitoring
Multi-instance monitoring is mainly to solve the situation that an implementation class of a monitored operation needs to be monitored and fused separately according to the input parameters, which is achieved by defining the name of the instance.For example, an example of getting the number of video playback, the interface for getting the number of video playback is the same for different video types, so the same class is used to implement it; however, for different video types, the complexity of the interface implementation results in different success rates, and we don't want to simultaneously fail when the user uploads a large number of video playback interfaces.The number of times a video, such as a fused movie or TV series, is played, and the feature of multiple instances is used to monitor and fuse it.
The following is a single-instance implementation:
public class GetPlayCountCommand extends FusingCommand<Long> {

    private final Long videoID;

    public GetPlayCountCommand(Long videoID) {
        super( APPFusingConfig.class);
        this.videoID = videoID;
    }

    protected Optional<Long> run() {
        Long result = 0l;
        // Call the HTTP interface to get the number of times the video is played
        // If the call fails, null is returned or an exception is thrown, the operation is recorded as a failure
        // If the ID is illegal, returning Optional.absent() will record the operation as successful
        return Optional.fromNullable(result);
    }
}
Assuming that we can judge the video type based on the video ID in business, we can create multiple monitoring instances based on the type when the class is initialized. The following implementations are added to support multiple instances:
public class GetPlayCountCommand extends FusingCommand<Long> {

    private final Long videoID;

    public GetPlayCountCommand(Long videoID) {
        super( getVideoType(videoID), APPFusingConfig.class);
        this.videoID = videoID;
    }

    private static String getVideoType(Long videoID){
        return "PGC"; //Judging by videoID, return to the two categories "PGC" or "UGC"
    }

    protected Optional<Long> run() {
        Long result = 0l;
        // Call the HTTP interface to get the number of times the video is played
        // If the call fails, null is returned or an exception is thrown, the operation is recorded as a failure
        // If the ID is illegal, returning Optional.absent() will record the operation as successful
        return Optional.fromNullable(result);
    }
Since each instance has a single monitoring indicator, the monitoring results in the log look like this:
type=GAUGE, name=com.qiyi.mbd.test.GetPlayCountCommand.PGC.normal-rate, value=100.0
type=GAUGE, name=com.qiyi.mbd.test.GetPlayCountCommand.PGC.success-rate, value=100.0
type=GAUGE, name=com.qiyi.mbd.test.GetPlayCountCommand.UGC.normal-rate, value=100.0
type=GAUGE, name=com.qiyi.mbd.test.GetPlayCountCommand.UGC.success-rate, value=60.0
type=TIMER, name=com.qiyi.mbd.test.GetPlayCountCommand.PGC.time, count=100, min=0.0, max=0.509, mean=0.00635, stddev=0.05052135687013958, median=0.001, p75=0.002, p95=0.002, p98=0.003, p99=0.003, p999=0.509, mean_rate=1.6680162586215173, m1=8.691964170141569, m5=16.929634497812284, m15=18.919189378135307, rate_unit=events/second, duration_unit=milliseconds
type=TIMER, name=com.qiyi.mbd.test.GetPlayCountCommand.UGC.time, count=100, min=0.0, max=0.027, mean=0.00132, stddev=0.0026939933184772376, median=0.001, p75=0.001, p95=0.002, p98=0.005, p99=0.006, p999=0.027, mean_rate=1.6715904477699361, m1=8.691964170141569, m5=16.929634497812284, m15=18.919189378135307, rate_unit=events/second, duration_unit=milliseconds
Correspondingly, the name of the instance should also be clearly indicated for tear nevi of the melting threshold and duration:
fusing.GetPlayCountCommand.UGC.mode = AUTO_FUSING
fusing.GetPlayCountCommand.UGC.duration = 50sec
fusing.GetPlayCountCommand.UGC.success_rate_threshold = 0.9

fusing.GetPlayCountCommand.PGC.mode = AUTO_FUSING
fusing.GetPlayCountCommand.PGC.duration = 50sec
fusing.GetPlayCountCommand.PGC.success_rate_threshold = 0.9