A heavy snow covered North and East China. The heaven and the earth are linked together, and the city is covered in silver, which is full of poetic and picturesque feelings, and everyone is in high spirits. Friends circle is painted by snow pictures and jokes about road skating and wrestling, and the atmosphere is even warmer than the new year. I also come to join the fun and use python to make the first snow in 2020 even better.
Drawing snowflake patterns, there are many articles on the Internet, but almost all of them are drawn by using Python's built-in module, turtle. This module is suitable for guiding children to learn programming, and it is difficult to really use it in project development. It can also be implemented by pygame, but what pygame pursues is animation effect, and the snowflake pattern is randomly generated circle with general effect.
Using MATLAB lib to draw snowflakes, the focus is to generate Koch Curve. Koch Curve is a kind of fractal, its shape is like snowflake, also known as Koch snowflake, snowflake curve. Given the segment pq, the k-order Koch Curve can be generated by the following steps:
Find out the points u and v
Draw the equilateral triangle uwv outwards (or inwards and outwards) with the line segment uv as the base
Remove segment uv
Repeat the above operations k-1 times for each segment between pq
Koch snowflakes are composed of Koch curves generated by three sides of equilateral triangles. Based on the above analysis, we can easily write the generation function of Koch Snowflake: given an equilateral triangle, and the order k of koch curve, all points in the Koch snowflake pattern are returned.
import numpy as np

plt.rcParams['font.sans-serif'] = ['FangSong'] # Specify default font
plt.rcParams['axes.unicode_minus'] = False #Solve the problem of displaying Chinese as a box

def rotate(p, d):
    """Return point p Rotate counterclockwise around the origin d Coordinates of degree"""

    a = np.radians(d)
    m = np.array([[np.cos(a), np.sin(a)],[-np.sin(a), np.cos(a)]])
    return np.dot(p, m)

def koch_curve(p, q):
    """Line segment pq Generate koch curve, return to uvw Three points"""

    p, q = np.array(p), np.array(q)
    u = p + (q-p)/3 # The coordinates of the third point u
    v = q - (q-p)/3 # The coordinate of the third point V
    w = rotate(v-u, 60) + u # The coordinate of point w can be obtained by turning the line uv around the u point anticlockwise by 60 °

    return u.tolist(), v.tolist(), w.tolist()

def snow(triangle, k):
    """Given a triangle, a closed Koch snowflake is generated"""

    for i in range(k):
        result = list()
        t_len = len(triangle)
        for j in range(t_len):
            p = triangle[j]
            q = triangle[(j+1)%t_len]
            u, v, w = koch_curve(p, q)
            result.extend([p, u, w, v])
        triangle = result.copy()

    triangle.append(triangle[0])
    return triangle
With the data of snowflake pattern, it is very easy to draw with matplotlib:
import numpy as np
import matplotlib.pyplot as plt

def plot_snow(snow_list):
    """Draw snowflakes"""

    for triangle, k in snow_list:
        data = np.array(snow(triangle, k))
        x, y = np.split(data, 2, axis=1)
        plt.plot(x, y)

    plt.axis('equal')
    plt.show()

snow_list = [
    ([(0,0), (0.5,0.8660254), (1,0)], 5),
    ([(1.1,0.4), (1.35,0.8330127), (1.6,0.4)], 4),
    ([(1.1,-0.1), (1.25,0.15980761), (1.4,-0.1)], 3)
]
plot_snow(snow_list)
Let's see our snowflake effect. From small to large, the three snowflakes correspond to the Koch snowflakes of level 3, level 4 and level 5 respectively.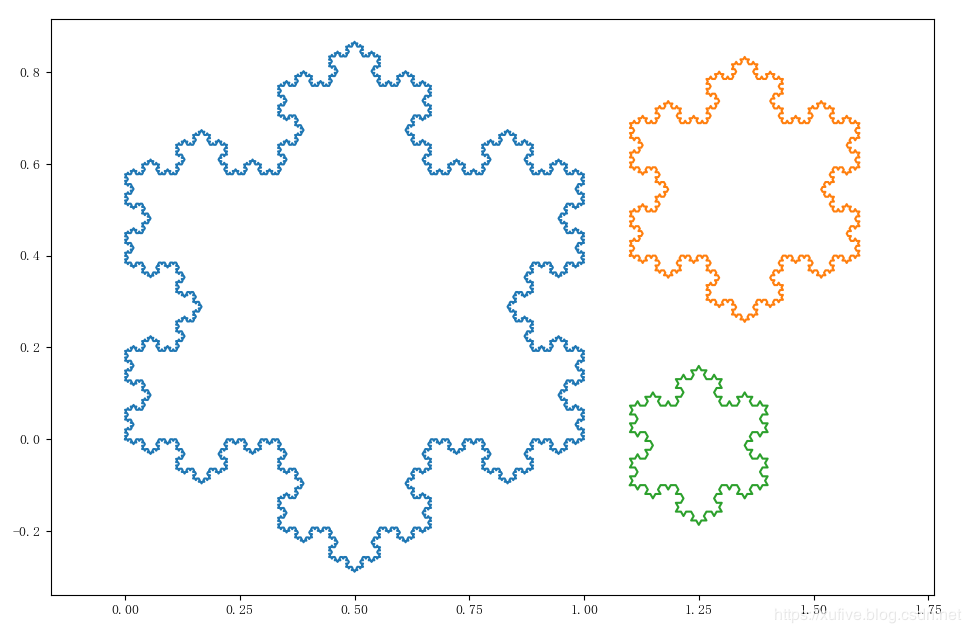
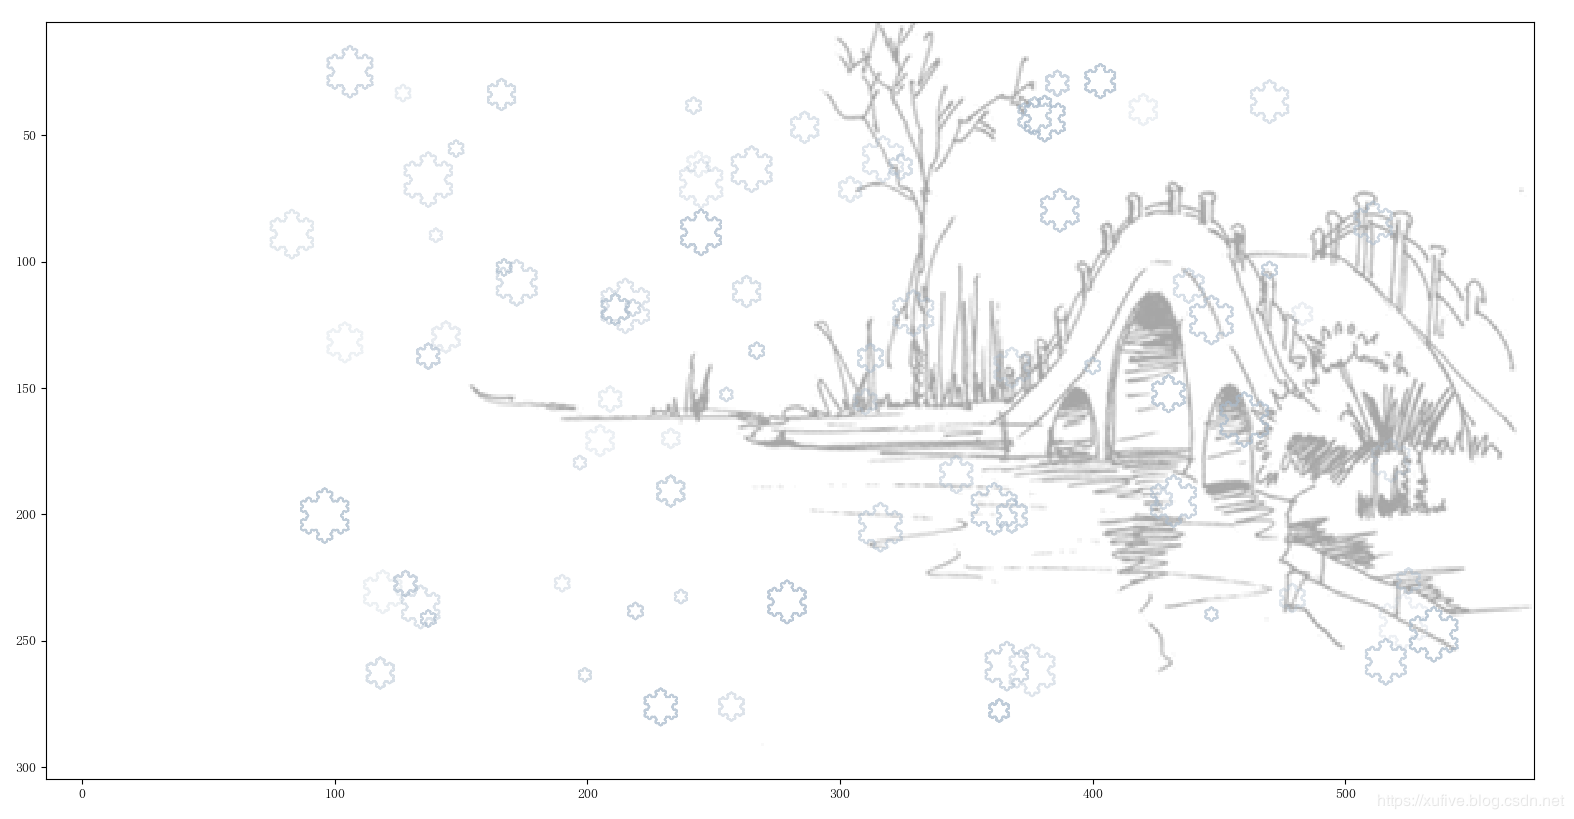
import numpy as np
import matplotlib.pyplot as plt
from PIL import Image

def draw_scenery():
    """Draw a snowscape"""

    im = Image.open('brage.png')
    bg = np.array(im)
    plt.imshow(bg) # Draw background

    for i in range(80):
        x = np.random.randint(80, im.size[0]-80)
        y = np.random.randint(30, im.size[1]-30)
        r = np.random.randint(5, 20)
        a = np.random.random()*0.6 + 0.2
        v = np.array((x-r/2, y))
        u = np.array((x+r/2, y))
        w = rotate(v-u, 60) + u

        data = np.array(snow([(u[0],u[1]),(w[0],w[1]),(v[0],v[1])], 5))
        x, y = np.split(data, 2, axis=1)
        plt.plot(x, y, c='#AABBCC', lw=1, ls='-', alpha=a)

    plt.axis('equal')
    plt.show()

draw_scenery()