Part I About Highcharts.js Chart Library:
1. Introduction: Highcharts is a chart library written in pure javascript, which can add interactive charts to Web sites or Web applications. Now the latest official version is API document updated to 5.0.7.
2. Chart types are abundant:
| 1 | Diagram |
| 2 | Regional map |
| 3 | Pie chart |
| 4 | Scatter plot |
| 5 | Bubble chart |
| 6 | Dynamic charts |
| 7 | Composite chart |
| 8 | 3D map |
| 9 | Survey map |
| 10 | Hotspot map |
| 11 | Treemap |
3. Compatibility - Support all mainstream browsers and mobile platforms (android, iOS, etc.).
4. Multi-device-support for a variety of devices, such as handheld devices such as the iPhone/iPad, tablet, etc.
5. Free use - for personal free learning.
6. Lightweight - the size of the high charts. JS kernel library is only about 35KB.
7. Simple Configuration - Configuration in json format
8. Dynamics - can be modified after the graph is generated.
9. Multidimensional - Supporting Multidimensional Charts
10. Configuration prompt tool - Mouse moves to a point on the chart with prompt information.
11. Time axis - accurate to milliseconds.
12. Export - Table can be exported to PDF/PNG/JPG/SVG format
13. Output - Page Output Chart.
14. Zoom-select the part of the chart to zoom in and observe the chart at close range.
15. External data - Load dynamic data from the server.
16. Text Rotation - Supports label rotation in any direction
The second part is the application of Highcharts.js chart library:
 @ Er Rong
<!DOCTYPE html>
<html>
<head>
<meta charset="UTF-8">
<title>hightcharts.js Plug-in usage</title>
</head>
<body>
<div id="container" style="width:400px;height:400px;border: 1px solid red;margin: 50px auto;"></div>
</body>
<script src="js/highcharts.js" type="text/javascript" charset="utf-8"></script>
<script type="text/javascript">
var charts = Highcharts.chart('container', {
// Highcharts configuration
chart:{
type:"column"//Here are four choices
},
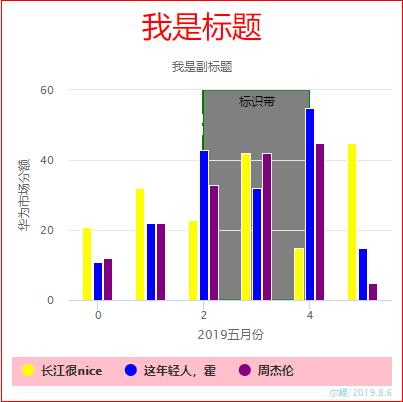
title: {
text: 'I am the title.',
align: "center",
style: {
color: "red",
fontSize: "30px"
}
},
subtitle: {
text: 'I'm the subtitle.'
},
xAxis: {
title: {
text: '2019 May'
},
plotLines: [{
color: 'green', //Line color, defined as red
dashStyle: 'longdashdot', //The style of the marker line, which defaults to solid (solid), is defined here as a long dashed line.
value: 2, //Define which value to display the marker line, where a line is perpendicular to the value of scale 3 on the x-axis
width: 3 //Width of marking line, 2px
}],
plotBands: [{
from: 2, // Marking band start value
to: 4, // Marking band end value
label: { // Labeled text label configuration, see API for details
text:"Identification tape"
},
color: 'gray', // Marker with background color
borderWidth: "lightgrey", // Mark the width of the border
borderColor: "green", // Mark border color
// id:,// tagged with id for deletion and other operations
// zIndex: // Layer Strip Cascade for Adjusting Display Hierarchy
events: { // Events that support click, mouseover, mouseout, mousemove, and so on
click: function(e) {
alert("Nice to meet you!")
},
mouseover: function(e) {},
mouseout: function(e) {},
mousemove: function(e) {}
}
}]
},
yAxis: {
title: {
text: 'Market share'
}
},
series: [{
name: 'The Yangtze River is very nice',
data: [21, 32, 23, 42, 15, 45],
color: "yellow",
}, {
name: 'This young man, Huo',
data: [11, 22, 43, 32, 55, 15],
color: "blue"
}, {
name: 'Jay Chou',
data: [12, 22, 33, 42, 45, 05],
color: "purple"
}],
tooltip: {
enabled: true
},
legend: {
enabled: true,
borderColor: "green",
width: "100%",
backgroundColor: "pink"
},
credits: {
enabled: true,
text: "Er Rong/2019.8.6",
href: "https://www.sogou.com",
style: {
fontsizes: "15px",
color: "lightblue"
}
}
});
</script>
</html>