Case study:
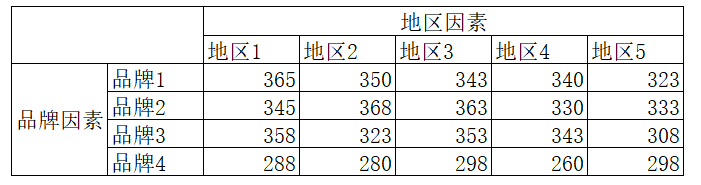
Analyze whether brands and regions have a significant impact on sales volume( )
)
Make assumptions:
In order to test the influence of the two factors, we need to put forward the following assumptions for the two factors.
The assumptions for the line factors are as follows:
Since there are four levels of variable brands, namely brand 1, brand 2, brand 3 and brand 4, in order to test whether the mean value of these four levels (each level represents a whole) is equal.
 Brand has no significant impact on sales volume
 Incomplete equal brand has significant influence on sales volume
The assumptions put forward for the following factors are as follows:
Since there are five levels in the variable region, namely, region 1, region 2, region 3, region 4 and region 5, in order to test whether the mean values of these five levels (each level represents a population) are equal.
 Region has no significant impact on sales volume
 Different regions have significant influence on sales volume
Since variable brands (with 4 levels) and variable regions (with 5 levels), respectively, are retail, tourism, airlines and home appliance manufacturing, in order to test whether the mean values of these four levels (each level represents a whole) are equal, the following assumptions need to be proposed:
# Import related packages
import pandas as pd
import numpy as np
import scipy

# Custom function

def level_avg(data, x_name, y_name):
    df = data.groupby([x_name]).agg(['mean'])
    df = df[y_name]
    dict_ = dict(df["mean"])
    return dict_

def SST(Y):
    sst = sum(np.power(Y - np.mean(Y), 2))
    return sst

def SSA(data, x_name, y_name):
    total_avg = np.mean(data[y_name])
    df = data.groupby([x_name]).agg(['mean', 'count'])
    df = df[y_name]
    ssa = sum(df["count"]*(np.power(df["mean"] - total_avg, 2)))
    return ssa

def SSE(data, y_name):

    data_ = data.copy()
    total_avg = np.mean(data[y_name])
    x_var = set(list(data.columns))-set([y_name])

    cnt=1
    for i in x_var:
        dict_ = level_avg(data, i, y_name)
        var_name = 'v_avg_{}'.format(cnt)
        data_[var_name] = data_[i].map(lambda x: dict_[x])
        cnt += 1

    sse = sum(np.power(data_[y_name] - data_["v_avg_1"] - data_["v_avg_2"] + total_avg, 2))
    return sse

def two_way_anova(data, row_name, col_name, y_name, alpha=0.05):
    """Two factor ANOVA without repetition"""

    n = len(data)                       # Total observations
    k = len(data[row_name].unique())    # Number of horizontal row variables
    r = len(data[col_name].unique())    # Number of horizontal column variables

    sst = SST(data[y_name])             # Total square sum
    ssr = SSA(data, row_name, y_name)   # Sum of squares of row variables
    ssc = SSA(data, col_name, y_name)   # Sum of squares of column variables
    sse = SSE(data, y_name)             # Sum of squares of errors

    msr = ssr / (k-1)
    msc = ssc / (r-1)
    mse = sse / ((k-1)*(r-1))

    Fr = msr / mse  # Row variable statistics F
    Fc = msc / mse  # Column variable statistics F
    pfr = scipy.stats.f.sf(Fr, k-1, (k-1)*(r-1))  # P-value of row variable statistic F
    pfc = scipy.stats.f.sf(Fc, r-1, (k-1)*(r-1))  # P value of column variable statistic F

    Far = scipy.stats.f.isf(alpha, dfn=k-1, dfd=(k-1)*(r-1))   #Line F threshold
    Fac = scipy.stats.f.isf(alpha, dfn=r-1, dfd=(k-1)*(r-1))   #Critical value of column F

    r_square = (ssr+ssc) / sst      # Combined effect / total effect

    table = pd.DataFrame({'Difference source':[row_name, col_name, 'error', 'Total'],
                          'Sum of squares SS':[ssr, ssc, sse, sst],
                          'Freedom df':[k-1, r-1, (k-1)*(r-1), k*r-1],
                          'mean square MS':[msr, msc, mse, '_'],
                          'F value':[Fr, Fc, '_', '_'],
                          'P value':[pfr, pfc, '_', '_'],
                          'F critical value':[Far, Fac, '_', '_'],
                          'R^2':[r_square, '_', '_', '_']})

    return table
# Import data
df = pd.read_excel("E:\\xx Business data.xlsx", sheet_name='source_03')
# Output ANOVA results
two_way_anova(df, 'brand', 'region', 'Sales volume', alpha=0.05)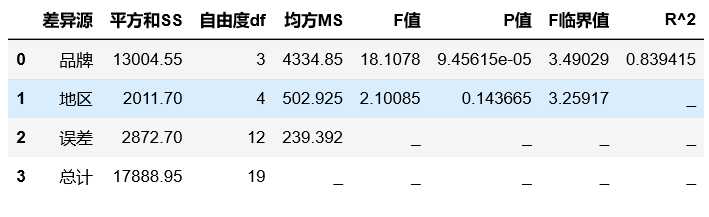
According to the above results of ANOVA, it is explained as follows:
(1) Brand: p-value = 9.45615e-05 <(or F value = 18.1078 > F critical value = 3.49029), reject the original hypothesis. It shows that competitive brands have a significant impact on sales volume.
(2) Region: P-value=0.143665 >(or F value = 2.10085 < f critical value = 3.25917), do not reject the original assumption. There is no evidence that regions have a significant impact on sales.

