Since the company is planning to move to the cloud from idc, one of the preparations is to first sort out the call chain between the current hosts.(
At the ODF conference, Master Gulley has shown us the way (interested in finding what it says: Visual Exploration of Operations and Maintenance Data), which is more beautiful but more complex.
What can I do as a tough dba without those big tricks?(
Of course, I can't give up. Using his ideas for reference, I have come up with a way to compare lowbi.
My thoughts:
1. tcpdump collects 500 packages on each machine and formats them into a unified database
2. select distinct query syntax in the database to find the relationship of data flow of a host
##Create accounts and libraries on a dedicated mysql server 10.0.1.10:
create database tcpdump;

use tcpdump;
CREATE TABLE `graph` (
  `id` int(10) unsigned NOT NULL AUTO_INCREMENT COMMENT 'pk',
  `src` varchar(100) NOT NULL DEFAULT '1.1.1.1' COMMENT 'source address',
  `dest` varchar(100) NOT NULL DEFAULT '2.2.2.2' COMMENT 'Destination Address',
  `cap_time` timestamp NOT NULL DEFAULT CURRENT_TIMESTAMP ON UPDATE CURRENT_TIMESTAMP,
  PRIMARY KEY (`id`)
) ENGINE=InnoDB AUTO_INCREMENT=5101 DEFAULT CHARSET=utf8 COMMENT='Storing data flow direction relationship collected by package capture';

grant select,update,delete,insert on tcpdump.* to 'tcpdump'@'%' identified by 'tcpdump';
Actual running script
vim /root/cap/push.sh
#Yes, below you will see the most low bi usage, get data directly to call mysql client insert

#Query statement:
# SELECT DISTINCT SUBSTRING_INDEX(src, '.', 1) AS src,SUBSTRING_INDEX(dest, '.', 1) AS dest FROM tcpdump.graph WHERE src LIKE 'sh1-%' AND dest LIKE 'sh1-%' AND src LIKE 'sh1-XXXXXX%';

source /etc/profile

port=$(ip a | egrep "10.0.*.*/16" | awk '{print $NF}')

FILE1=dump.log
FILE2=data.log
MYSQL_HOST='10.0.1.10'

tcpdump -i ${port} tcp -p -c 1000 -q > ${FILE1}
cat ${FILE1} | cut -d " " -f 3,5 > ${FILE2}

if `uname -r  | egrep  'el7'` ; then
  mysql_version=/root/cap/mysql_el7
else
  mysql_version=/root/cap/mysql_el6
fi

while read line; do
  echo $line | awk '{print "insert into tcpdump.graph (src,dest) values(\""$1"\",\""$2"\");"}' | ${mysql_version} -h ${MYSQL_HOST} -utcpdump -ptcpdump
done < ${FILE2}
In the /root/cap/directory, I also have two versions of MySQL clients (filenames mysql_el6 and mysql_el7) for writing on different versions of centos.
Deploy to remote host:
ansible xxxx -m copy -a "src=/root/cap/ dest=/root/cap/ owner=root group=root mode=0755"
We can also assume a scheduled task to all hosts by ansible. Of course, my personal recommendation is to migrate to that service. We will run a script to collect data and do analysis on the hosts of corresponding services for a period of time, instead of a full network collection at once. That may be too much data.
Query method:
select
   distinct SUBSTRING_INDEX(src,'.',1) as src,
   SUBSTRING_INDEX(dest,'.',1) as dest
from tcpdump.graph
   where src like 'sh1-rabbitmq01%' ;

//The result is similar to this:
+----------------+----------------+
| src        | dest        |
+----------------+----------------+
| sh1-rabbitmq01 | sh1-web20    |
| sh1-rabbitmq01 | sh1-web25    |
| sh1-rabbitmq01 | sh1-web19    |
| sh1-rabbitmq01 | sh1-datax01   |
| sh1-rabbitmq01 | sh1-web10    |
| sh1-rabbitmq01 | sh1-k8s11    |
| sh1-rabbitmq01 | sh1-web10    |
| sh1-rabbitmq01 | sh1-web10    |
| sh1-rabbitmq01 | sh1-storm04   |
| sh1-rabbitmq01 | sh1-web10    |
+----------------+----------------+
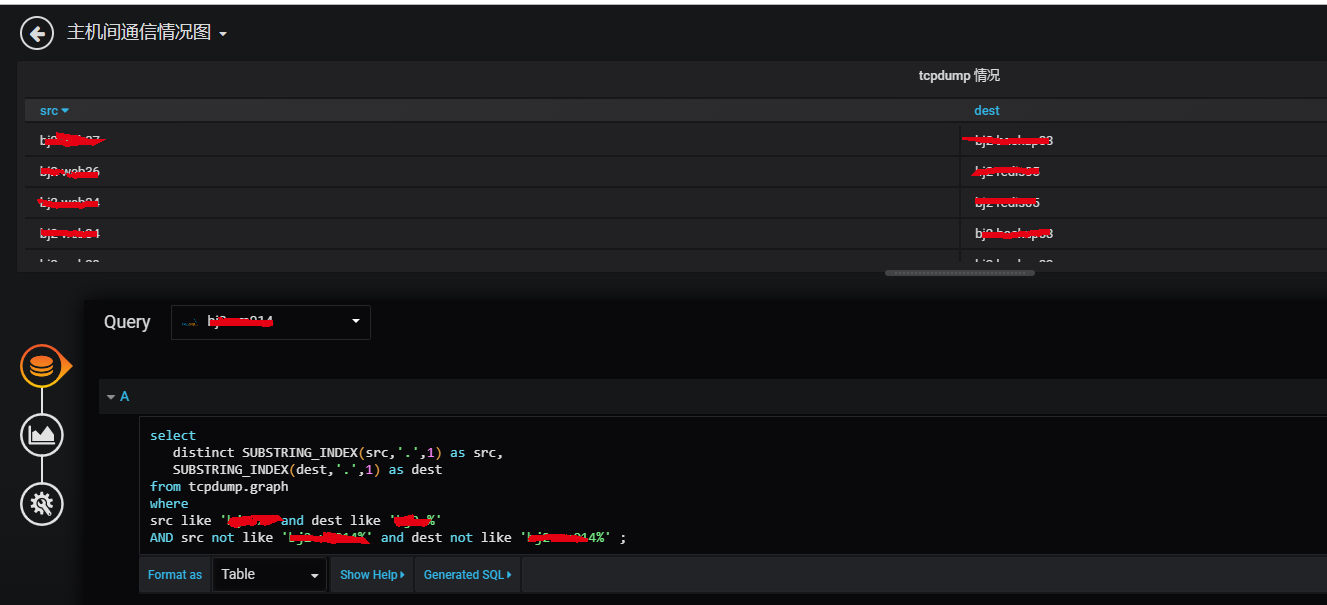
With the data, we can also draw in grafana, roughly as follows:
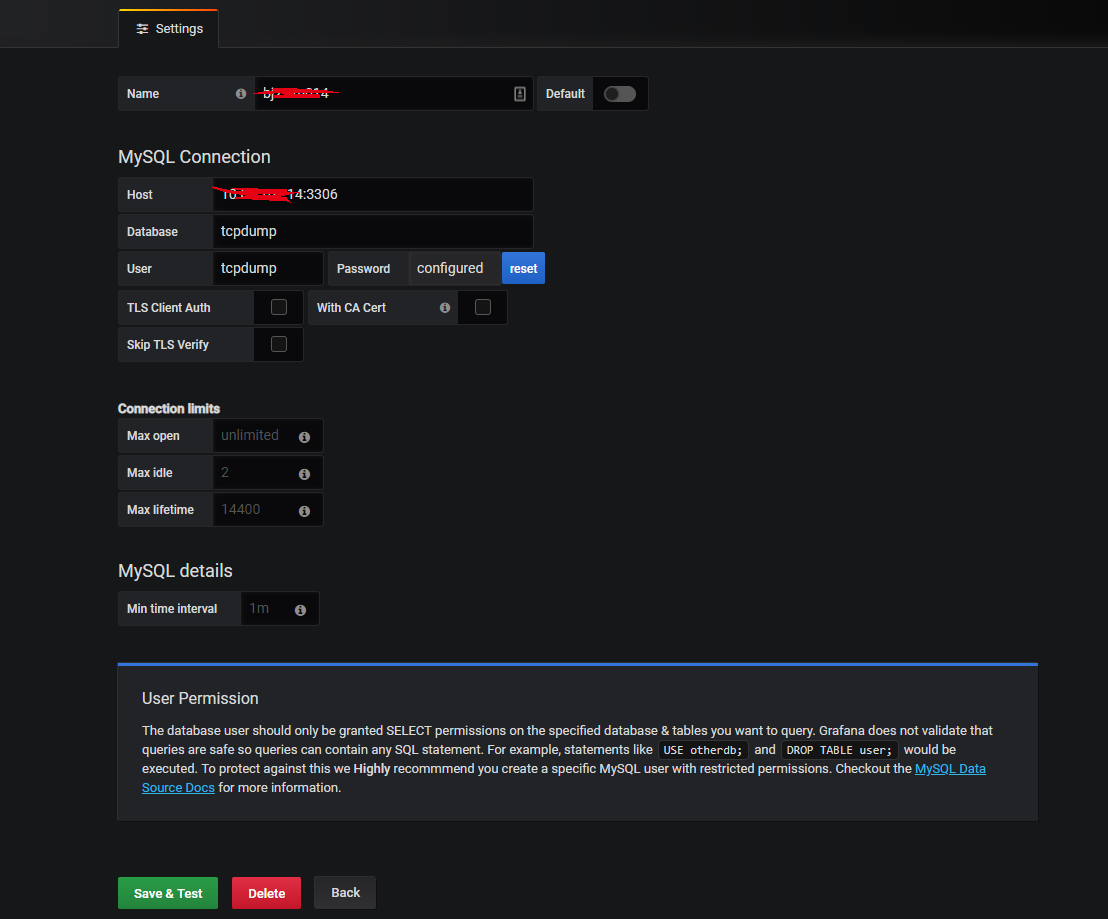
1. Add mysql data source

2. Draw, using a table-type graphical display interface, the end result is similar to the following:

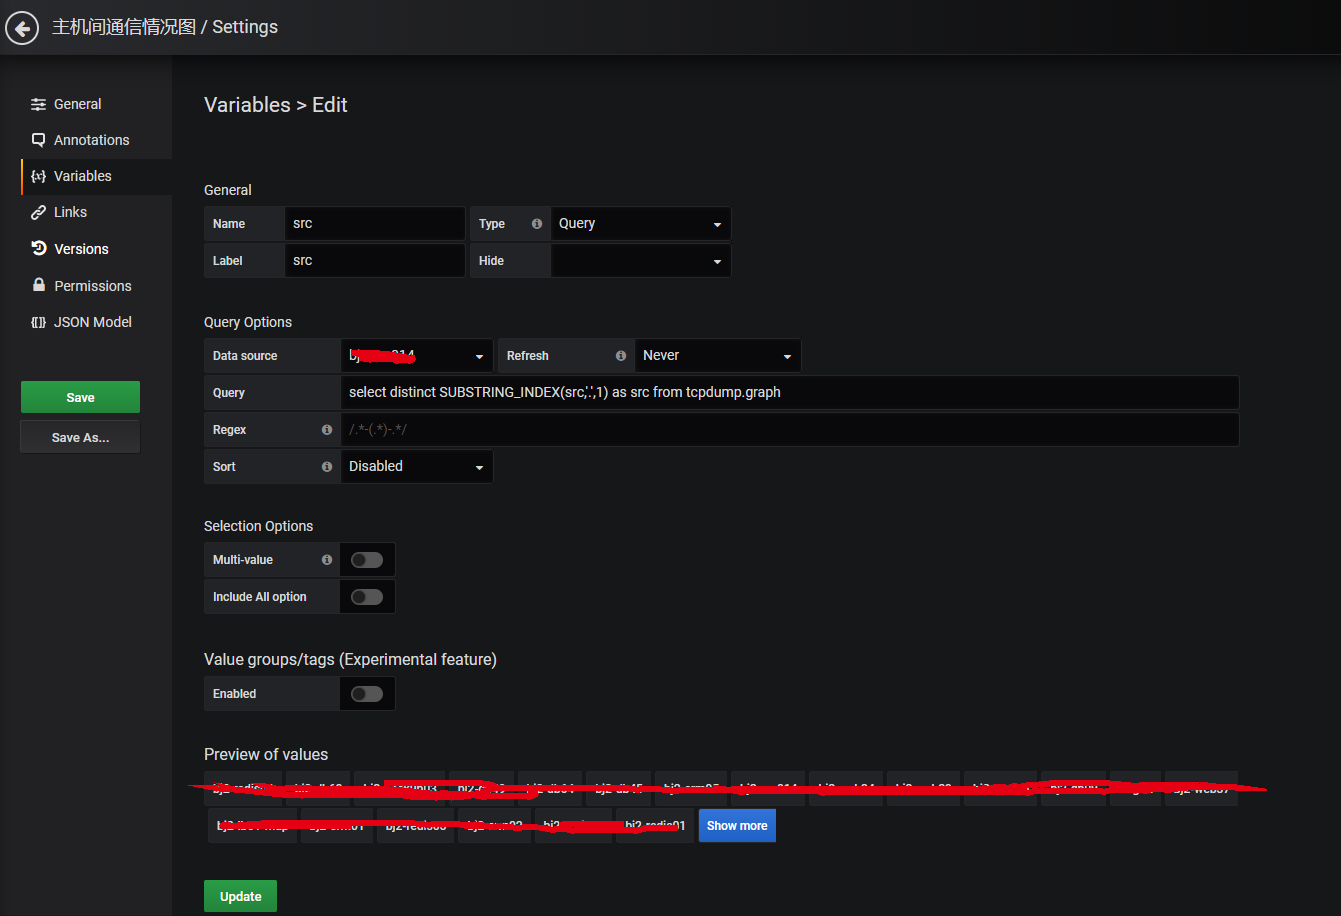
Further, we can also draw dynamic panels.This requires adding a variable as follows:

In this way, we can pull down the menu to find the corresponding host, no need to flip your eyes.
