1, Introduction
Q1: now we have the data of 250000 911 emergency calls from 2015 to 2017. Please count the number of different types of emergencies in these data
analysis:
Method 1:
First view the data information, determine the field of the type, then cut the field and convert it into a list, construct a zero array, assign a value of 1 to the column corresponding to the data type, and finally sum it
# coding = utf-8
import pandas as pd
import numpy as np
from matplotlib import pyplot as plt

df = pd.read_csv("./911.csv")

# print(df.head(1))
#
#
# print(df.info())

# Get classification
temp_list = df["title"].str.split(":").tolist()

cate_list = list(set([i[0] for i in temp_list]))

print(cate_list)

# Construct zero array
zeros_df = pd.DataFrame(np.zeros((df.shape[0], len(cate_list))), columns=cate_list)

# assignment
for cate in cate_list:
    zeros_df[cate][df["title"].str.contains(cate)] = 1

sum_ret = zeros_df.sum(axis=0)
print(sum_ret)
Method 2:
Add a column to the original data, and then group statistics
# coding = utf-8
import pandas as pd
import numpy as np
from matplotlib import pyplot as plt

df = pd.read_csv("./911.csv")

# Get classification
temp_list = df["title"].str.split(":").tolist()

cate_list = [i[0] for i in temp_list]

cate_df = pd.DataFrame(np.array(cate_list).reshape((df.shape[0], 1)), columns=["cate"])

# print(cate_df)
# Add a column
df["cate"] = cate_df
print(df.groupby(by="cate").count()["title"])
Q2: what should we do if we want to count the changes in the number of different types of emergency calls in different months?
Analysis: the above two methods can also solve the problem, but it is cumbersome, and the use of time series is very simple. Let's briefly introduce the time series
2, Time series in pandas
2.1. Generate a time range
date_range(start=None, end=None, periods=None, freq='D')
Parameters: start time, end stop time, number of periods, freq type
freq parameter table:
two point two to_datetime(df["timeStamp"],format = "") [convert string to time series]
Format is generally not specified. When pandas cannot recognize it, you need to manually pass in parameters. For the specific format, refer to python time format.
2.3 pandas resampling (resample method)
Resampling: refers to the process of converting time series from one frequency to another for processing. Converting high-frequency data into low-frequency data is down sampling, and converting low-frequency data into high-frequency data is up sampling
2.4 problem solving
1. Count the changes of the number of calls in different months in the 911 data
import numpy as np
import pandas as pd
from matplotlib import pyplot as plt
import matplotlib

df = pd.read_csv("./911.csv")
df["timeStamp"] = pd.to_datetime(df["timeStamp"])
df.set_index("timeStamp", inplace=True)
# print(df.head(2))
count_by_month = df.resample('M').count()["title"]
# print(count_by_month.head(1))

# Drawing
_x = count_by_month.index
_y = count_by_month.values
# for i in _x:
#     print(dir(i))
#     break
_x = [i.strftime("%Y%m%d") for i in _x]


plt.figure(figsize=(20, 8), dpi=80)

plt.plot(range(len(_x)), _y)
plt.xticks(range(len(_x)), _x, rotation=45)
plt.show()
result

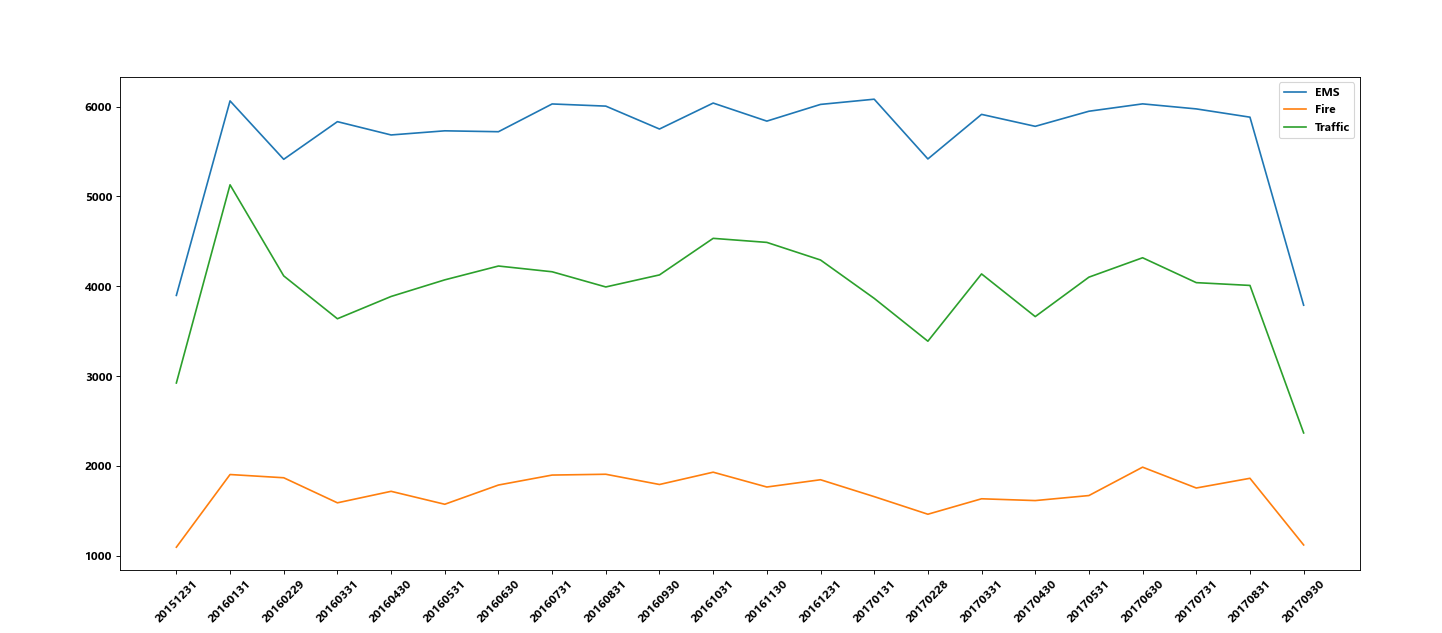
2. Count the changes of the number of different types of calls in different months in the 911 data
Note: the assignment index shall be consistent
import numpy as np
import pandas as pd
from matplotlib import pyplot as plt
import matplotlib

# Set Chinese font
font = {'family': 'MicroSoft YaHei',
        'weight': 'bold'}

matplotlib.rc("font", **font)

# Convert the time string to practice type and set it as index
df = pd.read_csv("./911.csv")
df["timeStamp"] = pd.to_datetime(df["timeStamp"])
plt.figure(figsize=(20, 8), dpi=80)

# Add a column to represent the classification
temp_list = df["title"].str.split(":").tolist()
cate_list = [i[0] for i in temp_list]
cate_df = pd.DataFrame(np.array(cate_list).reshape((df.shape[0], 1)))
df["cate"] = cate_df
df.set_index("timeStamp", inplace=True)
# grouping
for group_name, group_data in df.groupby(by="cate"):
    count_by_month = group_data.resample('M').count()["title"]
    # Drawing
    _x = count_by_month.index
    _y = count_by_month.values
    _x = [i.strftime("%Y%m%d") for i in _x]
    plt.plot(range(len(_x)), _y,label= group_name)


plt.xticks(range(len(_x)), _x, rotation=45)

plt.legend(loc="best")
plt.show()
result
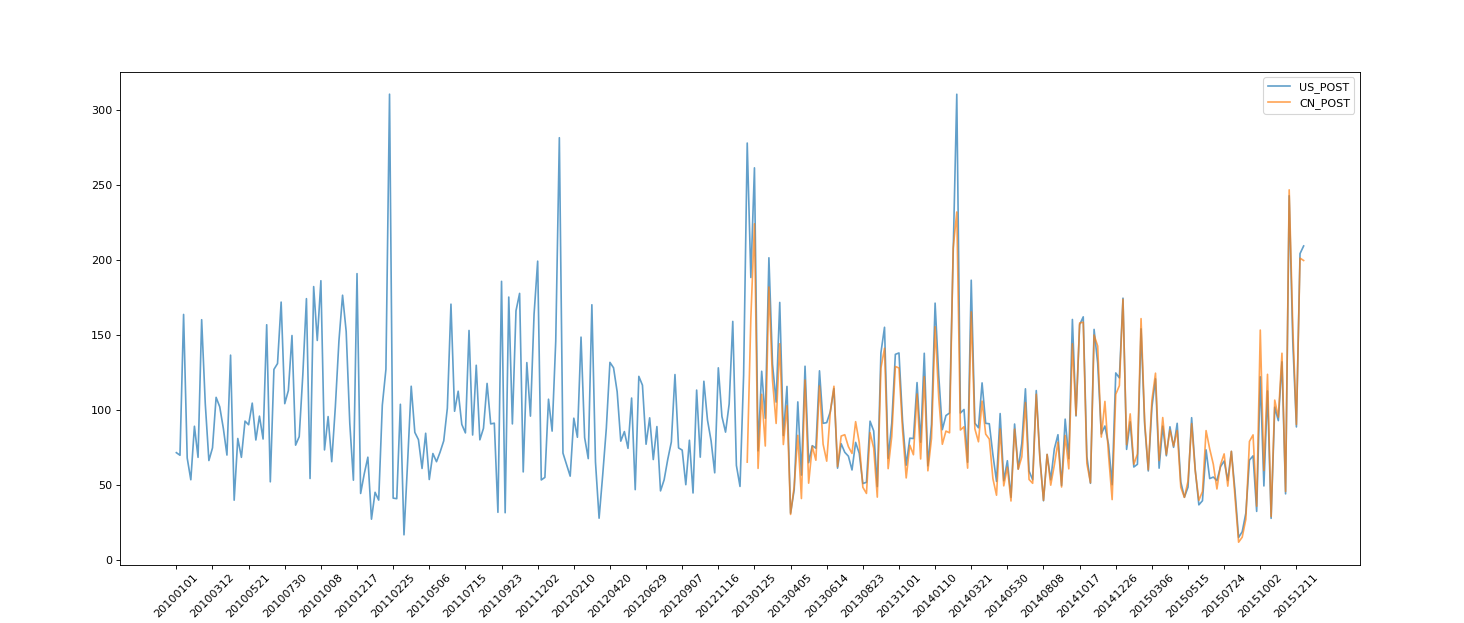
two point five PeriodIndex (generation time period)
# coding=utf-8
import pandas as pd
from matplotlib import pyplot as plt

file_path = "./PM2.5/BeijingPM20100101_20151231.csv"

df = pd.read_csv(file_path)

# Convert the separated time string to the time type of pandas through the periodIndex method
period = pd.PeriodIndex(year=df["year"], month=df["month"], day=df["day"], hour=df["hour"], freq="H")
df["datetime"] = period
# print(df.head(10))

# Set datetime as index
df.set_index("datetime", inplace=True)

# Downsampling
df = df.resample("7D").mean()
print(df.head())
# Process missing data and delete missing data
# print(df["PM_US Post"])

data = df["PM_US Post"]
data_china = df["PM_Nongzhanguan"]

print(data_china.head(100))
# Drawing
_x = data.index
_x = [i.strftime("%Y%m%d") for i in _x]
_x_china = [i.strftime("%Y%m%d") for i in data_china.index]
print(len(_x_china), len(_x_china))
_y = data.values
_y_china = data_china.values

plt.figure(figsize=(20, 8), dpi=80)

plt.plot(range(len(_x)), _y, label="US_POST", alpha=0.7)
plt.plot(range(len(_x_china)), _y_china, label="CN_POST", alpha=0.7)

plt.xticks(range(0, len(_x_china), 10), list(_x_china)[::10], rotation=45)

plt.legend(loc="best")

plt.show()
result