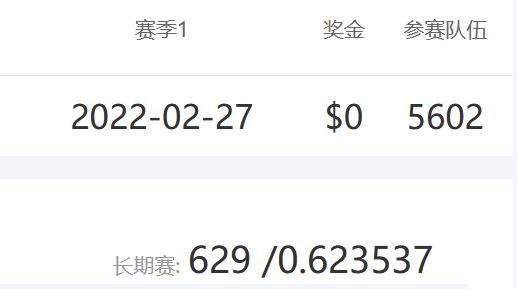
Learn big data analysis and machine learning from 0, and simply write down the competition experience. The score is 0.623537, ranking 629 / 5602
1, Competition background
Merchants sometimes carry out large-scale promotional activities (such as discounts or cash coupons) on specific dates (such as boxing day sales, "Black Friday" or "double 11 (November 11)") to attract a large number of new buyers. However, many attracted buyers are one-time. They never buy again after this consumption. The promotion activities for these users have not brought future sales increase to the store. To alleviate this problem, businesses must determine who can be converted into repeat buyers. Through the fine marketing of these potential loyal customers, businesses can greatly reduce the promotion cost and improve the return on investment (ROI). As we all know, in the field of online advertising, accurate positioning of users is a great challenge, especially for new buyers. However, with the help of user behavior logs accumulated by tmall for a long time, we may be able to solve this problem. In this challenge, we provided a group of merchants and their new buyers in the "double 11" promotion. Your task is to predict which new buyers in a given business will become loyal customers in the future. In other words, you need to predict the probability that these new buyers will buy goods at the same merchant again in the next six months. We give a data set containing about 200000 users for training and another data set with similar scale for testing. Like other games, you can extract any feature and then train with other tools. You only need to submit the forecast results for evaluation.
Link: Challenge of tmall repurchase forecast Baseline Tianchi competition Alibaba cloud Tianchi
2, Data exploration
Import related packages first:
import numpy as np
import pandas as pd
import matplotlib.pyplot as plt
import seaborn as sns
from scipy import stats

import warnings
warnings.filterwarnings("ignore")

%matplotlib inline
Read data:
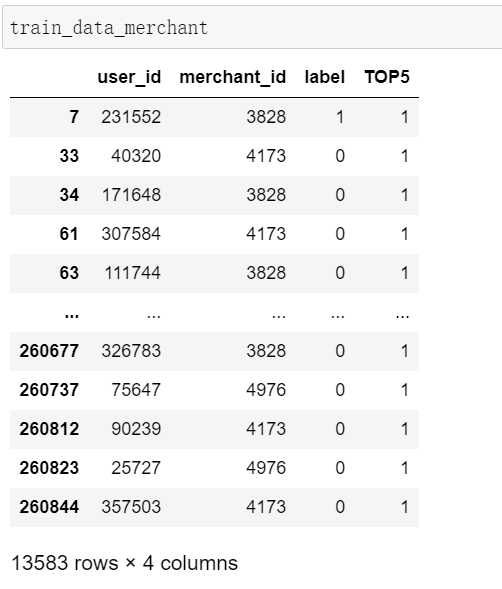
train_data = pd.read_csv("data_format1/train_format1.csv")
test_data = pd.read_csv("data_format1/test_format1.csv")
user_info = pd.read_csv("data_format1/user_info_format1.csv")
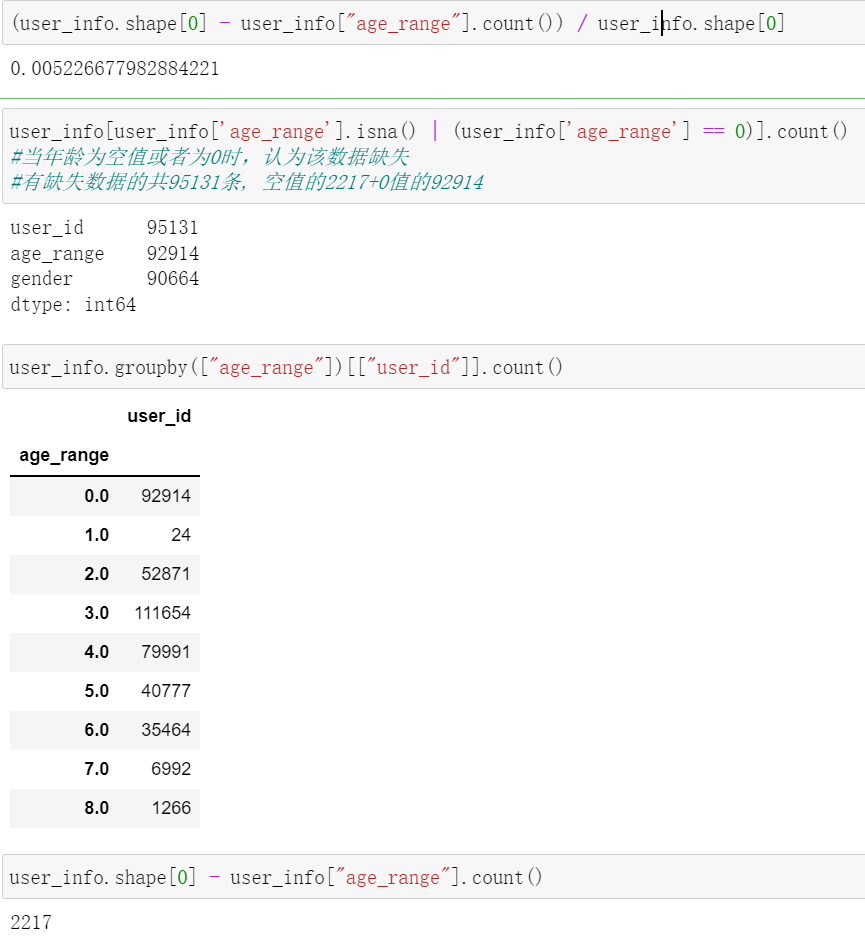
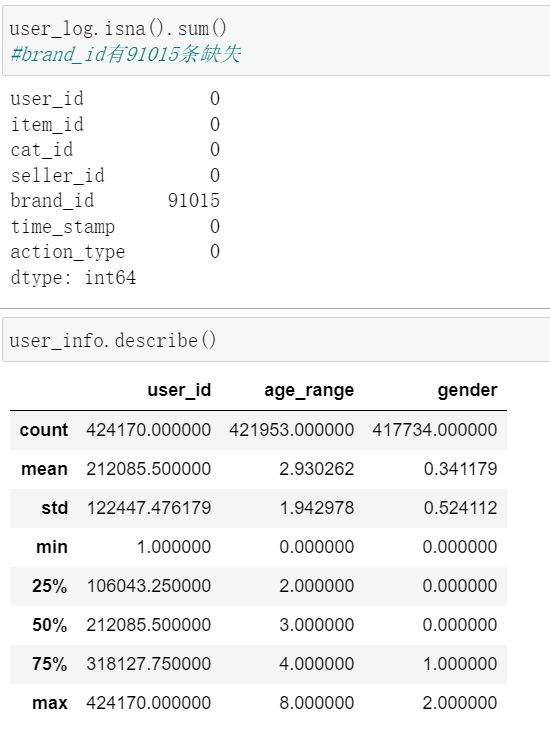
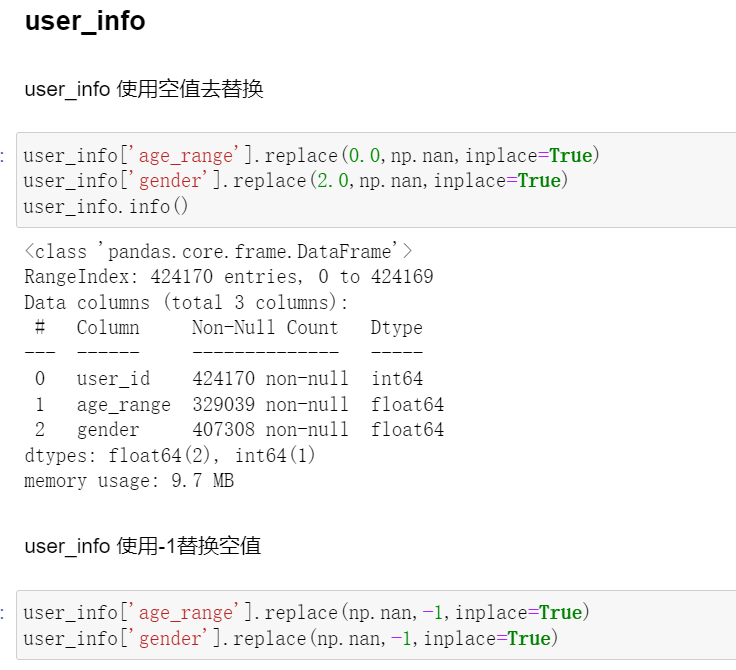
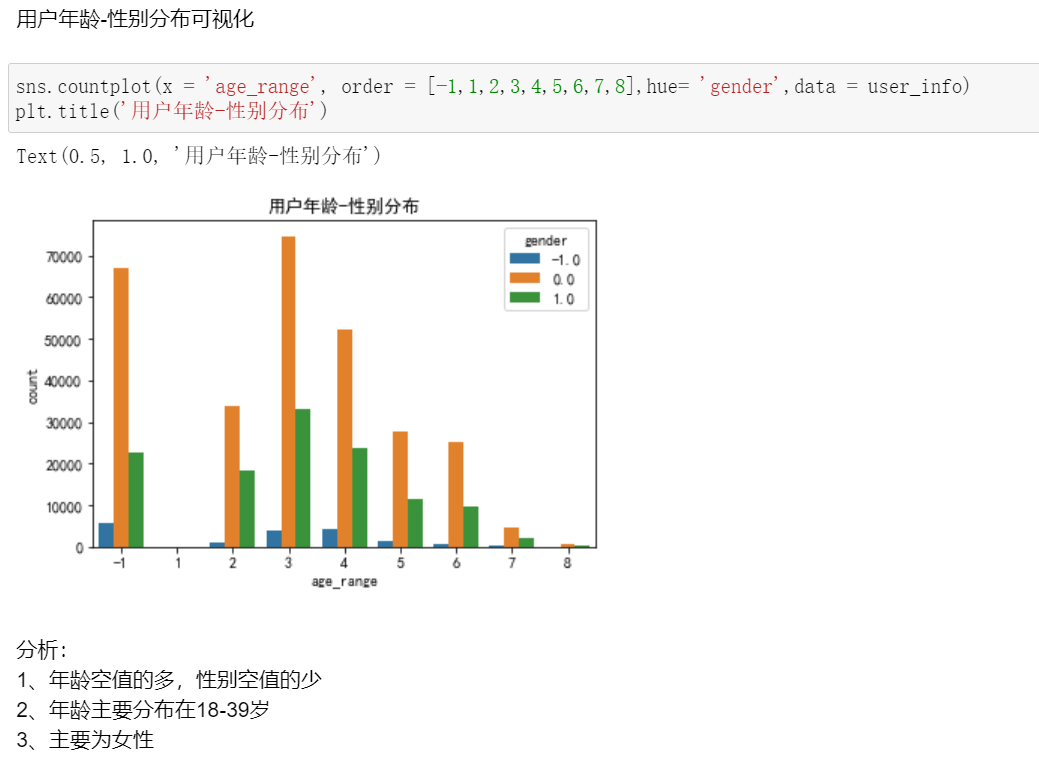
user_log = pd.read_csv("data_format1/user_log_format1.csv")View the missing user information data - age value
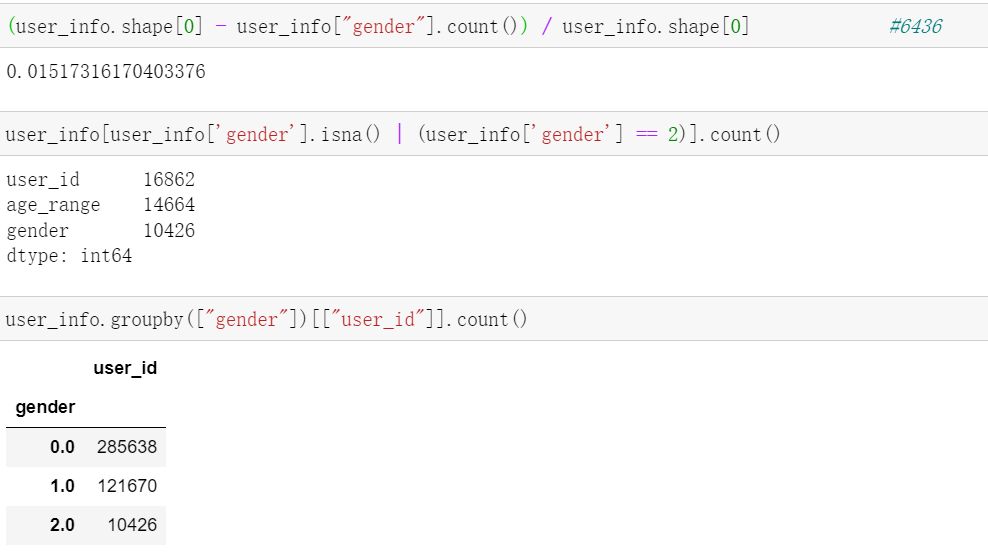
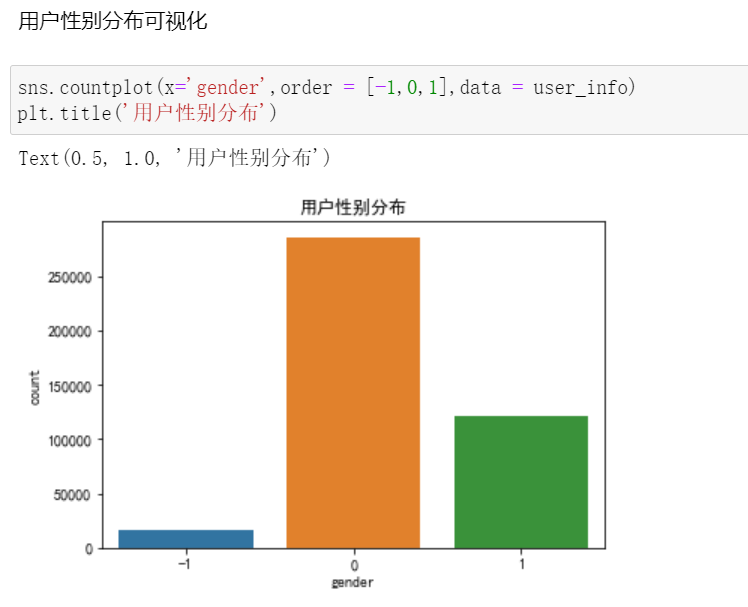
View the lack of user information data - gender value
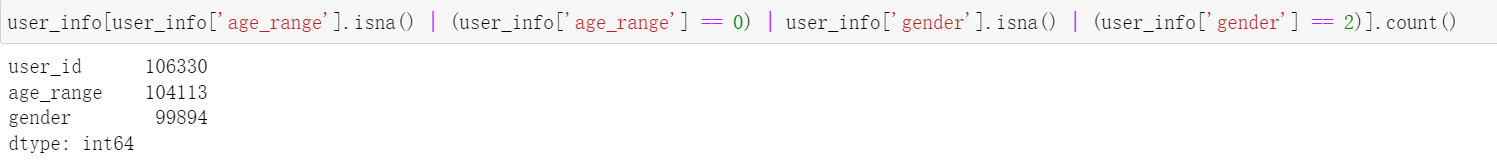
View missing user information data - age or gender
View the lack of user information data - the user behavior log data is missing
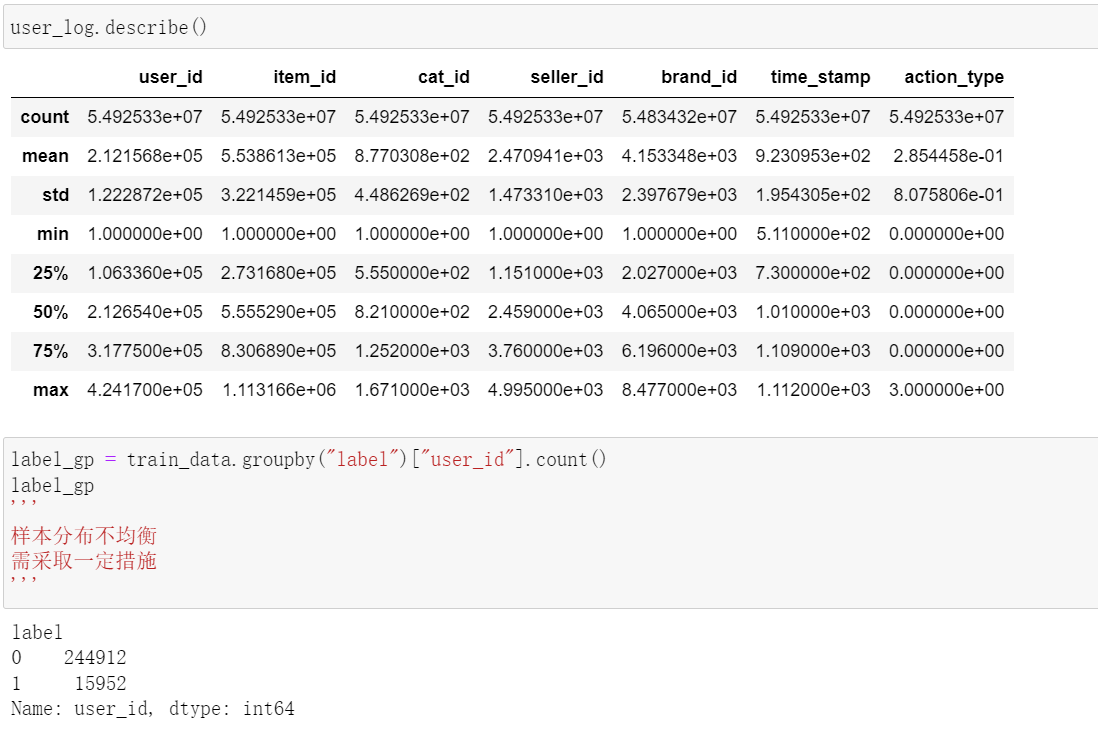
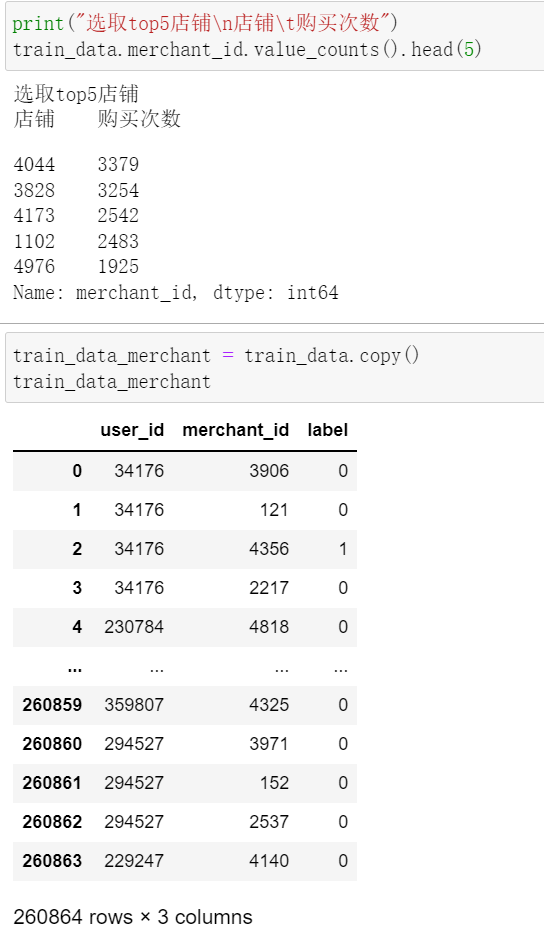
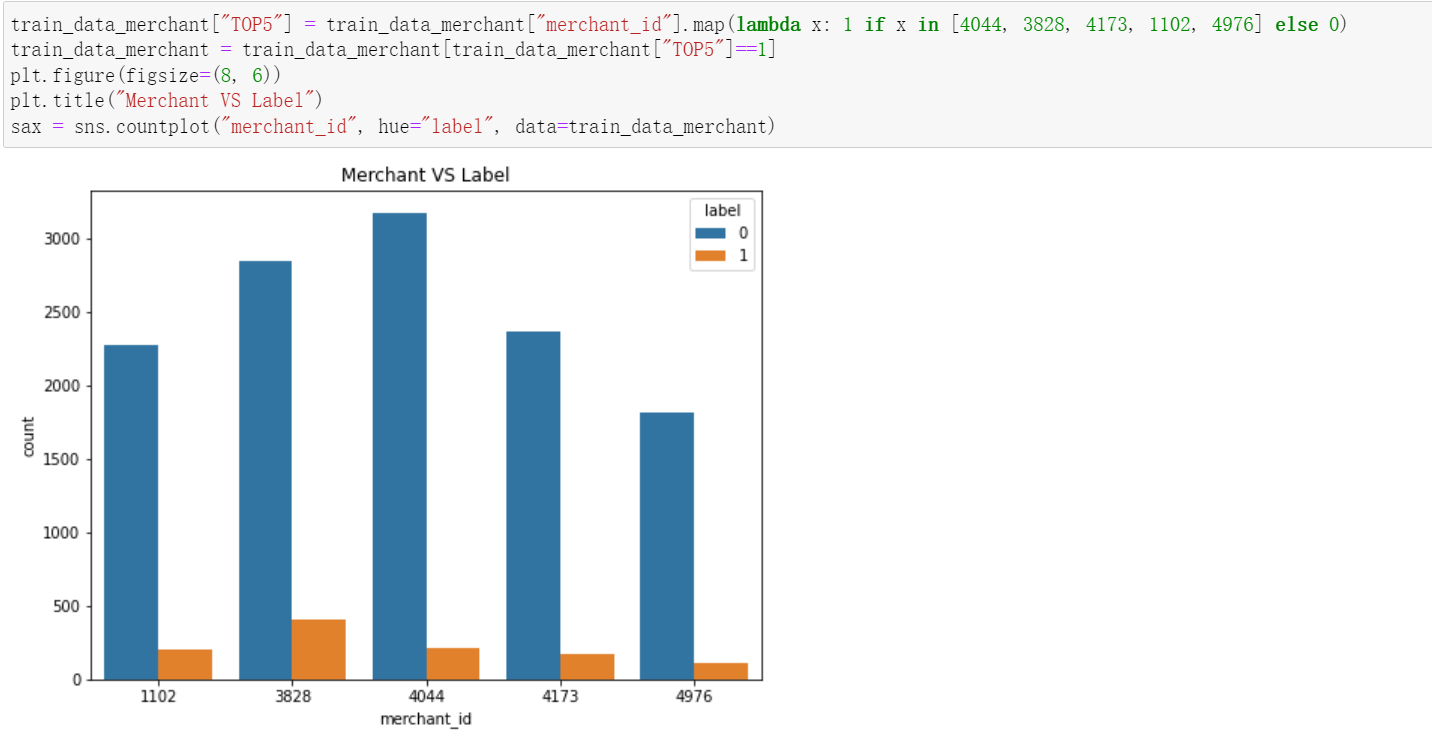
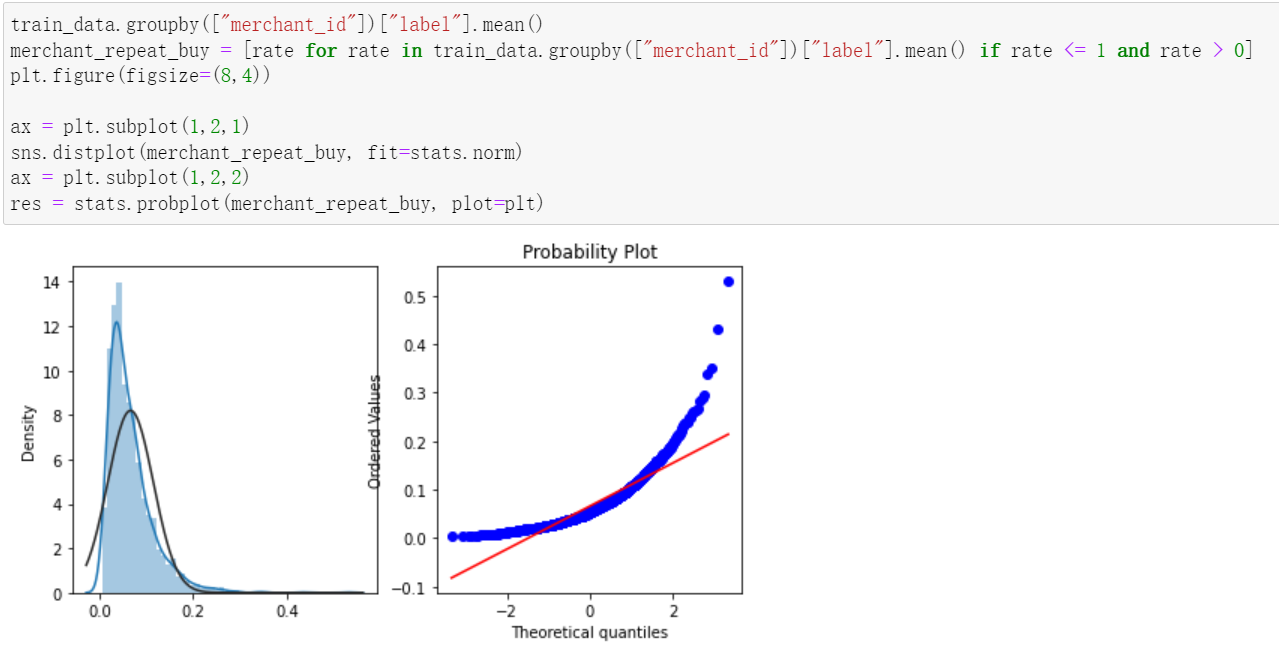
Analyze the store
2, Characteristic Engineering
Import related packages:
import numpy as np
import pandas as pd
import matplotlib.pyplot as plt
plt.rcParams["font.sans-serif"] = "SimHei" #Solve the problem of Chinese garbled code
import seaborn as sns
import random
from sklearn.model_selection import train_test_split
from sklearn.linear_model import LogisticRegression
from sklearn.preprocessing import LabelEncoder
from sklearn.metrics import accuracy_score
from sklearn import model_selection
from sklearn.neighbors import KNeighborsRegressor
Read data:
df_train = pd.read_csv(r'data_format1\train_format1.csv')
df_test = pd.read_csv(r'data_format1\test_format1.csv')
user_info = pd.read_csv(r'data_format1\user_info_format1.csv')
user_log = pd.read_csv(r'data_format1\user_log_format1.csv')

print(df_test.shape,df_train.shape)
print(user_info.shape,user_log.shape)
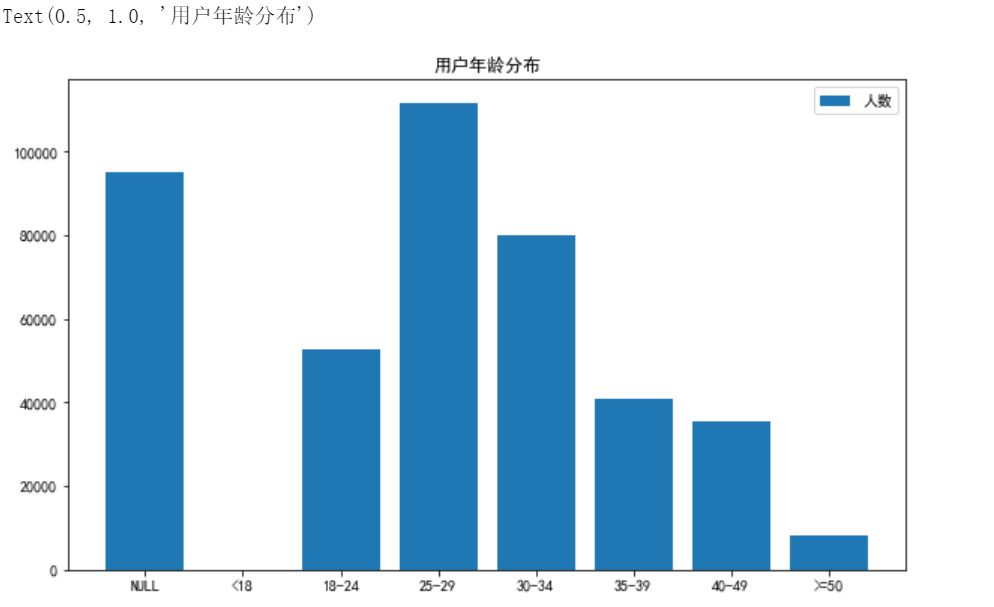
Visualization of age distribution:
fig = plt.figure(figsize = (10, 6))
x = np.array(["NULL","<18","18-24","25-29","30-34","35-39","40-49",">=50"])
#< 18 years old is 1; [18,24] is 2; [25,29] is 3; [30,34] is 4; [35,39] is 5; [40,49] is 6; >= 7 and 8 at 50
y = np.array([user_info[user_info['age_range'] == -1]['age_range'].count(),
             user_info[user_info['age_range'] == 1]['age_range'].count(),
             user_info[user_info['age_range'] == 2]['age_range'].count(),
             user_info[user_info['age_range'] == 3]['age_range'].count(),
             user_info[user_info['age_range'] == 4]['age_range'].count(),
             user_info[user_info['age_range'] == 5]['age_range'].count(),
             user_info[user_info['age_range'] == 6]['age_range'].count(),
             user_info[user_info['age_range'] == 7]['age_range'].count() +
              user_info[user_info['age_range'] == 8]['age_range'].count()])
plt.bar(x,y,label='Number of people')
plt.legend()
plt.title('User age distribution')
The effect is shown in the figure:
Start feature value merging:
df_train = pd.merge(df_train,user_info,on="user_id",how="left")

total_logs_temp = user_log.groupby([user_log["user_id"],user_log["seller_id"]])["item_id"].count().reset_index()

total_logs_temp.rename(columns={"seller_id":"merchant_id","item_id":"total_item_id"},inplace=True)

df_train = pd.merge(df_train,total_logs_temp,on=["user_id","merchant_id"],how="left")

unique_item_id = user_log.groupby(["user_id","seller_id","item_id"]).count().reset_index()[["user_id","seller_id","item_id"]]

unique_item_id_cnt = unique_item_id.groupby(["user_id","seller_id"]).count().reset_index()

unique_item_id_cnt.rename(columns={"seller_id":"merchant_id","item_id":"unique_item_id"},inplace=True)

df_train = pd.merge(df_train, unique_item_id_cnt, on=["user_id", "merchant_id"], how="left")

cat_id_temp = user_log.groupby(["user_id", "seller_id", "cat_id"]).count().reset_index()[["user_id", "seller_id", "cat_id"]]

cat_id_temp_cnt = cat_id_temp.groupby(["user_id", "seller_id"]).count().reset_index()

cat_id_temp_cnt.rename(columns={"seller_id":"merchant_id","cat_id":"total_cat_id"},inplace=True)

df_train = pd.merge(df_train, cat_id_temp_cnt, on=["user_id", "merchant_id"], how="left")

time_temp = user_log.groupby(["user_id", "seller_id", "time_stamp"]).count().reset_index()[["user_id", "seller_id", "time_stamp"]]

time_temp_cnt = time_temp.groupby(["user_id", "seller_id"]).count().reset_index()

time_temp_cnt.rename(columns={"seller_id":"merchant_id","time_stamp":"total_time_temp"},inplace=True)

df_train = pd.merge(df_train, time_temp_cnt, on=["user_id", "merchant_id"], how="left")

click_temp = user_log.groupby(["user_id", "seller_id", "action_type"])["item_id"].count().reset_index()

click_temp.rename(columns={"seller_id":"merchant_id","item_id":"times"},inplace=True)

click_temp["clicks"] = click_temp["action_type"] == 0

click_temp["clicks"] = click_temp["clicks"] * click_temp["times"]

click_temp["shopping_cart"] = click_temp["action_type"] == 1
click_temp["shopping_cart"] = click_temp["shopping_cart"] * click_temp["times"]

click_temp["purchases"] = click_temp["action_type"] == 2
click_temp["purchases"] = click_temp["purchases"] * click_temp["times"]

click_temp["favourites"] = click_temp["action_type"] == 3
click_temp["favourites"] = click_temp["favourites"] * click_temp["times"]

four_features = click_temp.groupby(["user_id", "merchant_id"]).sum().reset_index()

#Delete related columns
four_features = four_features.drop(["action_type", "times"], axis=1)

#merge
df_train = pd.merge(df_train, four_features, on=["user_id", "merchant_id"], how="left")

#Missing values are filled forward
df_train = df_train.fillna(method="ffill")
Save the established feature project as a separate file:
#Save the constructed features
df_train.to_csv("df_train.csv",index=None)
Three, model building
y = df_train["label"]
X = df_train.drop(["user_id", "merchant_id", "label"], axis=1)
X.head(10)
Split data:
#Split data
X_train, X_test, y_train, y_test = train_test_split(X, y, test_size=0.2, random_state=10)
logistic regression:
#logistic regression
Logit = LogisticRegression(solver='liblinear')
Logit.fit(X_train, y_train)
Predict = Logit.predict(X_test)
Predict_proba = Logit.predict_proba(X_test)
print(Predict[0:20])
print(Predict_proba[:])
Score = accuracy_score(y_test, Predict)
Score
Decision tree:
#Decision tree
from sklearn.tree import DecisionTreeClassifier
tree = DecisionTreeClassifier(max_depth=4,random_state=0)
tree.fit(X_train, y_train)
Predict_proba = tree.predict_proba(X_test)
print(Predict_proba[:])
print("Accuracy on training set: {:.3f}".format(tree.score(X_train, y_train)))
print("Accuracy on test set: {:.3f}".format(tree.score(X_test, y_test)))