
preface:
I shared an article before Linux development coredump file analysis and actual combat sharing Today, let's share a practical article.
In our embedded linux development process, we often use multi process and multi thread development. In the process of multithreading, we may encounter that a thread occupies cpu for a long time, resulting in abnormal execution of the device.
There are usually only four or five threads. We can catch abnormal threads through thread debugging. If there are about thirty or forty threads running on the device you develop, we can't see which thread has a problem at once, nor can we use the enumeration method to search, At this time, we need to cooperate with some tools to monitor and check the threads under the process we execute. Now I will introduce to you some examples that I have actually encountered in my work.
Author: conscience still exists
REAUTHORIZING authorization and onlookers: welcome to WeChat official account: Yu Linjun
Or add the author's personal wechat: become_me
Plot introduction:
In my work, I encountered such a problem. When my device was running, I found that the machine was running in some strange States, and the processing response to some mechanisms was not timely. Finally, the top check found that some threads in a process I was running had a high cpu share, resulting in that some other threads could not run in time.
After finding the problem, we will start to find the corresponding thread and modify it. As mentioned earlier, there are one or two threads in the process. Fortunately, we can use some basic methods to output log or other information by threads. However, if there are many threads in a single process, how can we check it?
Outline a tool to be used: ps combined command, top combined command, pstack, strace, ltrace, GDB attach < PID > real-time debugging, kill < sig > < PID >, coredump file to view thread stack
The above are some commands and operations I have used. Next, I will analyze and introduce them one by one:
First introduce each tool and command in detail, and then use a small example to illustrate the combination of these tools.
Detailed description of tools and combination commands
First of all, let me give you a detailed introduction to these tool manuals:
Description of ps options and parameters:
The ps command should be familiar to everyone in linux. ps is the abbreviation of Process Status, which is used to list the currently running processes in the system. Use this command to determine which processes are running and running status, whether the process ends, whether the process is dead, which processes occupy too many resources, and so on. The progress listed in the ps command is a snapshot of the current process, that is, it is not dynamic, but the state at the moment when the command is executed.
ps There are many parameters, Here, only a few common parameters are listed and their meanings are briefly introduced
-A List all processes
-w Display widening can display more information
-au Show more detailed information
-aux Displays all trips that include other users
I usually use ps -aux to view the process pid running in the background
The following is a supplement to the ps combination command to be used today
View the threads corresponding to the process
ps -T -p 472 (472 Here is the of the real process pid (replace by yourself)
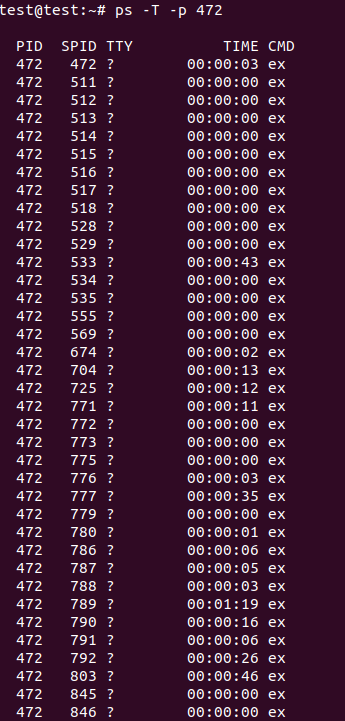
The first line is the corresponding process ID, and the second line is the corresponding thread ID
View the execution time of the corresponding thread of the process
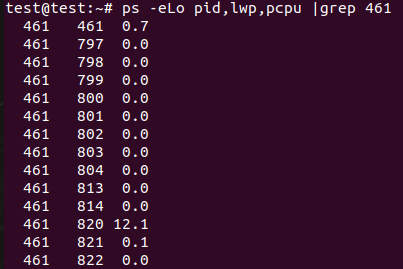
ps -eLo pid,lwp,pcpu |grep 1780(1780 Here is the of the real process pid (replace by yourself)
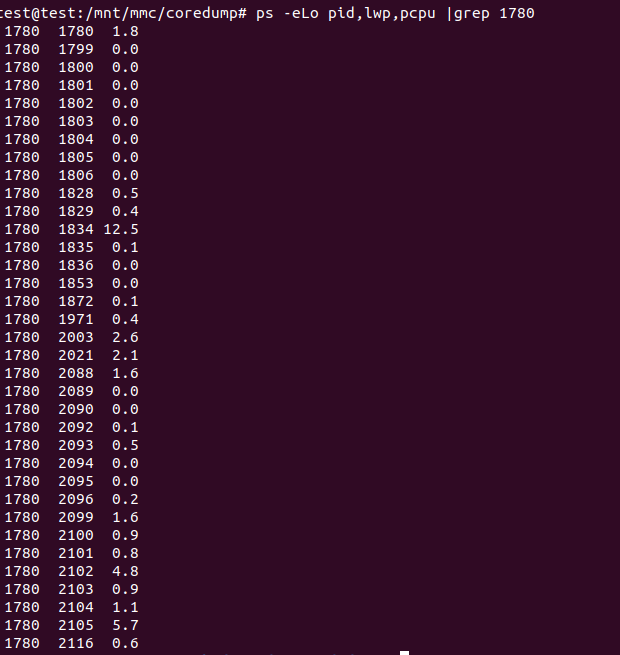
The first line is the process pid, the second line is the pid corresponding to the thread in the process, and the third line is the execution ms time of the thread. Through the execution time length of the thread, we cooperate with the stack information of the thread, the thread frequently performs IO operations or the library functions frequently executed by the thread to judge whether the thread occupies cpu resources incorrectly.
Introduction to top combination command:
The top command is also a familiar command. It can display the relevant information of the process being executed by the current system, including process ID, memory utilization, CPU utilization, etc. You can also send a signal to the specified process.
-b Batch processing
-c Display complete information
-I Ignore failure process
-s Confidentiality mode
-S Cumulative mode
-i<time> Set interval
-u<user name> Specify user name
-p<Process number> Specify process
-n<frequency> Number of cycles displayed
First, we usually use the top command directly to view the process information, which will be described here, because the subsequent use of strace tool or ltrace tool is determined from the cpu information area of the top command.
test@test:~# top

top - 02:32:07 up 17 min,  2 users,  load average: 3.17, 3.26, 2.17
Tasks: 165 total,   3 running, 162 sleeping,   0 stopped,   0 zombie
%Cpu(s): 31.3 us,  7.0 sy,  0.0 ni, 60.9 id,  0.0 wa,  0.0 hi,  0.9 si,  0.0 st
MiB Mem :   3845.3 total,   3424.3 free,    240.9 used,    180.1 buff/cache
MiB Swap:      0.0 total,      0.0 free,      0.0 used.   3566.7 avail Mem

  PID USER      PR  NI    VIRT    RES    SHR S  %CPU  %MEM     TIME+ COMMAND
  461 root     -96 -20 2432536  58472  18888 S 176.5   1.5  18:15.07 ex
  375 root      -2   0       0      0      0 S   5.9   0.0   0:04.23 RTW_RECV_THREAD
  430 root      20   0  682204  22536   6880 S   5.9   0.6   0:55.69 python
16913 root      20   0       0      0      0 S   5.9   0.0   0:02.46 kworker/u12:0
22219 root      20   0    3300   2100   1628 R   5.9   0.1   0:00.02 top
    1 root      20   0    1892    620    556 S   0.0   0.0   0:00.41 init
    2 root      20   0       0      0      0 S   0.0   0.0   0:00.01 kthreadd
    3 root      20   0       0      0      0 S   0.0   0.0   0:00.14 ksoftirqd/0
    5 root       0 -20       0      0      0 S   0.0   0.0   0:00.00 kworker/0:0H
    7 root      20   0       0      0      0 R   0.0   0.0   0:02.24 rcu_sched
    8 root      20   0       0      0      0 S   0.0   0.0   0:00.00 rcu_bh
    9 root      rt   0       0      0      0 S   0.0   0.0   0:00.16 migration/0
   10 root      rt   0       0      0      0 S   0.0   0.0   0:00.00 watchdog/0
Statistics displayed by top:
The first five lines of top display information are the overall statistical information area of the current system. Refer to the article for the explanation of this part of statistical information< top command>:
The first line, the task queue information, is the same as the execution result of the uptime command
test@test:~# uptime
 13:46:08 up  1:04,  1 user,  load average: 0.00, 0.00, 0.00
The specific parameters are described as follows:
02:32:07 — Current system time
up 17 min,  — The system has been running for 17 minutes
2 users — Currently, two user terminals are logged into the system
load average: 3.17, 3.26, 2.17— load average The last three numbers are the load conditions of 1 minute, 5 minutes and 15 minutes respectively.
load average data is the number of active processes checked every 5 seconds, and then calculated according to a specific algorithm. If this number is divided by the number of logical CPU s, when the result is higher than 5, it indicates that the system is overloaded.
In the second line, Tasks - Tasks (processes). The specific information is as follows:
The system now has 165 processes, of which 3 are running and 162 are dormant( sleep),stoped 0 in status, zombie There are 0 states (zombies).
The third line is cpu status information. The specific attributes are described as follows:
31.3 us — User space occupation CPU Percentage of.
7.0  sy — Kernel space occupation CPU Percentage of.
0.0  ni — Occupied by processes with changed priority CPU Percentage of
60.9  id — free CPU percentage
0.0 wa — IO Waiting for occupation CPU Percentage of
0.0 hi — Hard interrupt( Hardware IRQ)occupy CPU Percentage of
0.9 si — Soft interrupt( Software Interrupts)occupy CPU Percentage of
0.0 st When the hypervisor serves another processor (stealing from the virtual machine), the virtual machine cpu Time spent on involuntary waiting
The fourth line, memory status, details are as follows:
3845.3 total — Total physical memory (3).8GB)
3424.3 free — Total free memory (3).2GB)
240.9 used — Total memory in use (240).9MB)
180.1 buff/cache — Amount of memory cached (180) M)
In the fifth line, swap exchanges partition information. The specific information is as follows:
0.0 total — Total exchange area (0).0 GB)
0.0 free — Total free swap area (0) MB)
0.0 used — Total swap area used (0) MB)
3566.7 avail Mem — Total number of swap buffers available (3).5GB)
Sixth line, blank line.
The seventh line is as follows: the status monitoring of each process (task), and the item column information is described as follows:
PID — process id
USER — Process owner
PR — Process priority
NI — nice Value. Negative values indicate high priority and positive values indicate low priority
VIRT — The total amount of virtual memory used by the process, in kb. VIRT=SWAP+RES
RES — The size of physical memory used by the process and not swapped out, unit kb. RES=CODE+DATA
SHR — Shared memory size in kb
S — Process status. D=Non interruptible sleep state R=function S=sleep T=track/stop it Z=Zombie process
%CPU — Last updated to now CPU Time occupancy percentage
%MEM — Percentage of physical memory used by the process
TIME+ — Used by the process CPU Total time in 1/100 second
COMMAND — Process name (command name)/(command line)
This is the information obtained from the regular use of top. We usually use the combined command. I usually use it,
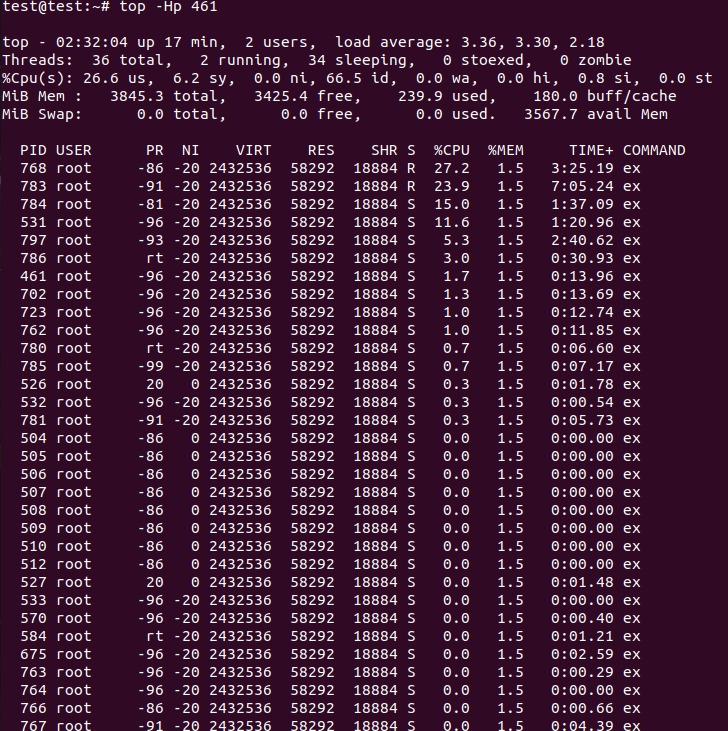
top -Hp 461(461 Here is the of the real process pid (replace by yourself)
Through the - Hp command, I can view the threads of the specified process
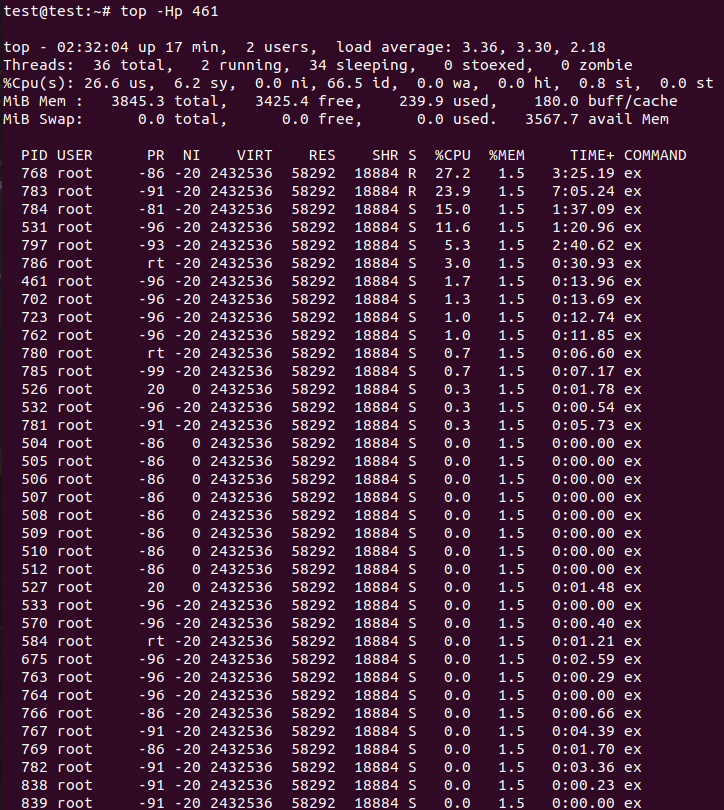
In the third line of the statistics, you can see that the cpu usage is mainly in user mode.
Then we should better use ltrace to call and query user state library functions. Of course, strace can also be used, but because the cpu utilization occupied by the kernel is not high, the IO operations you track should be far less than the user state library function calls.
Introduction to pstack options and parameters:
pstack is a command-line tool under Linux system. This command can display the stack snapshot of each thread of the specified process to facilitate troubleshooting program exceptions and performance evaluation. The only option allowed by this command is the PID of the process to be checked. If you want to use this package, you need to add this tool to the linux lib and bin directories you use.
Example
sudo pstack 16634(Should pid Test the corresponding process of the computer for myself. When you use it, you can replace it with your own pid)
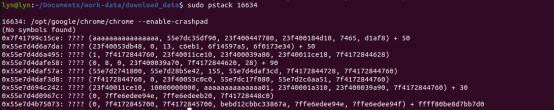
You can execute pstack several times over a period of time. If you find that the code stack always stops at the same position,
That position needs to be focused, which is likely to be the problem;
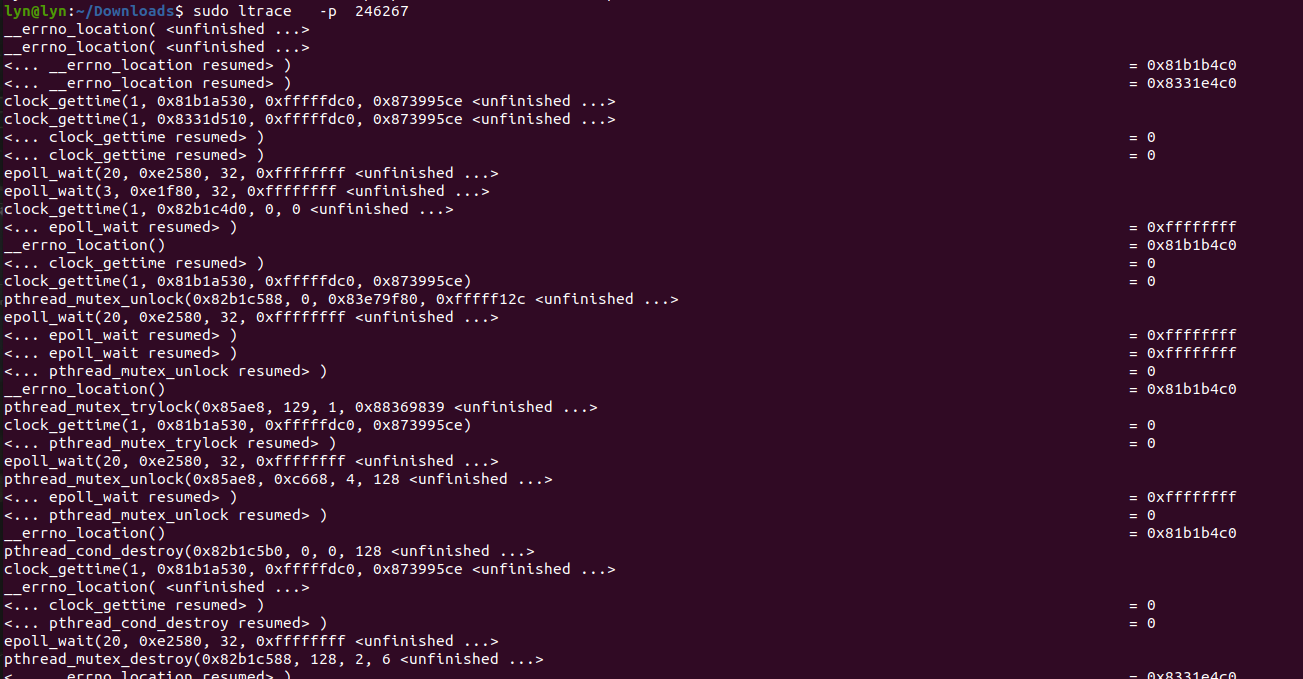
Introduction to the options and parameters of ltrace:
Ltrace can track the library function calls of the process, which will show which library function was called, while strace tracks each system call of the process. What are the options for ltrace trace process call library function parameters?
Introduction to the options and parameters of ltrace:
-c Count the time of each call of the library function, and print the summary when the program exits.
-C Decode low level names(Kernel level)Is the user level name.
-d Print debugging information.
-e expr Output filter, through the expression, you can filter out the output you don't want.
-e printf Indicates view only printf Function tone.
-e!printf Indicates to view the division printf All function calls except function.
-f Track child processes.
-o flename take ltrace Write output to file filename.
-p pid Specify the processes to track pid.
-r Output the relative time of each call.
-S Displays system calls.
-t Add time information before each line in the output.
-tt Add time information before each line in the output, accurate to microseconds.
-ttt Time information is added before each line in the output, accurate to microseconds, and the time is expressed as UNIX Timestamp.
-T Displays the time spent on each call.
Description of strace options and parameters:
strace is often used to track system calls and signals received when a process executes. In the Linux world, processes cannot directly access hardware devices. When processes need to access hardware devices (such as reading disk files, receiving network data, etc.), they must switch from user mode to kernel mode and access hardware devices through system calls. strace can track the system call generated by a process, including parameters, return value and execution time.
-f Track the target process and all child processes created by the target process
-t Add time information before each line in the output(-tt Indicates microsecond level)
-T Displays the time spent on each system call
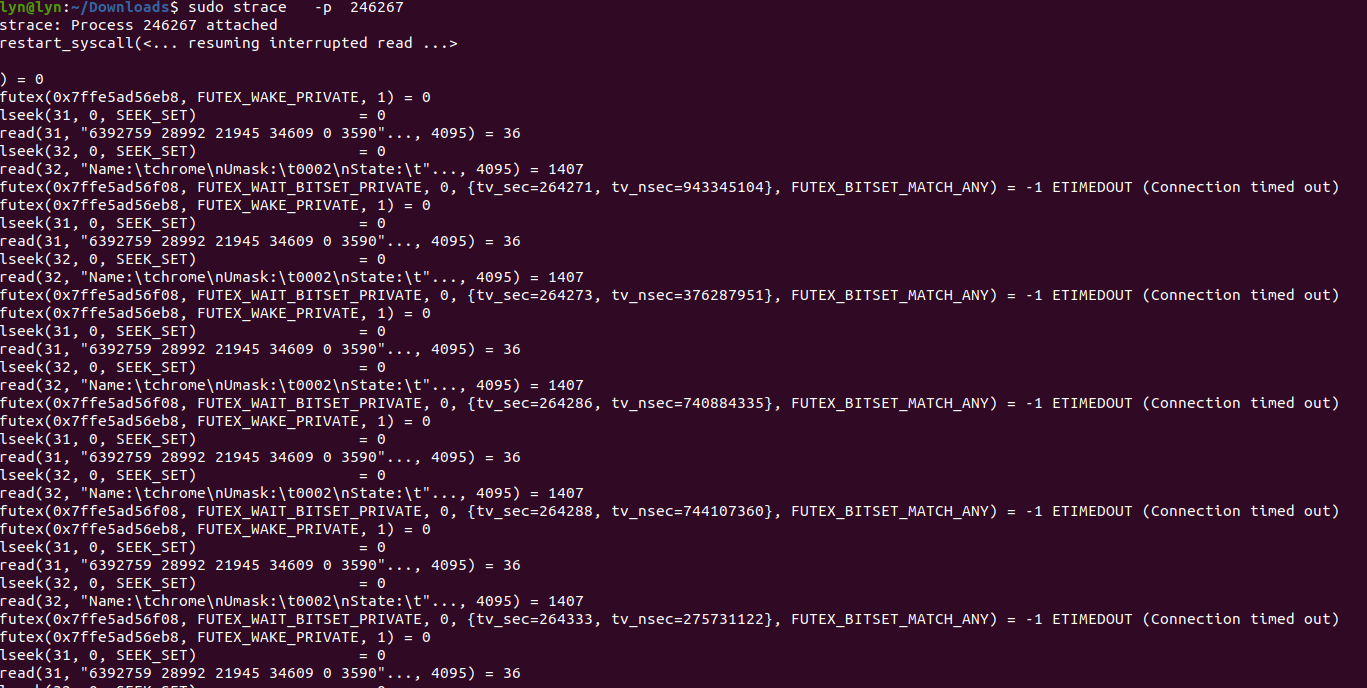
By observing the system call, we can confirm the behavior of the current program and analyze whether its consumed time and return value are normal. You can filter the specified thread number to confirm whether the behavior of the current thread meets the expectation. If there is no output after executing the command, you can doubt whether it is blocked due to network, IO and other reasons, or the program has deadlock.
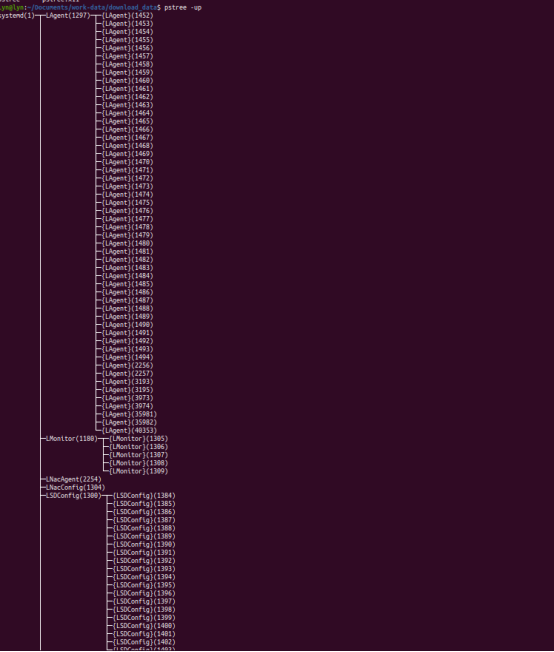
Introduction to pstree options and parameters:
The command displays all processes in a tree view. The tree view will take pid (if specified) or init as the root. If a user id is specified, the tree view will only display the processes owned by the user. If you want to use this package, you need to add this tool to the linux lib and bin directories you use.
-A: The connection between the process trees is ASCII Code character to connect
-U:The connection between the process trees is utf8 Characters to connect, some terminals may have errors
-p:List the of each process at the same time PID
-u: At the same time, the account name of each process is listed:
pstree -up outputs process and child process tree data
Kill < sig > < PID > and coredump files to view the thread stack:
Because sometimes there are not all the tools under the linux environment we use. For example, pstack mentioned above to view the corresponding thread will be replaced by other commands and tools. Here I will introduce two methods I use to view my actual stack and corresponding pid thread information.
kill -11 461
The corresponding process will appear Segmentation fault (core dumped)
We set the generation of coredump file. There is an error signal in the generation condition, so I sent 11 signals to the process.
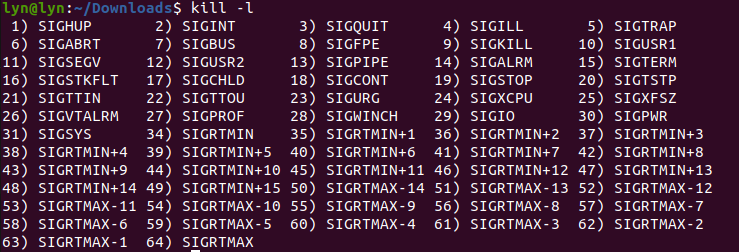
If you don't know the corresponding number for the signal you need, you can use the kill -l command to query.
As for viewing the corresponding stack information through coredump, my previous article is more comprehensive, so I won't repeat it here. You can click this article to view it
Linux development coredump file analysis and actual combat sharing.
In addition to killing the specified process with the Kill Command, we can also kill the process with the top combination command:
First, use top to enter the information displayed on top. Secondly, if we select 461, the process is ready to kill:
Enter k first to enter the kill option of top
PID to signal/kill [default pid = 1451]
  PID USER      PR  NI    VIRT    RES    SHR S  %CPU  %MEM     TIME+ COMMAND
  461 root     -96 -20 2081464  28672  17756 S  21.7   1.4   0:07.05 exc
Then enter the specified pid 461 as prompted
PID to signal/kill [default pid = 1451] 461
After using enter, I input the signal according to the prompt, and I selected 11 (segment error signal)
Send pid 461 signal [15/sigterm] 11
This operation is equivalent to kill -11 461
GDB attach < PID > real time debugging:
This is too laggy debugging tool in gdb, which specifies the real time debugging process. But in fact, it encountered large code and debugged too. So it basically doesn't need real-time debugging. I use it to do some real-time stack information and check the match between thread id and actual code.
The operation is also relatively simple. From the above, we can know the pid of the process you are running. You can debug by specifying the pid with gdb attach. The operation command after entering is the command for gdb debugging.
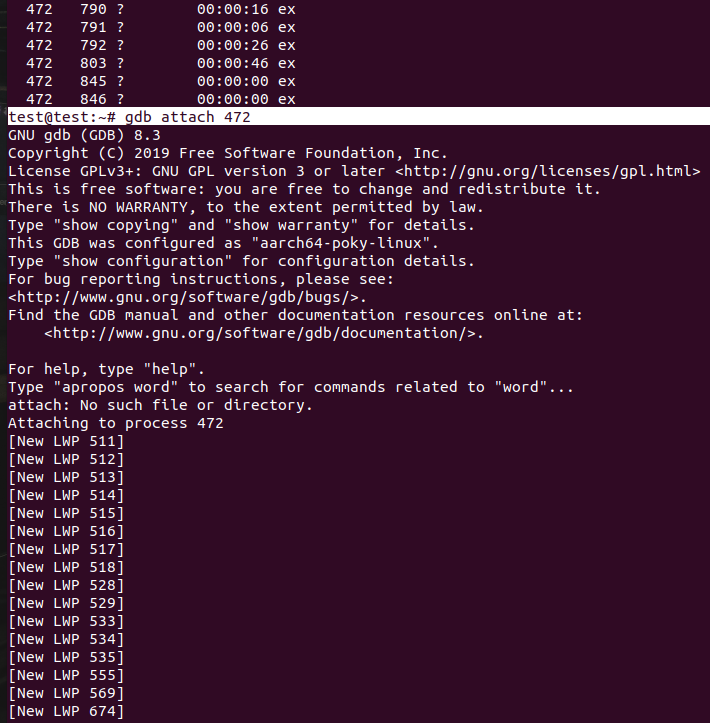
You can see that as soon as gdb attach comes in, the corresponding lwp thread pid is displayed in the front. This pid is consistent with the pid information printed by top command, ps command, strace and ltrace. Through the same pid, we can know the specific operations performed under the process or thread.
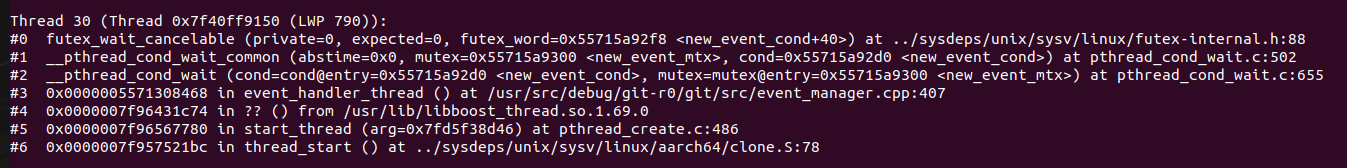
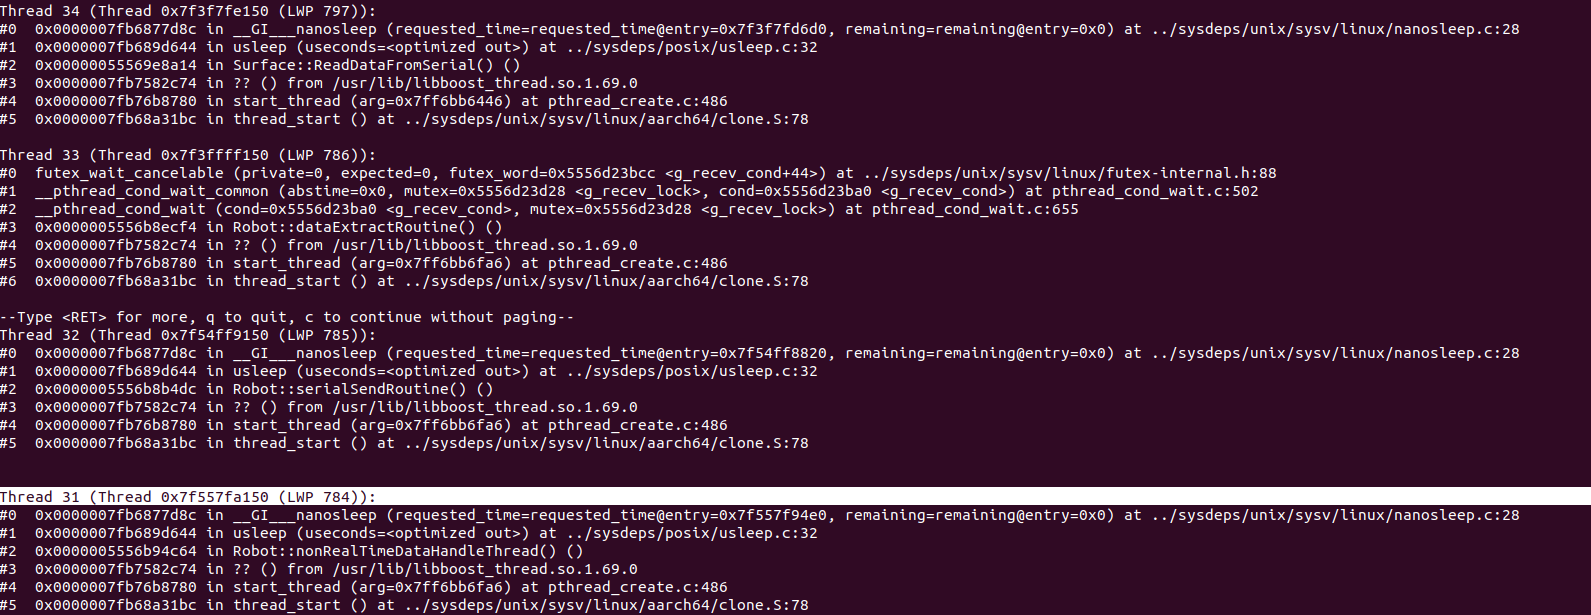
Enter the gdb command thread apply all bt, and we can see the stack of the corresponding thread. Through the stack information, we can find the code in reverse.
The following is an interception, showing a stack information of lwp 790 (thread pid==790). Through #3 we can know the thread code in event_ Line 40 of manager.cpp
Combined use in actual combat
Through the above command introduction, we also know which tools we can use under linux to analyze our abnormal processes and threads. Next, I will introduce the combined use of these tools to you through a case I actually encounter.
First, I use the top command to check my cpu usage
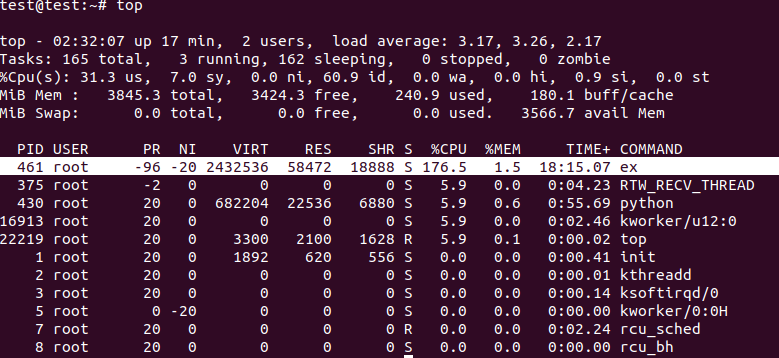
This shows that the ex process occupies 176% of the cpu (my device is a multi-core device), that is, almost two cores of cpu are full. At this time, you can see that the cpu resources mainly occupied are user state resources, so it is recommended to use ltrace for viewing. However, there is no package in my device at present, so I directly use strace for viewing.
Next, I want to know which thread in the process, which part of the code the thread corresponds to, and what operations it frequently performs.
Therefore, I first used top -Hp 461 to check the percentage of cpu executed by all threads under the corresponding process.
You can also use ps -T -p 461 to view the thread pid information corresponding to the process
ps -eLo pid,lwp,pcpu |grep 461 view the time consumed by thread execution
strace -p 461 -f to view the most executed part of the kernel interaction function under this process
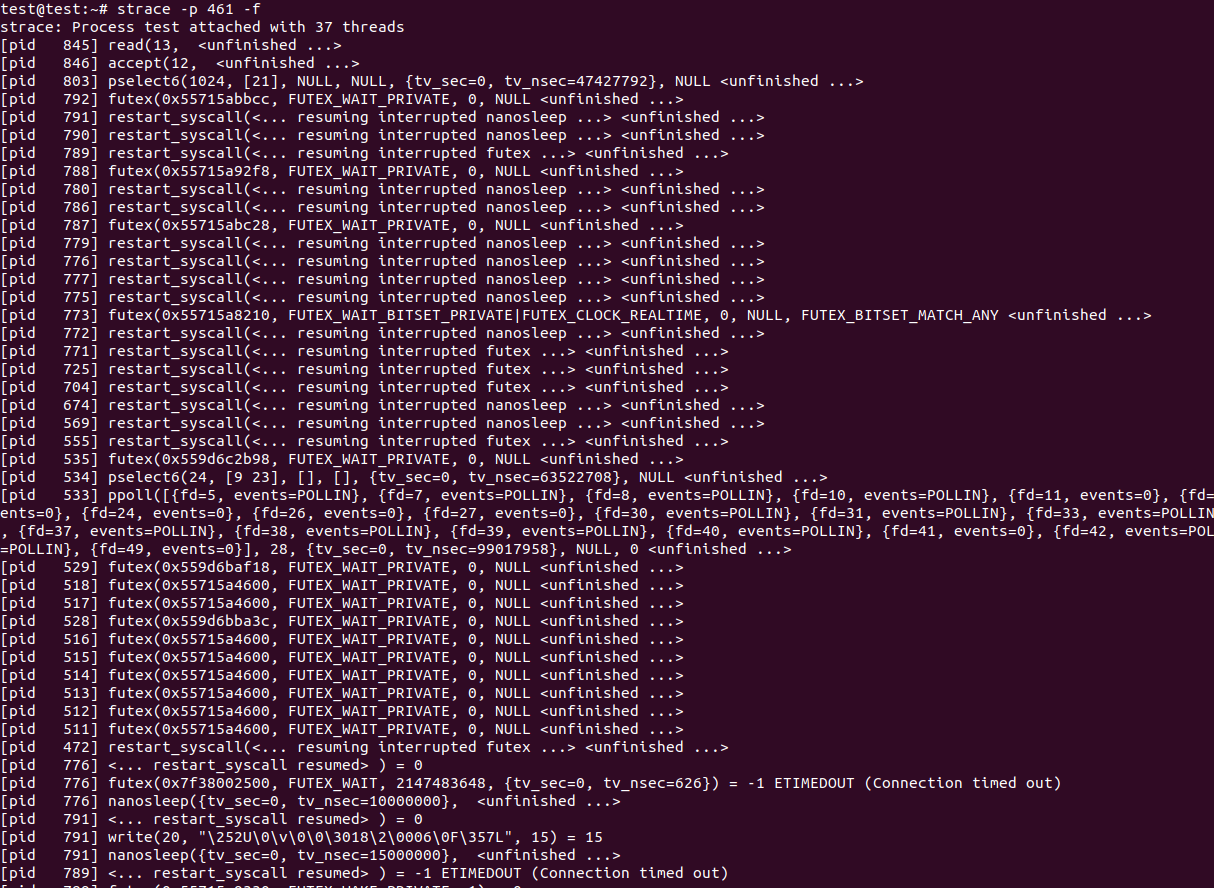
The leftmost part is the thread PID under the corresponding execution IO function. At the same time, we can directly specify the thread PID to query the thread. For example, when we see that thread 845 is reading a device with fd 13, we can separate strace -p 845
Originally, strace, ltrace and pstack should be used together, but there are no ltrace and pstack on the device I use, so I use gdb attach to directly debug the process and view the corresponding thread stack information to confirm that the thread pid information of the top combination command is mapped with the actual code.
gdb attach 461 real-time debugging to view thread stack information to match the actual part of the code
After entering, directly use thread apply all bt to view the corresponding thread stack information. Through the stack information, we can know the corresponding code part
LWP < PID > is displayed at the top of each stack information, so you can check the code.
At this time, we know which threads are under the process. We also need to know which part of the code the thread corresponds to and what operations the thread performs.
Strace and gdb attach commands are good technologies from the beginning of development, but in actual use, due to the complexity of the code and the limitation of c and cpu, in my use of strace and gdb attach, these tools will occupy your cpu resources because they have to monitor the process all the time. Even gdb attach starts debugging, the machine runs very slowly directly, and the remote ssh login is stuck. Therefore, you can only use some operations that consume less resources to view information, such as mtrace and valgrind in memory analysis. Once it is started and used, the machine will directly stop. So many times, although the tools are good, they can only help. More importantly, we should write code in a standardized way.
epilogue
This is how I share some linux thread monitoring operations I use in my work. If you have better ideas and needs, you are also welcome to add my friends to communicate and share.
Author: conscience still exists, hard work during the day, original public number owner at night. In addition to technology, there are some life insights in official account. A serious driver who drives the contents of the workplace is also a rich person living outside technology. And basketball is a photo and music. Follow me and walk with me.
‧‧‧‧‧‧‧‧‧‧‧‧‧‧‧‧ END ‧‧‧‧‧‧‧‧‧‧‧‧‧‧‧‧
Recommended reading
[1]On the court, I bowed my head to the RMB player
[2]Linux development coredump file analysis and actual combat sharing
[3]How does the program in the CPU run Required reading
[4]cartographer environment establishment and mapping test
[5]Comparison of simple factory mode, factory mode and abstract factory mode of design mode
All the original dry cargo of the official account has been organized into a catalogue, and the reply is made available.