
Author: Wu Zhiwei
In the past two years, Flutter technology has been used more or less in both innovative applications and old flagship applications. However, the most common problem reported by the Flutter business team is that the memory consumption of Flutter is too high.
The reasons for the high memory usage of the Flutter are complex, so it needs to open another topic to make it clear. Briefly summarize the conclusion of our research: the combination of Dart Heap memory management and the design of fluent widget leads to high business memory, and its core problem engine design makes it easy for developers to step on memory leakage. During development, memory leaks are common and difficult to locate. Two main reasons are summarized:
- The design of fluent rendering three trees and the characteristics of Dart's various asynchronous programming make it difficult to analyze the object reference relationship
- Dart "closure" and "instance method" can be assigned and passed, resulting in the class being held by the method context, and inadvertently leakage will occur. Typically, for example, registering a listener does not de register, resulting in the disclosure of the class object where the listener is located
Developers enjoy the convenience of Flutter development, but unknowingly bear the bitter fruit of memory leakage. Therefore, we urgently need a set of efficient memory leak detection tools to get rid of this dilemma.
Check several memory leak detection schemes I have learned:
- Monitor State for leaks: leak detection for State. But is State the object that accounts for the largest proportion of memory leaks in fluent? StatelessWidget objects can also reference large amounts of memory
- Monitor the number of layers: compare the number of layers in use and memory to determine whether there is a memory leak. Is the scheme accurate in determining memory leakage? The Layer object is too far away from the business Widget and it is too difficult to trace the source
- Expando weak reference leak determination: determines whether a specific object is leaked and returns the reference chain. But we don't know which object should be monitored most in fluent, and which object leakage is the main problem?
- Memory leak detection based on Heap Snapshot: compare the growth of Heap objects of Dart virtual machine at two different time points, and detect the suspicious objects with leakage by two indicators of "class memory increment" and "number of object memory". This is a general solution, but it is more valuable to locate the leaked object (Image, Layer) efficiently. At present, the two problems of "determining the detection object" and "detection time" are not easy to solve, so it still needs to be checked and confirmed manually one by one, and the efficiency is not high.
In short, we feel that schemes 1 and 2 are not logically complete, and the efficiency of schemes 3 and 4 needs to be improved.
What's a better solution?
Referring to Android, LeakCanary can accurately and efficiently detect Activity memory leakage and solve the main problem of memory leakage. Can we also implement such a tool in fluent? This should be a better plan.
Before answering this question, first think about why LeakCanary selects Activity as the object of memory leak monitoring, and can solve the main memory leak problem?
We conclude that it meets at least the following three conditions:
- The memory referenced by the leaked object is large enough: the memory referenced by the Activity object is very large, which is the main problem of memory leakage
- It can fully define memory leakage: the Activity has a clear life cycle and exact recovery time. The leakage definition is complete, which can realize automation and improve efficiency
- High risk of leakage: the Activity base class is Context, which is passed as a parameter. It is used very frequently and has a high risk of leakage
The three conditions reflect the necessity of monitoring objects and the operability of monitoring tools.
Following this idea, if we can find objects that meet the above three conditions in Flutter and monitor them, we can make a set of Flutter LeakCanary tools to solve the main problem of memory leakage in Flutter.
Review the recently solved memory leakage problem from the actual project. The memory surge is reflected in the image and picture objects, as shown in the figure below.
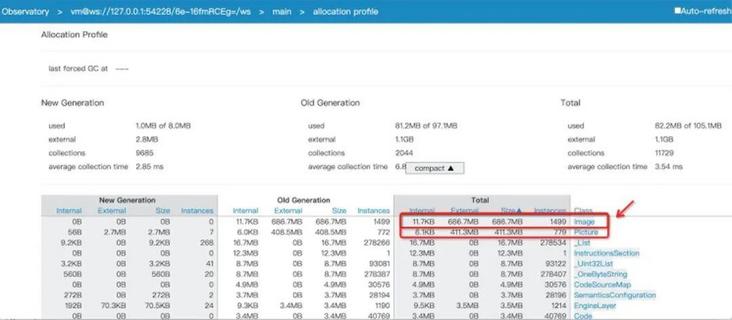
Although image and picture occupy high memory and are the main contributors to memory leakage, they can not be used as the targets of our monitoring because they obviously do not meet the three conditions listed above:
- Large memory consumption is caused by the accumulation of a large number of objects, not by an Image reference
- It is impossible to define when a leak occurs, and there is no clear life cycle
- It will not be passed as a common parameter, and the use places are relatively fixed, such as RawImage Widget
Through in-depth analysis of fluent rendering, it is concluded that the root cause of image and picture leakage is BuildContext leakage. BuildContext just meets the three conditions listed above (detailed later). It seems to be the object we are looking for. It seems good to implement a set of scheme to monitor BuildContex leakage.
Please remember these three conditions, which we will often use later.
Why monitor BuildContext
What is the memory referenced by BuildContext?
BuildContext is the base class of Element, which directly refers to Widget and RenderObject. The relationship between its classes is also the relationship of Element tree, Widget tree and RenderObject tree formed by them. The class relationship is shown in the following figure.
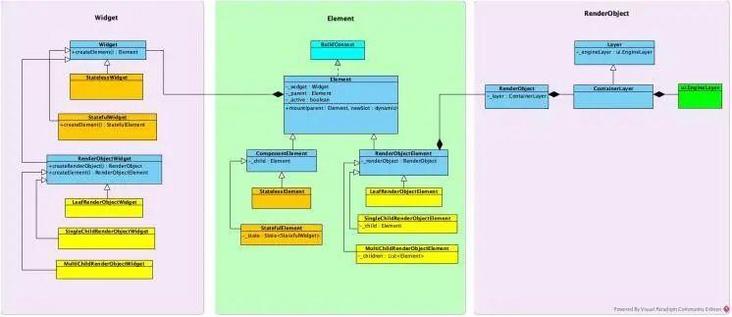 []()
[]()
Highlight the following Element Tree:
- The three trees are built through the mount / unmount method of Element
- Parent and child elements strongly reference each other, so Element leakage will lead to the leakage of the whole Element Tree, together with the strong reference to the corresponding widget tree and renderobject tree, which is considerable
- The widget is strongly referenced in the Element, and the field of renderobject will not be automatically set to null, so the release of the three trees depends on the Element to be recycled by the GC
A Widget Tree represents a referenced Widget, such as a RawImage Widget that references an Image. RenderObject Tree will generate a Layer Tree and will strongly reference ui.EngineLayer (c + + allocated memory), so the rendering memory related to Layer will be held by this tree. Based on the above, BuildContext refers to three trees in fluent. Therefore:
- The memory occupied by the BuildContext reference is large, meeting condition 1
- BuildContext is frequently used in business code and passed as a parameter. It has a high risk of leakage and meets condition 3
How to monitor BuildContext
Can the leakage of BuildContext be fully defined?
From the life cycle of Element:
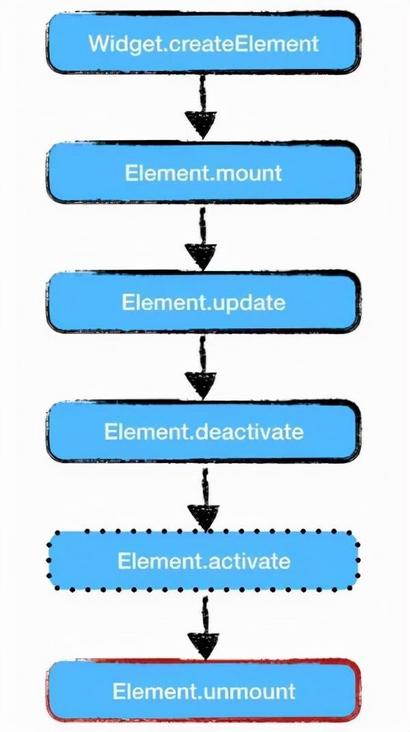
The key point is to determine when the Element will be discarded by the Element Tree and will not be used again. It will be recycled with the subsequent GC.
The finalizeTree processing code is as follows:
// flutter_sdk/packages/flutter/lib/src/rendering/binding.dart
mixin WidgetsBinding on BindingBase, ServicesBinding, SchedulerBinding, GestureBinding, RendererBinding, SemanticsBinding {
  @override
  void drawFrame() {
    ...
    try {
      if (renderViewElement != null)
        buildOwner.buildScope(renderViewElement);
      super.drawFrame();
      // At the end of each frame, the Element removed from the Element tree is recycled
      buildOwner.finalizeTree();
    } finally {

    }
  }
}

// flutter_sdk/packages/flutter/lib/src/widgets/framework.dart
class BuildOwner {
  ...
  void finalizeTree() {
    try {
      // _ Inactive elements records elements that are no longer used
      lockState(() {
        _inactiveElements._unmountAll(); // this unregisters the GlobalKeys
      });
    } catch() {
    }
  }
  ...
}

// flutter_sdk/packages/flutter/lib/src/widgets/framework.dart
class _InactiveElements {
  ...
  void _unmountAll() {
    _locked = true;
    // Copy Element to the temporary variable elements
    final List<Element> elements = _elements.toList()..sort(Element._sort);
    // Empty_ Element s. After the current method is executed, elements will also be recycled, and all elements will normally be recycled by GC.
    _elements.clear();
    try {
      elements.reversed.forEach(_unmount);
    } finally {

      assert(_elements.isEmpty);
      _locked = false;
    }
  }
  ...
}
finalize phase_ Inactive elements stores elements that are discarded by the Element Tree and will not be used again; After the unmount method is executed, it waits to be recycled by the GC.
Therefore, Element leakage can be defined as: after umount is executed, and references to these elements still exist after GC, it indicates that Element has memory leakage. Meet condition 2.
Memory leak detection tool
Tool description
We have two requirements for the memory leak tool:
- Accurate. Including core object leak detection: image, layer and state, which can solve more than 90% of the memory leak of fluent
- Efficient. Business insensitivity, automatic detection, optimization of reference chain, and rapid location of leakage source
accuracy
From the above description, BuildContext is undoubtedly the object most likely to cause large memory leakage and the best object as a monitoring object. In order to improve accuracy, we also monitor the most commonly used State objects.
Why add State object monitoring?
Because the business logic control is implemented in the State, the delivery of "closures or methods" implemented in the business can easily lead to State leakage. Examples are as follows.
class MainApp extends StatefulWidget {
  @override
  State<StatefulWidget> createState() {
    return _MainAppState();
  }
}

class _MainAppState extends State<MainApp> {
  @override
  void initState() {
    super.initState();
    // Registering this callback, if it is not de registered or held by other contexts, will result in_ MainAppState leak.
    xxxxManager.addListerner(handleAction);
  }

  @override
  Widget build(BuildContext context) {
    return MaterialApp(
    );
  }

  // 1 callback
  void handleAction() {
    ...
  }
}
What memory will be leaked by the State Association?
Combined with the following code, the leakage will certainly lead to the leakage of the associated Widget, and if the memory associated with the Widget is an Image or gif, the leaked memory will also be very large. At the same time, the State may also be associated with some other strongly referenced memory.
// flutter_sdk/packages/flutter/lib/src/widgets/framework.dart
abstract class State<T extends StatefulWidget> with Diagnosticable {
  // Widget leakage corresponding to strong reference
  T _widget;
  // When unmount_ element = null, no leakage
  StatefulElement _element;
  ...
}

// flutter_sdk/packages/flutter/lib/src/widgets/framework.dart
class StatefulElement extends ComponentElement {
  ...
  @override
  void unmount() {
    ...
    _state.dispose();
    _state._element = null;
    // If it is held elsewhere, it will lead to leakage. After unmount, the State is still held and can be defined as a leak.
    _state = null;
  }
  ...
}
Therefore, our scheme monitors the BuildContext associated with large memory and the State of common business operations to improve the accuracy of the whole scheme.
Efficient
How to realize automatic and efficient memory leak detection?
First of all, how do we know whether an object leaks? Taking BuildContext as an example, we adopt a method similar to "Java object weak reference" to determine object leakage:
- Put the inactive elements of the finalizeTree stage into the weak Reference map
- After Full GC, detect the weak Reference map. If there are still unreleased elements in it, it is determined that there is a leak
- The size associated with the leaked Element, the corresponding Widget, and the information output of the leakage reference chain
Although Dart does not directly provide the "weak reference" detection capability, our Hummer engine has fully implemented the "weak reference leak detection" function from the bottom. Here is a brief introduction to its interface for determining leaks:
// Add objects that need to detect leaks, similar to placing objects in the referenced map
external void leakAdd(Object suspect, {
    String tag: '',
});
// FullGc is performed to detect whether the previously placed object has leakage
external void leakCheck({
    Object? callback,
    String tag: '',
    bool clear: true,
});
external void leakClear({
    String tag: '',
});
external String leakCount();
external List<String> leakTags();
Therefore, to realize automatic detection, we only need to specify the time when leakAdd(), leakCheck(), is called.
leakAdd timing
The timing of BuildContext is in the unmount process of finalizeTree:
// flutter_sdk/packages/flutter/lib/src/widgets/framework.dart
class _InactiveElements {
  ...
  void _unmount(Element element) {
        element.visitChildren((Element child) {
      assert(child._parent == element);
      _unmount(child);
    });

    // BuildContext leakAdd() timing
    if (!kReleaseMode && debugMemoryLeakCheckEnabled && null != debugLeakAddCallback) {
      debugLeakAddCallback(_state);
    }

    element.unmount();
    ...
  }
  ...
}
The State timing is in the unmount process of the corresponding StatefulElement:
// flutter_sdk/packages/flutter/lib/src/widgets/framework.dart
class StatefulElement extends ComponentElement {
  @override
  void unmount() {
    _state.dispose();
    _state._element = null;

    // State leak leakAdd() time
    if (!kReleaseMode && debugMemoryLeakCheckEnabled && null != debugLeakAddCallback) {
      debugLeakAddCallback(_state);
    }

    _state = null;
  }
}
leakCheck timing
leakCheck is essentially a time point to detect whether there is a leak. We think Page exit is an appropriate time to detect memory leak in business pages. The example code is as follows:
// flutter_sdk/packages/flutter/lib/src/widgets/navigator.dart
abstract class Route<T> {
  _navigator = null;
  // BuilContext, State leakCheck
  if (!kReleaseMode && debugMemoryLeakCheckEnabled && null != debugLeakCheckCallback) {
    debugLeakCheckCallback();
  }
}
Tool implementation
The automatic memory leak detection system based on Page provides three memory leak detection tools according to the usage scenario.
- The depth customized DevTools resource panel display of Hummer engine can automatically / manually trigger memory leak detection
- Independent APP side memory leak display. In case of Page leak, the details of the leak object will pop up
- Hummer engine seagull laboratory automatically detects and reports the details of memory leakage
Tools 1 and 2 provide memory leak detection capability in the development process. Tool 3 can be used as routine health test of APP, automatic test and output test report results.
Exception detection example
Simulate the statelesswidget in the Demo. The statefulwidget is held by BuildContext, resulting in a leak. The reason for the leak is that it is held statically and the Timer is held abnormally.
// Verifying StatelessWidget leaks
class StatelessImageWidget extends StatelessWidget {
  @override
  Widget build(BuildContext context) {
    // Leakage caused by simulating static holding BuildContext
    MyApp.sBuildContext.add(context);

    return Center(
        child: Image(
          image: NetworkImage("https://avatars2.githubusercontent.com/u/20411648?s=460&v=4"),
          width: 200.0,
        )
    );
  }
}

class StatefulImageWidget extends StatefulWidget {
  @override
  State<StatefulWidget> createState() {
    return _StatefulImageWidgetState();
  }
}

// Verifying StatefulWidget leaks
class _StatefulImageWidgetState extends State<StatefulImageWidget> {
  @override
  Widget build(BuildContext context) {
    if (context is ComponentElement) {
      print("sBuildContext add :" + context.widget.toString());
    }

    // It is simulated that the BuildContext is held asynchronously by the Timer, resulting in leakage. The delay of 1h is used to explain the problem
    Timer(Duration(seconds: 60 * 60), () {
      print("zw context:" + context.toString());
    });

    return Center(
        child: Image(
          image: NetworkImage("https://avatars2.githubusercontent.com/u/20411648?s=460&v=4"),
          width: 200.0,
        )
    );
  }
}
Enter two Widget pages respectively and exit to detect the leakage results.
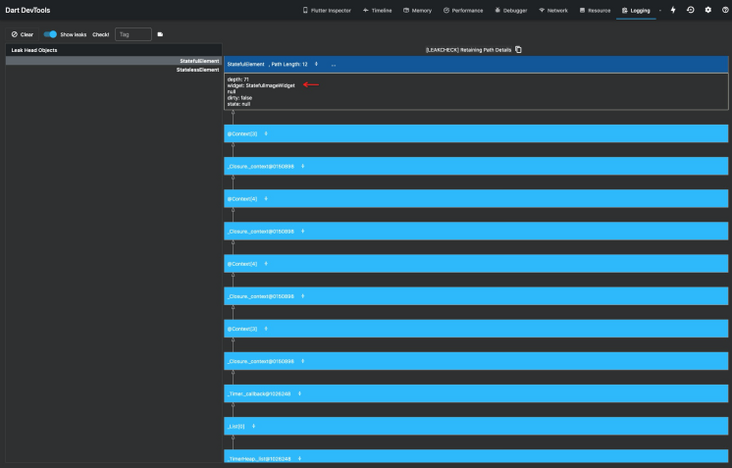
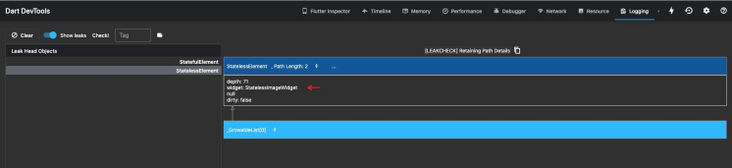
Tool 1 - DevTools resource panel display:
StatefulElement leak detection shows that StatefulImageWidget is held asynchronously by Timer, resulting in leakage.
StatelessElement leak detection shows that the StatelessImageWidget is statically held, resulting in a leak.
Tool 2 - independent app end leakage display:
The aggregation page shows all the leaked objects, and the details page shows the leaked objects and the object reference chain.
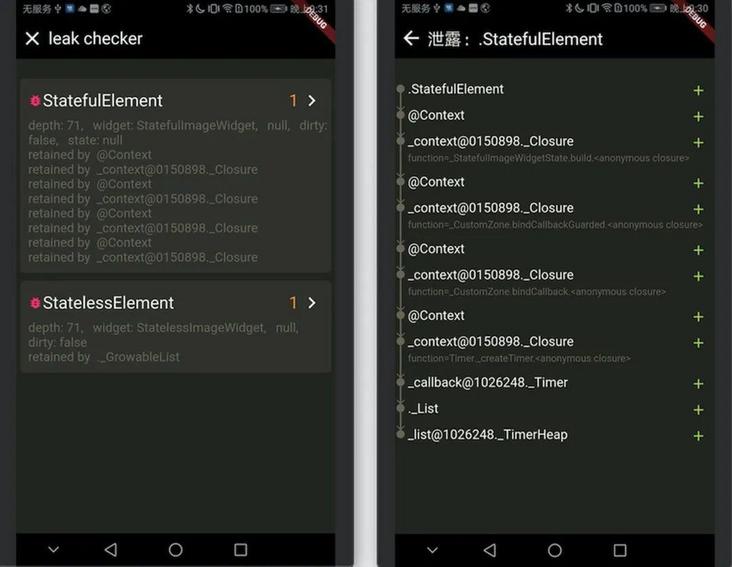
According to the leakage chain given by the tool, the leakage source can be found quickly.
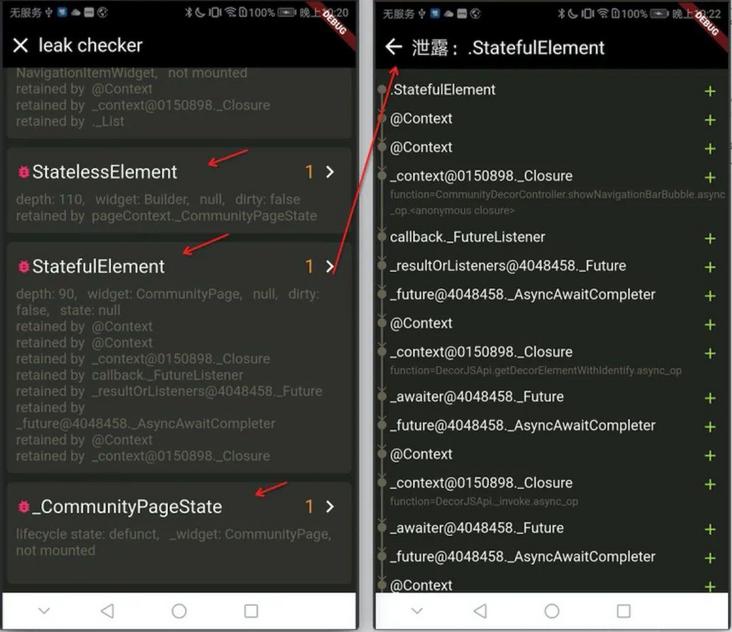
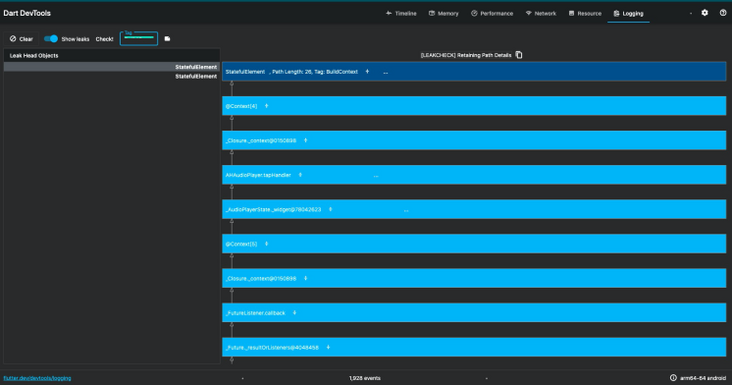
Business practice
A content-based service of UC is characterized by multiple graphic and video contents, and the memory consumption is quite large. Previously, we solved some state and buildcontext leakage problems (time-consuming and painful) based on the native observer tool of fluent. In order to verify the practical value of the tool, we restore the memory leak problem to verify. The results show that the problems that have been painstakingly investigated before can be detected in an instant, and the efficiency is greatly improved. Compared with the investigation tool, it is just a cloud and mud. Based on the new tools, we have found many memory leaks that have not been checked out before.
In this example, the leaked statefulelement corresponds to a heavyweight page. The Element Tree is very deep, and the memory associated with the leak is considerable. After we solved this problem, the business crash rate caused by OOM decreased significantly.
According to the feedback of our classmates who developed another pure fluent app, they know that the memory will increase in some scenarios and there are leaks, but there is no effective means to detect and solve them. Access our tool for detection, and the results detect the memory leakage problem in many different scenarios.
Business students recognize this very much, which also gives us great encouragement to do this set of tools, because it can quickly solve practical problems and enable business.
Summary and Prospect
Based on the reality of Flutter memory leak, this paper summarizes that the main memory consumption is image and layer, and the necessity of exploring a set of efficient memory leak detection scheme. By using Android leak Canary for reference, we summarize three conditions for finding leak monitoring objects; Through the analysis of three trees rendered by fluent, BuildContext is determined as the monitoring object. In order to improve the accuracy of detection tools, we add State monitoring and analyze the necessity. Finally, a scheme of efficient memory leak detection tool is explored, and its advantages are as follows:
- More accurate: including core leakage objects, widget s, layers, and states; Directly monitor the source of leakage; Fully defined memory leak
- More efficient: automated detection of leaking objects, shorter and direct reference chains
- No perception of business: reducing the burden of development
This is the industry's first set of memory leak detection tools with complete logic, high practical value, high efficiency and automation. It can be described as the strongest Flutter memory leak detection tool scheme.
This scheme can cover all the memory leakage problems we currently encounter, greatly improve the memory leakage detection efficiency and escort the Flutter of our business. At present, the implementation of the scheme is based on Hummer engine and runs in debug and profile mode. In the future, online release mode detection will be explored to cover scenes that cannot be reproduced locally.
We have plans to provide access methods for non Hummer engines to feed the community. Please look forward to it.