Preface
The text and pictures of the article are from the Internet, only for learning and communication, and do not have any commercial use. The copyright belongs to the original author. If you have any questions, please contact us in time for handling.
PS: if you need Python learning materials, you can click the link below to get them by yourself
http://note.youdao.com/noteshare?id=3054cce4add8a909e784ad934f956cef

My analysis is divided into three core steps:
Step 1: crawl the link of product ranking and details page. The required fields are: ranking, product name and details page link step 2: crawl the product details. The required information is:
-
Shopkeeper: isn't that a competitor? Analyze the situation of its explosive products, keep the store links, and analyze the subsequent targeted mining
-
Price: analyze the price range of explosive products, which is helpful for commodity pricing and market segmentation
-
Launch time: new product? How long did it last?
-
Star rating, number of comments, comment tag, all comment links: further crawling comment content to analyze advantages and disadvantages of explosives
-
Size and color: they are also very valuable reference data, but there are problems in the actual climbing process, which will be mentioned later
-
Photo link: don't you want to see what the product looks like?
Step 3: convert the data into visual chart and analyze it.
Can't wait to see the process. Come on~

How to crawl underwear data
The climbing process is divided into three steps
1. Link to the product ranking and details page
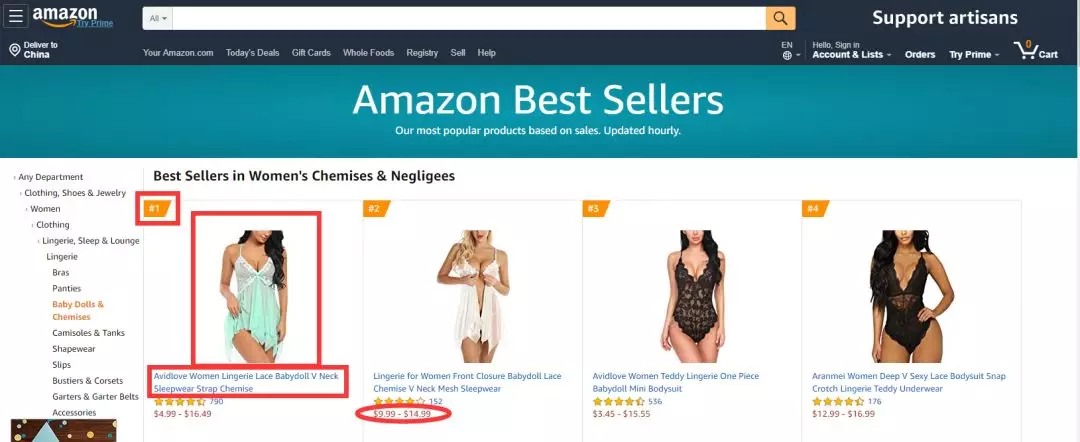
Specific fields to be crawled: Rank, item name, item link, IMG SRC
2. Crawl more product information on the product details page
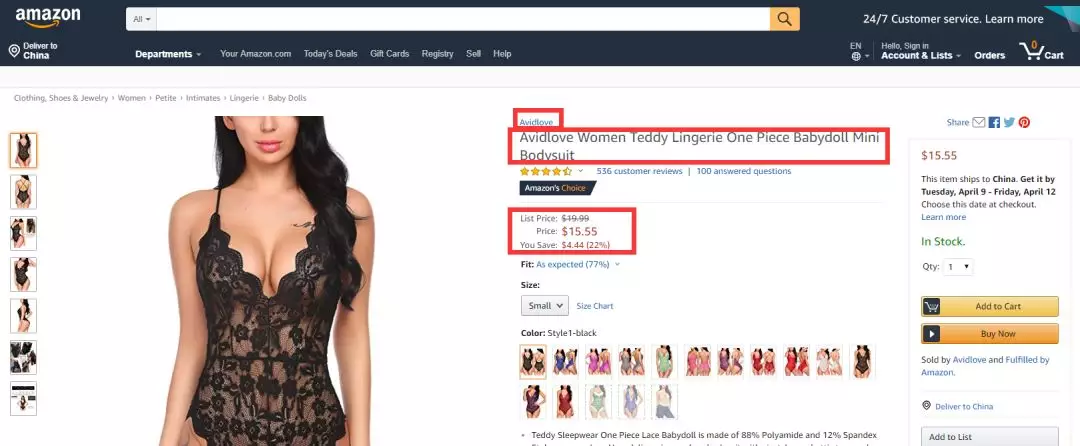
Core issues:
1) build a function to get the details of a single product; 2) use for loop to traverse the link list of the product details page to get the details of each product
3. Crawling comments 
Core issues:
1) from the csv file in the previous step, read rank, item name, reviews, reviews link fields 2) build function to read all comments of each product 3) use for loop to get all comments of all products 4) store them in database and csv file
4. Crawling size and color data
As in step 3, the code is basically the same, mainly to confirm the number of size & color comments per page.
Data cleaning and preprocessing
1. Reading and cleaning data
Read the data of 100 commodities from the csv file, filter out the required fields, and clean the data
-
Part of the data read seems to be numeric value, but actually is character. Therefore, type conversion is required (for example, after price splitting, it needs to be converted to float type)
-
NaN to be involved in numerical calculation, replace with average value
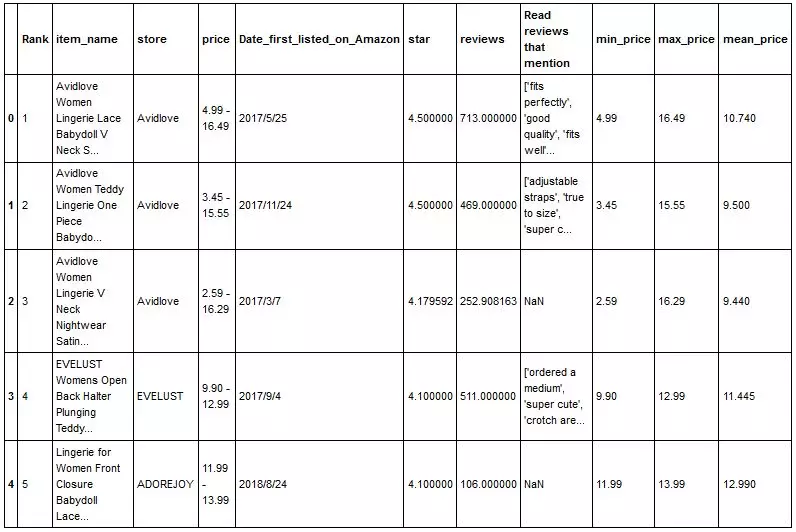
2. Processing data with merchant dimension
Obtain the required data: star rating, total number of comments, average number of comments, mean value of lowest price, mean value of highest price, mean value of price, quantity of goods and proportion of the merchants. Standardize the star rating, average number of comments, average price and quantity of goods, and calculate the weighted score. 
Which one is stronger?
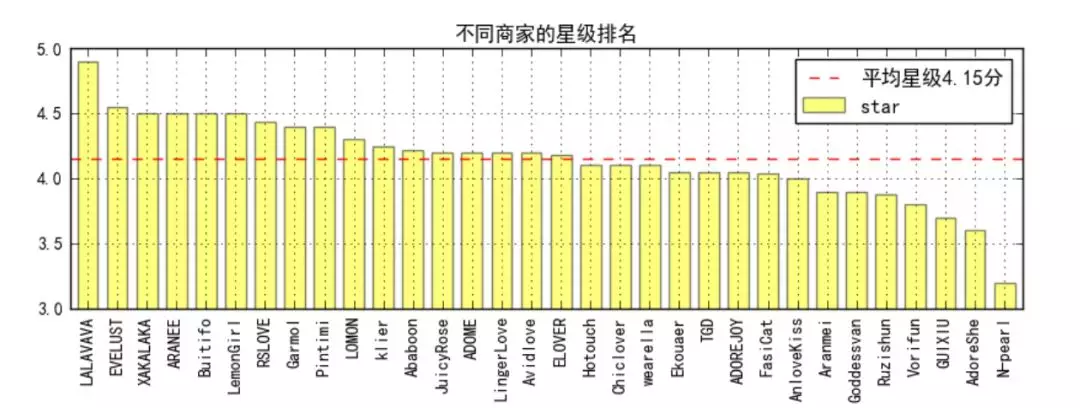
① star ranking of different businesses
-
The average star rating is 4.15, and more than half of the merchants above the average score (17 / 32)
-
Top 1's lavava is 4.9 points, followed by 5 with 4.5 points.
-
The last n-pear is only 3.2 points
Let me see what LALAVAVA looks like. The products on Amazon look like ordinary swimsuits. The Chinese are still very conservative~ 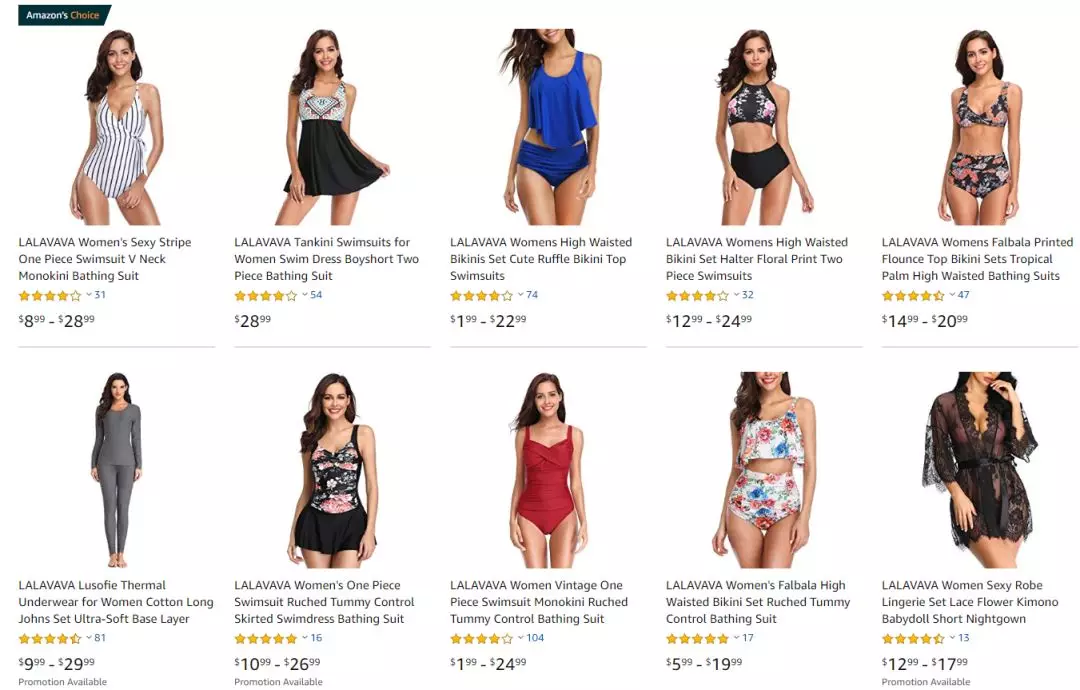
But does a high score really mean a good product? Let's take a look at the number of comments——
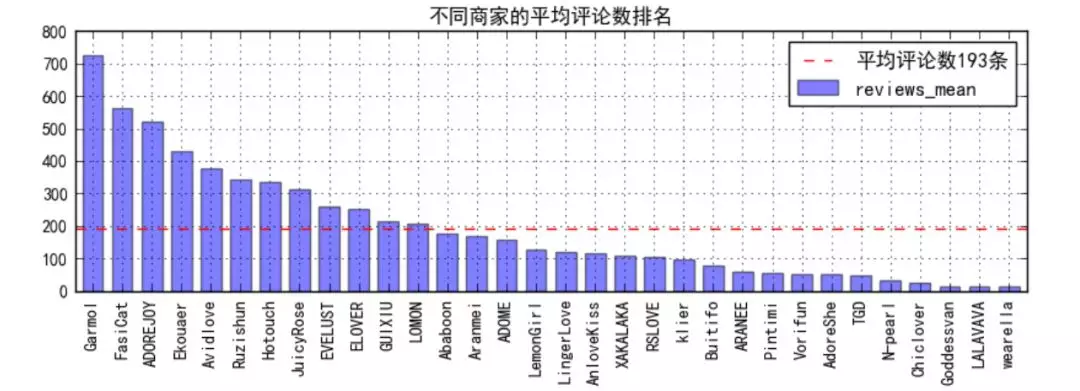
② ranking of average comments of different businesses
-
First of all, the average number of comments is only 193, and less than 30% of them (12 / 32) are higher than the average. Considering that Taobao is prone to tens of thousands, our population advantage is envied by the people of the United States;
-
Let's look at the LALAVAVA of star top 1. The number of comments is so small that we have doubts about the real quality of its products;
-
However, N-pear I, which is the reciprocal of stars, also has few comments, which probably leads to the fact that its products are not so good;
-
On the contrary, Garmol with the number of comments of top 1 has a star rating of 4.4, and has many well-known comments, which seems to be a good commodity;
-
The next few have below average star ratings
So, is Amazon's star rating only affected by a few stars of the number of reviews? I checked some information on the Internet and found three important factors in Amazon's star rating: the time when reviews are from now, the number of reviews voted by buyers, and whether there is a verified purchase logo. In addition, factors such as the number of characters in the comment and the number of hits may also affect the star rating of the comment.
It seems that Amazon's monitoring and management of comments is very strict and complex! Of course, the most important thing is to see what Garmol looks like in the first place in the review: 
It's more topical than the swimsuit on the top. It's really good that you say it well, very sexy!

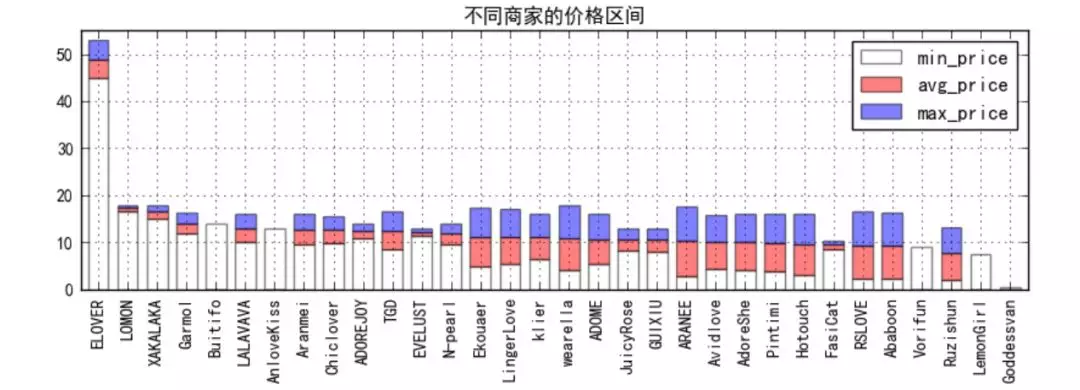
③ price range ranking of different merchants (by average price)
-
From the figure, it is clear that ELOVER is targeting the high-end market, with a pricing range of about 49 yuan; on the contrary, Goddessvan only has a pricing range of 0.39 yuan, with only one price. It is speculated that it may be a loss impulse, which will increase the exposure of businesses and seize the low-end market
-
From the perspective of average price, it is basically distributed between $10 and $20, indicating that this is the main price range of the lingerie market; however, there are no businesses in the $20-40 range, so we can make in-depth study in this area to see if we can find evidence that this range is blue Ocean and has greater market potential
-
In terms of the price range of each business, most of them adopt the strategy of multi-color or style. On the one hand, they provide users with more choices, on the other hand, they also reflect the new capabilities of the business. However, only a few adopt the strategy of single burst
The most luxurious ELOVER looks like a goddess indeed. Thumbnails are more attentive than other homes.

So, which business's strategy is more reliable and its market share is larger?
④ pie chart of commodity quantity of merchants

-
Avidlove dominates by 28% of the top 100 products
-
And other businesses are basically single digit proportion, without obvious advantages and disadvantages
Avidlove's underwear is cool, I like it.

After all, it's hard to measure which business is better in a single aspect. It's better to analyze it with multiple indicators~
⑤ weighted ranking of different businesses

After standardizing the star rating, average comment number, average price and quantity of goods, because it is not easy to determine the weighted proportion, the normalized results of the four items x10 are directly accumulated to get the total score, and a stacked map is made.
The proportion of four indicators of each business reflects its own advantages and disadvantages.
-
Avidlove, the cool underwear just now, won the first comprehensive score with the advantage of commodity quantity under the condition of the other three items being in order. It feels like the countryside surrounding the city
-
Garmol, mainly relying on the advantages of word of mouth (star rating, average number of comments), won the second place
-
ELOVER, mainly relying on accurate segmentation of high-end market, won the third place
-
N-pearI, no advantage, no unexpected glory at the bottom
The n-pear with the worst reputation can find the least goods, but the picture is very popular If you don't let it out, it's too strong~
Roughly speaking, if you want to rank top, the word of mouth must not be too bad, at least keep at the average level and above!
⑥ star / price scatter chart of different businesses
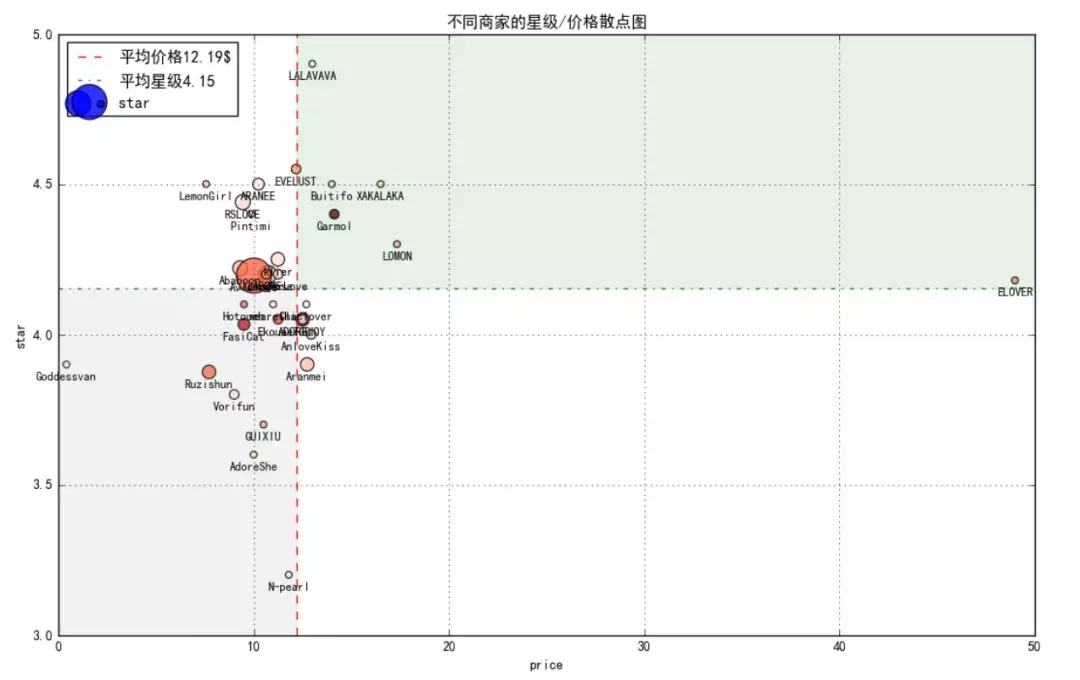
The x-axis is the average price of goods of the merchants, the y-axis is the star level of the merchants, and the point size is the quantity of goods. The larger the quantity of goods, the larger the point, and the point color is the average value of comments. The larger the average value of comments, the darker the color is.
The graph is divided into four quadrants by using the mean value of price and star level
(1) upper left quadrant: merchants with favorable benefits; (2) upper right quadrant: merchants a little expensive, but a penny for a penny for goods; (3) lower right quadrant: Merchants expensive, but not of good quality; (4) lower left quadrant: merchants who are cheap but not good
So with the help of this scatter chart, it's much easier to choose a business to buy:
-
In pursuit of cost performance, you can choose Avidlove, and there are many products, you can choose any (the light red business with the largest circle in the picture);
-
In pursuit of high-end, you can choose ELOVER, which has its own reason (the business on the left side of the picture and in the upper left quadrant);
-
To pursue the public, you can choose Garmol, with the most comments and most favorable comments (the reddest merchants in the picture)
Customers can choose the right business according to their preferences, so how to improve themselves as a business?
⑦ word frequency analysis
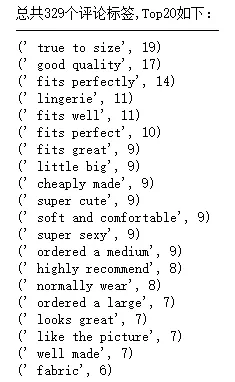
In the process of crawling, we also crawled the comment tag. Through word frequency analysis, we can find that customers are most concerned about:
1. Fit: size, fit and other related words appear for many times and rank first 2. Quality: good quality, well made; soft and comfortable, fabric are affirmation of material 3. Style: cut, sex, like the picture you know 4. Price: cheaply made, but more doubt about the quality of goods 5. Reputation: highly recommend ed Value tested
The number of comment tags is relatively small, and the frequency of 2.4w comments is further analyzed, and a word cloud is made:

Most intuitively, it is still related to "fit" and quality or style. Then we will continue to analyze the size & color of the products purchased by customers
There are several problems in size & color's word frequency data:
1. There are only about 6000 pieces of data. 2. Size & color can't be distinguished well. So we analyze 3. The naming rules of the merchants are different. For example, one of them will name black, and some of them may be style1 (so some strange numbers are actually the style numbers of the merchants). 4. Some strange words, such as trim, may be crawled wrong when they are crawlers or Exporting csv in a malformed format

It is obvious that:
Size: large, medium and small must be covered, but there are also xlarge, xxlarge and xxxlarge. Amazon is mainly European and American customers, which may be relatively large in size. Therefore, businesses should develop and stock more products for larger customers.
Color aspect: very intuitive: Black > Red > Blue > Green > White > purple... So black and red will never be wrong; green is unexpected to me, and businesses can also try boldly.
Style: the word "trim" and "lace" appear in the word frequency, and lace is the highest!!!

Complete code
Commodity review
1 # 0,Import module 2 from bs4 import BeautifulSoup 3 import requests 4 import random 5 import time 6 from multiprocessing import Pool 7 import csv 8 import pymongo 9 ''' 10 python Learning exchange group: 821460695 more learning materials can be obtained by adding groups 11 ''' 12 # 0,Create database 13 client = pymongo.MongoClient('localhost', 27017) 14 Amazon = client['Amazon'] 15 reviews_info_M = Amazon['reviews_info_M'] 16 17 # 0,Anti creeping measures 18 headers = { 19 'User-Agent':'Mozilla/5.0 (Windows NT 10.0; Win64; x64) AppleWebKit/537.36 (KHTML, like Gecko) Chrome/72.0.3626.109 Safari/537.36' 20 } 21 22 # http://cn-proxy.com/ 23 proxy_list = [ 24 'http://117.177.250.151:8081', 25 'http://111.85.219.250:3129', 26 'http://122.70.183.138:8118', 27 ] 28 proxy_ip = random.choice(proxy_list) # Random access agent ip 29 proxies = {'http': proxy_ip} 30 31 32 # 1,read csv Medium'Rank','item_name','reviews','reviews_link' 33 csv_file = csv.reader(open('C:/Users/zbd/Desktop/3.csv','r')) 34 reviews_datalst = [] 35 for i in csv_file: 36 reviews_data = { 37 'Rank':i[10], 38 'item_name':i[8], 39 'reviews':i[6], 40 'reviews_link':i[5] 41 } 42 reviews_datalst.append(reviews_data) 43 del reviews_datalst[0] # Delete header 44 #print(reviews_datalst) 45 reviews_links = list(i['reviews_link'] for i in reviews_datalst) # Store comment details page link to list reviews_links 46 47 # Clean reviews,There is a null value or "1",234"style 48 reviews = [] 49 for i in reviews_datalst: 50 if i['reviews']: 51 reviews.append(int(i['reviews'].replace(',',''))) 52 else: 53 reviews.append(0) 54 print(reviews_links) 55 print(reviews) 56 57 # 2,Grab comment page links for each item 58 # Commodity 1 59 # First pages: https://www.amazon.com/Avidlove-Lingerie-Babydoll-Sleepwear-Chemise/product-reviews/B0712188H2/ref=cm_cr_dp_d_show_all_btm?ie=UTF8&reviewerType=all_reviews 60 # Second pages: https://www.amazon.com/Avidlove-Lingerie-Babydoll-Sleepwear-Chemise/product-reviews/B0712188H2/ref=cm_cr_arp_d_paging_btm_next_2?ie=UTF8&reviewerType=all_reviews&pageNumber=2 61 # Third pages: https://www.amazon.com/Avidlove-Lingerie-Babydoll-Sleepwear-Chemise/product-reviews/B0712188H2/ref=cm_cr_getr_d_paging_btm_next_3?ie=UTF8&reviewerType=all_reviews&pageNumber=3 62 # Commodity 2 63 # First pages: https://www.amazon.com/Avidlove-Women-Lingerie-Babydoll-Bodysuit/product-reviews/B077CLFWVN/ref=cm_cr_dp_d_show_all_btm?ie=UTF8&reviewerType=all_reviews' 64 # Second pages: https://www.amazon.com/Avidlove-Women-Lingerie-Babydoll-Bodysuit/product-reviews/B077CLFWVN/ref=cm_cr_arp_d_paging_btm_next_2?ie=UTF8&reviewerType=all_reviews&pageNumber=2 65 # Eight comments per page, pages = reviews // 8 + 1 66 # Target format: https://www.amazon.com/Avidlove-Lingerie-Babydoll-Sleepwear-Chemise/product-reviews/B0712188H2/pageNumber=1 67 url = 'https://www.amazon.com/Avidlove-Lingerie-Babydoll-Sleepwear-Chemise/product-reviews/B0712188H2/ref=cm_cr_dp_d_show_all_btm?ie=UTF8&reviewerType=all_reviews' 68 counts = 0 69 def get_item_reviews(reviews_link,reviews): 70 if reviews_link: 71 pages = reviews // 8 # Eight comments per page, pages = reviews // 8. Do not crawl the last page 72 for i in range(1,pages+1): 73 full_url = reviews_link.split('ref=')[0] + '?pageNumber={}'.format(i) 74 #full_url = 'https://www.amazon.com/Avidlove-Lingerie-Babydoll-Sleepwear-Chemise/product-reviews/B0712188H2/?pageNumber=10' 75 wb_data = requests.get(full_url, headers=headers, proxies=proxies) 76 soup = BeautifulSoup(wb_data.text, 'lxml') 77 every_page_reviews_num = len(soup.select('div.a-row.a-spacing-small.review-data > span')) 78 for j in range(every_page_reviews_num): 79 reviews_info ={ 80 'customer_name' : soup.select('div:nth-child(1) > a > div.a-profile-content > span')[j].text, 81 'star' : soup.select('div.a-row>a.a-link-normal > i > span')[j].text.split('out')[0], 82 'review_date' : soup.select('div.a-section.review >div>div> span.a-size-base.a-color-secondary.review-date')[j].text, 83 'review_title' : soup.select('a.a-size-base.a-link-normal.review-title.a-color-base.a-text-bold')[j].text, 84 'review_text' : soup.select('div.a-row.a-spacing-small.review-data > span')[j].text, 85 'item_name' : soup.title.text.split(':')[-1] 86 } 87 yield reviews_info 88 reviews_info_M.insert_one(reviews_info) 89 global counts 90 counts +=1 91 print('The first{}Article comment'.format(counts),reviews_info) 92 else: 93 pass 94 95 ''' 96 # This is mainly for size and color crawling. Because there is a large number of missing data, it crawls in addition 97 # Basically the same as the code in the previous step, it is mainly to confirm the number of size & color comments per page 98 # Writing to database and csv also need to be modified, but in the same way 99 100 def get_item_reviews(reviews_link,reviews): 101 if reviews_link: 102 pages = reviews // 8 ා there are 8 comments on each page, pages = reviews // 8. The last page is not crawled. You need to make a judgment of less than 8 comments 103 for i in range(1,pages+1): 104 full_url = reviews_link.split('ref=')[0] + '?pageNumber={}'.format(i) 105 #full_url = 'https://www.amazon.com/Avidlove-Lingerie-Babydoll-Sleepwear-Chemise/product-reviews/B0712188H2/?pageNumber=10' 106 wb_data = requests.get(full_url, headers=headers, proxies=proxies) 107 soup = BeautifulSoup(wb_data.text, 'lxml') 108 every_page_reviews_num = len(soup.select('div.a-row.a-spacing-mini.review-data.review-format-strip > a')) # Number of size & color per page 109 for j in range(every_page_reviews_num): 110 reviews_info ={ 111 'item_name' : soup.title.text.split(':')[-1], 112 'size_color' : soup.select('div.a-row.a-spacing-mini.review-data.review-format-strip > a')[j].text, 113 } 114 yield reviews_info 115 print(reviews_info) 116 reviews_size_color.insert_one(reviews_info) 117 else: 118 pass 119 ''' 120 121 122 # 3,Start crawling and storing data 123 all_reviews = [] 124 def get_all_reviews(reviews_links,reviews): 125 for i in range(100): 126 for n in get_item_reviews(reviews_links[i],reviews[i]): 127 all_reviews.append(n) 128 129 get_all_reviews(reviews_links,reviews) 130 #print(all_reviews) 131 132 133 # 4,Write in csv 134 headers = ['_id','item_name', 'customer_name', 'star', 'review_date', 'review_title', 'review_text'] 135 with open('C:/Users/zbd/Desktop/4.csv','w',newline='',encoding='utf-8') as f: 136 f_csv = csv.DictWriter(f, headers) 137 f_csv.writeheader() 138 f_csv.writerows(all_reviews) 139 print('Finished writing!')
Commodity information
1 # 0,Import module 2 from bs4 import BeautifulSoup 3 import requests 4 import random 5 import time 6 from multiprocessing import Pool 7 import pymongo 8 ''' 9 python Learning exchange group: 821460695 more learning materials can be obtained by adding groups 10 ''' 11 # 0,Create database 12 client = pymongo.MongoClient('localhost', 27017) 13 Amazon = client['Amazon'] 14 item_info_M = Amazon['item_info_M'] 15 16 # 0,Anti creeping measures 17 headers = { 18 'User-Agent':'Mozilla/5.0 (Windows NT 10.0; Win64; x64) AppleWebKit/537.36 (KHTML, like Gecko) Chrome/72.0.3626.109 Safari/537.36' 19 } 20 # http://cn-proxy.com/ 21 proxy_list = [ 22 'http://117.177.250.151:8081', 23 'http://111.85.219.250:3129', 24 'http://122.70.183.138:8118', 25 ] 26 proxy_ip = random.choice(proxy_list) # Random access agent ip 27 proxies = {'http': proxy_ip} 28 29 # 1,Link to product ranking and details page 30 url_page1 = 'https://www.amazon.com/Best-Sellers-Womens-Chemises-Negligees/zgbs/fashion/1044968/ref=zg_bs_pg_1?_encoding=UTF8&pg=1' # 01-50 Famous commodity 31 url_page2 = 'https://www.amazon.com/Best-Sellers-Womens-Chemises-Negligees/zgbs/fashion/1044968/ref=zg_bs_pg_2?_encoding=UTF8&pg=2' # 51-100 Famous commodity 32 33 item_info = [] # List of store item details 34 item_links = [] # Store list of product detail page links 35 def get_item_info(url): 36 wb_data = requests.get(url,headers=headers,proxies=proxies) 37 soup = BeautifulSoup(wb_data.text,'lxml') 38 for i in range(50): 39 data = { 40 'Rank': soup.select('span.zg-badge-text')[i].text.strip('#'), 41 'item_name' : soup.select('#zg-ordered-list > li > span > div > span > a > div')[i].text.strip(), 42 'item_link' : 'https://www.amazon.com' + soup.select('#zg-ordered-list > li > span > div > span > a')[i].get('href'), 43 'img_src' :soup.select('#zg-ordered-list > li> span > div > span > a > span > div > img')[i].get('src') 44 } 45 item_info.append(data) 46 item_links.append(data['item_link']) 47 print('finish!') 48 49 get_item_info(url_page1) 50 get_item_info(url_page2) 51 52 53 54 # 2,Crawl more product information on the product details page 55 #item_url = 'https://www.amazon.com/Avidlove-Lingerie-Babydoll-Sleepwear-Chemise/dp/B0712188H2/ref=zg_bs_1044968_1?_encoding=UTF8&refRID=MYWGH1W2P3HNS58R4WES' 56 def get_item_info_2(item_url,data): 57 wb_data = requests.get(item_url, headers=headers, proxies=proxies) 58 soup = BeautifulSoup(wb_data.text, 'lxml') 59 60 #Obtain price(Need to judge) 61 price = soup.select('#priceblock_ourprice') 62 data['price'] = price[0].text if price else None 63 64 # Obtain star and reviews(Need to judge) 65 star = soup.select('div>div>span>span>span>a>i>span.a-icon-alt') 66 if star: 67 data['star'] = star[0].text.split(' ')[0] 68 data['reviews'] = soup.select('#reviews-medley-footer > div.a-row.a-spacing-large > a')[0].text.split(' ')[2] 69 data['Read reviews that mention'] = list(i.text.strip('\n').strip() for i in soup.select('span.cr-lighthouse-term')) 70 else: 71 data['star'] = None 72 data['reviews'] = None 73 data['Read reviews that mention'] = None 74 75 data['Date_first_listed_on_Amazon'] = soup.select('#detailBullets_feature_div > ul > li> span > span:nth-child(2)')[-1].text 76 77 # Obtain reviews_link(Need to judge) 78 reviews_link = soup.select('#reviews-medley-footer > div.a-row.a-spacing-large > a') 79 if reviews_link: 80 data['reviews_link'] = 'https://www.amazon.com' + reviews_link[0].get('href') 81 else: 82 data['reviews_link'] = None 83 84 # Obtain store and store_link (Need to judge) 85 store = soup.select('#bylineInfo') 86 if store: 87 data['store'] = store[0].text 88 data['store_link'] = 'https://www.amazon.com' + soup.select('#bylineInfo')[0].get('href') 89 else: 90 data['store'] = None 91 data['store_link'] = None 92 93 item_info_M.insert_one(data) # Deposit in MongoDB data base 94 print(data) 95 96 97 98 # 3,Write product details csv file 99 for i in range(100): 100 get_item_info_2(item_links[i],item_info[i]) 101 print('Write down{}A commodity'.format(i+1)) 102 103 import csv 104 headers = ['_id','store', 'price', 'Date_first_listed_on_Amazon', 'item_link', 'reviews_link', 'reviews', 'store_link', 'item_name', 'img_src', 'Rank', 'Read reviews that mention', 'star'] 105 with open('C:/Users/zbd/Desktop/3.csv','w',newline='',encoding='utf-8') as f: 106 f_csv = csv.DictWriter(f,headers) 107 f_csv.writeheader() 108 f_csv.writerows(item_info) 109 110 print('Finished writing!') 111 Word cloud 112 113 114 115 path = 'C:/Users/zbd/Desktop/Amazon/fenci/' 116 117 # Read file, participle 118 def get_text(): 119 f = open(path+'reviews.txt','r',encoding = 'utf-8') 120 text = f.read().lower() # Unified to lowercase 121 for i in '!@#$%^&*()_¯+-;:`~\'"<>=./?,': # Replace English symbols with spaces 122 text = text.replace(i,'') 123 return text.split() # Return word segmentation result 124 125 lst_1= get_text() # participle 126 print('All in all{}Word'.format(len(lst_1))) # Count total words 127 128 129 # Remove stop_word(Common words) 130 131 stop_word_text = open(path+'stop_word.txt','r',encoding = 'utf-8') # Read downloaded stop_word surface 132 stop_word = stop_word_text.read().split() 133 stop_word_add = ['a','i','im','it Holmium','i Holmium','\\u0026','5 Holmium','reviewdate'] # You can continue to add in this list stop_word 134 stop_word_new = stop_word + stop_word_add 135 #print(stop_word_new) 136 lst_2 =list(word for word in lst_1 if word not in stop_word_new) 137 print('After removal, there are{}Word'.format(len(lst_2))) 138 139 # Statistical word frequency 140 counts = {} 141 for i in lst_2: 142 counts[i] = counts.get(i,0) + 1 143 #print(counts) 144 145 word_counts = list(counts.items()) 146 #print(word_counts) 147 148 word_counts.sort(key = lambda x:x[1],reverse = True) # In descending order of word frequency 149 150 # Output result 151 for i in word_counts[0:50]: 152 print(i) 153 154 155 156 157 # Making word clouds 158 from scipy.misc import imread 159 import matplotlib.pyplot as plt 160 import jieba 161 from wordcloud import WordCloud, ImageColorGenerator 162 163 164 stopwords = {} 165 # isCN = 0 # 0: English participle 1: Chinese participle 166 path = 'C:/Users/zbd/Desktop/Amazon/fenci/' 167 back_coloring_path = path + 'img.jpg' # Set background picture path 168 text_path = path + 'reviews.txt' # Set the text path to analyze 169 stopwords_path = path + 'stop_word.txt' # stop list 170 imgname1 = path + 'WordCloudDefautColors.png' # Saved picture name 1(Only follow the shape of background picture) 171 imgname2 = path + 'WordCloudColorsByImg.png' # Saved picture name 2(Color is generated according to the color layout of background picture) 172 #font_path = r'./fonts\simkai.ttf' # Set Chinese font path for matplotlib - mainly for Chinese 173 174 175 back_coloring = imread(back_coloring_path) # Set background picture ---- back_coloring Is a 3-dimensional array 176 177 wc = WordCloud(#font_path = font_path # Set font 178 background_color = 'white', # Set background color 179 max_words = 3000, # Set the maximum number of words displayed 180 mask = back_coloring, # Set background picture 181 max_font_size = 200, # Set font maximum 182 min_font_size = 5, # Set font minimum 183 random_state = 42, # Random N Color schemes 184 width = 1000 , height = 860 ,margin = 2 # Set the default size of the picture, but if you use a background picture 185 # The size of the saved image will be saved according to its size, margin Is the word edge distance 186 ) 187 188 #wc.generate(text) 189 words = {} 190 for i in word_counts: 191 words['{}'.format(i[0])] = i[1] 192 193 wc.generate_from_frequencies(words) 194 # txt_freq Example is { word1: fre1, word2: fre2, word3: fre3,......, wordn: fren } 195 196 197 plt.figure() 198 199 200 # The following code only shows--------Word cloud whose shape is consistent with the background picture and whose color is the default color 201 plt.imshow(wc) 202 plt.axis("off") 203 plt.show() # Draw word clouds 204 wc.to_file(imgname1) # Save pictures 205 206 207 208 209 # The following code shows--------Word cloud with the same shape and color as the background image 210 image_colors = ImageColorGenerator(back_coloring) # Generate color values from background pictures 211 plt.imshow(wc.recolor(color_func=image_colors)) 212 plt.axis("off") 213 plt.show() 214 wc.to_file( imgname2) 215 216 217 218 219 # Show original picture 220 plt.figure() 221 plt.imshow(back_coloring, cmap=plt.cm.gray) 222 plt.axis("off") 223 plt.show() # Save pictures
Data analysis
1 import pandas as pd 2 import numpy as np 3 import matplotlib.pyplot as plt 4 import matplotlib.colors 5 ''' 6 python Learning exchange group: 821460695 more learning materials can be obtained by adding groups 7 ''' 8 get_ipython().magic('matplotlib inline') 9 10 11 # 0,data fetch 12 13 item_info = pd.read_csv('C:/Users/zbd/Desktop/Amazon/item_info.csv', engine = 'python') 14 reviews_new = pd.read_csv('C:/Users/zbd/Desktop/Amazon/reviews_new.csv', engine = 'python') 15 print(item_info.head()) 16 print(len(item_info)) 17 #print(reviews_new.head()) 18 19 20 21 # 1,Cleaning data 22 # Filter out required columns 23 item_info_c = item_info[['Rank','item_name','store','price','Date_first_listed_on_Amazon','star','reviews','Read reviews that mention']] 24 25 # Cleaning column: price 26 item_info_c['price'] = item_info_c['price'].str.replace('$','') 27 item_info_c['min_price'] = item_info_c['price'].str.split('-').str[0].astype('float') 28 item_info_c['max_price'] = item_info_c['price'].str.split('-').str[-1].astype('float') 29 item_info_c['mean_price'] = (item_info_c['max_price']+item_info_c['min_price'])/2 30 31 # Clean NaN value 32 def f_na(data,cols): 33 for i in cols: 34 data[i].fillna(data[i].mean(),inplace = True) 35 return data 36 37 item_info_c = f_na(item_info_c,['star','reviews','min_price','max_price','mean_price']) 38 item_info_c.head(5) 39 40 41 42 43 # 2,Data processing with merchant dimension 44 a = item_info_c.groupby('store')['star'].mean().sort_values(ascending=False) # Average star rating of merchants 45 b = item_info_c.groupby('store')['reviews'].agg({'reviews_sum':np.sum,'reviews_mean':np.mean}) # Total and average number of business reviews 46 c = item_info_c.groupby('store')['min_price'].mean() # Mean value of lowest price 47 d = item_info_c.groupby('store')['max_price'].mean() # Average value of the highest price 48 e = item_info_c.groupby('store')['mean_price'].mean() # Average price of merchants 49 e.name = 'price_mean' 50 f = item_info_c.groupby('store')['star'].count() # Quantity of goods 51 f.name = 'item_num' 52 #print(a,b,c,d,e,f) 53 54 df = pd.concat([a,b,e,f],axis=1) # Percentage of merchandise 55 df['per'] = df['item_num']/100 56 df['per%'] = df['per'].apply(lambda x: '%.2f%%' % (x*100)) 57 58 # Standardized treatment 59 def data_nor(df, *cols): 60 for col in cols: 61 colname = col + '_nor' 62 df[colname] = (df[col]-df[col].min())/(df[col].max()-df[col].min()) * 10 63 return df 64 # Create function, return standardized value, new column name 65 66 df_re = data_nor(df, 'star','reviews_mean','price_mean','item_num') 67 print(df_re.head(5)) 68 69 70 71 72 # 3,Drawing charts 73 74 fig,axes = plt.subplots(4,1,figsize = (10,15)) 75 plt.subplots_adjust(wspace =0, hspace =0.5) 76 77 # Star ranking of different businesses 78 df_star = df['star'].sort_values(ascending = False) 79 df_star.plot(kind = 'bar',color = 'yellow',grid = True,alpha = 0.5,ax =axes[0],width =0.7, 80 ylim = [3,5],title = 'Star ranking of different businesses') 81 axes[0].axhline(df_star.mean(),label = 'Average star level%.2f branch' %df_star.mean() ,color = 'r' ,linestyle = '--',) 82 axes[0].legend(loc = 1) 83 84 # Ranking of average comments of different businesses 85 df_reviews_mean = df['reviews_mean'].sort_values(ascending = False) 86 df_reviews_mean.plot(kind = 'bar',color = 'blue',grid = True,alpha = 0.5,ax =axes[1],width =0.7, 87 title = 'Ranking of average comments of different businesses') 88 axes[1].axhline(df_reviews_mean.mean(),label = 'Average comments%i strip' %df_reviews_mean.mean() ,color = 'r' ,linestyle = '--',) 89 axes[1].legend(loc = 1) 90 91 # Price range of different merchants (by average price) 92 avg_price = (d-c)/2 93 avg_price.name = 'avg_price' 94 max_price = avg_price.copy() 95 max_price.name = 'max_price' 96 97 df_price = pd.concat([c,avg_price,max_price,df_re['price_mean']],axis=1) 98 df_price = df_price.sort_values(['price_mean'],ascending = False) 99 df_price.drop(['price_mean'],axis =1,inplace = True) 100 df_price.plot(kind = 'bar',grid = True,alpha = 0.5 , ax =axes[2],width =0.7,stacked = True, 101 color= ['white','red','blue'],ylim = [0,55],title = 'Price range of different businesses') 102 103 # Weighted ranking of different businesses 104 df_nor = pd.concat([df_re['star_nor'],df_re['reviews_mean_nor'],df_re['price_mean_nor'],df_re['item_num_nor']],axis =1) 105 df_nor['nor_total'] = df_re['star_nor'] + df_re['reviews_mean_nor'] + df_re['price_mean_nor'] + df_re['item_num_nor'] 106 df_nor = df_nor.sort_values(['nor_total'],ascending = False) 107 df_nor.drop(['nor_total'],axis = 1,inplace = True) 108 df_nor.plot(kind = 'bar',grid = True,alpha = 0.5 , ax =axes[3],width =0.7,stacked = True, 109 title = 'Weighted ranking of different businesses') 110 111 112 113 114 # Number of merchants pie chart 115 colors = ['aliceblue','antiquewhite','beige','bisque','blanchedalmond','blue','blueviolet','brown','burlywood', 116 'cadetblue','chartreuse','chocolate','coral','cornflowerblue','cornsilk','crimson','cyan','darkblue','darkcyan','darkgoldenrod', 117 'darkgreen','darkkhaki','darkviolet','deeppink','deepskyblue','dimgray','dodgerblue','firebrick','floralwhite','forestgreen', 118 'gainsboro','ghostwhite','gold','goldenrod'] 119 120 df_per = df_re['item_num'] 121 fig,axes = plt.subplots(1,1,figsize = (8,8)) 122 plt.axis('equal') #Ensure equal length and width 123 plt.pie(df_per , 124 labels = df_per.index , 125 autopct = '%.2f%%', 126 pctdistance = 1.05 , 127 #shadow = True , 128 startangle = 0 , 129 radius = 1.5 , 130 colors = colors, 131 frame = False 132 ) 133 134 135 136 # Stars of different businesses/Price scatter 137 plt.figure(figsize=(13,8)) 138 x = df_re['price_mean'] # x Axis is average price. 139 y = df_re['star'] # y The axis is star. 140 s = df_re['item_num']*100 # Point size is the quantity of goods. The larger the quantity of goods is, the larger the point is 141 c = df_re['reviews_mean']*10 # The point color is the comment mean value. The larger the comment mean value is, the darker the color is 142 plt.scatter(x,y,marker='.',cmap='Reds',alpha=0.8, 143 s = s,c = c) 144 plt.grid() 145 plt.title('Stars of different businesses/Price scatter') 146 plt.xlim([0,50]) 147 plt.ylim([3,5]) 148 plt.xlabel('price') 149 plt.ylabel('star') 150 151 # Draw average line and legend 152 p_mean = df_re['price_mean'].mean() 153 s_mean = df_re['star'].mean() 154 plt.axvline(p_mean,label = 'average price%.2f$' %p_mean ,color = 'r' ,linestyle = '--',) 155 plt.axhline(s_mean,label = 'Average star level%.2f' %s_mean ,color = 'g' ,linestyle = '-.') 156 plt.axvspan(p_mean, 50, ymin= (s_mean-3)/(5-3), ymax=1,alpha = 0.1,color = 'g') 157 plt.axhspan(0, s_mean, xmin= 0 , xmax=p_mean/50,alpha = 0.1,color = 'grey') 158 plt.legend(loc = 2) 159 160 # Add merchant tag 161 for x,y,name in zip(df_re['price_mean'],df_re['star'],df_re.index): 162 plt.annotate(name, xy=(x,y),xytext = (0, -5), textcoords = 'offset points',ha = 'center', va = 'top',fontsize = 9) 163 164 165 166 167 # Cleaning column: Read reviews that mention 168 df_rrtm = item_info_c['Read reviews that mention'].fillna('missing data',inplace =False) 169 df_rrtm = df_rrtm.str.strip('[') 170 df_rrtm = df_rrtm.str.rstrip(']') 171 df_rrtm = df_rrtm.str.replace('\'','') 172 173 reviews_labels = [] 174 for i in df_rrtm: 175 reviews_labels = reviews_labels+i.split(',') 176 #print(reviews_labels) 177 178 179 labels = [] 180 for j in reviews_labels: 181 if j != 'missing data': 182 labels.append(j) 183 #print(labels) 184 185 186 187 # Statistics label word frequency 188 counts = {} 189 for i in labels: 190 counts[i] = counts.get(i,0) + 1 191 #print(counts) 192 193 label_counts = list(counts.items()) 194 #print(word_counts) 195 196 label_counts.sort(key = lambda x:x[1],reverse = True) # In descending order of word frequency 197 198 print('In total%i Comment tags,Top20 As follows:'%len(label_counts)) 199 print('-----------------------------') 200 # Output result 201 for i in label_counts[:20]: 202 print(i)