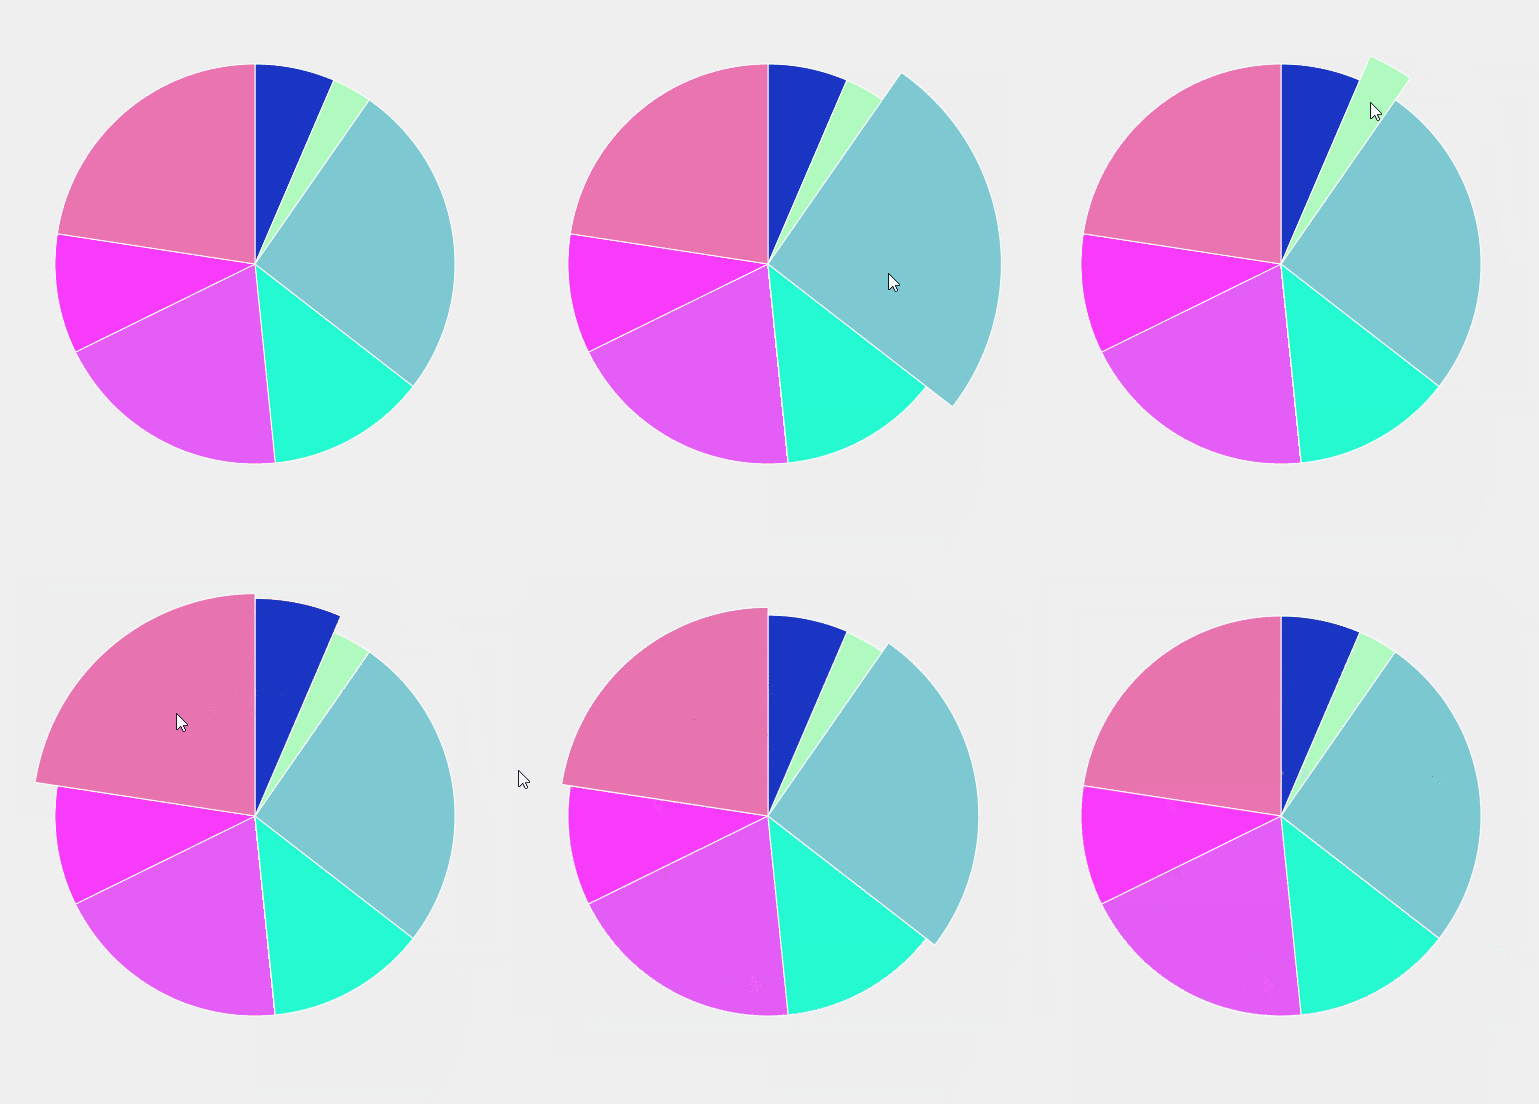
There are three steps:
- Fan shaped
- Draw a circle with a fan
- Animating
The following three steps are detailed
Fan shaped
As mentioned in the previous article, the command of drawing arc is also used in the previous article. If you don't know clearly, you can go to my previous article: path application of svg , let's briefly mention it here
-
First, you need to draw a straight line from the center of the circle to a coordinate with a long radius.
- In this step, we need to use a coordinate function. The first thing we need to solve is how to find coordinates. To find out the coordinates, we need to find them according to the angle. We need to know the center coordinates of the radius, give the angle, and find the coordinates.
                    function d2a(ang) {//Angular radian
                        return ang * Math.PI / 180;
                    }

                    function point(ang) {//Coordinate according to angle
                        return {
                            x: cx + r * Math.sin(d2a(ang)),
                            y: cy - r * Math.cos(d2a(ang))
                        }
                    }
- And then from the coordinates we get to, we call it the starting point, we call it the starting point, we call it the ending point.
- Finally, the closed path leads to a sector.
Draw a circle with a fan
After drawing the sector, we can draw as many arcs as there are data, and finally draw a circle.
We can sum the data to get a total data, and then we can transfer each data * 360 / total data = the angle occupied by this data, which can be passed to the above point function to get the coordinates, and then draw the sector, and then cycle each data to draw the sector corresponding to the angle, and finally draw a circle.
Animating
The principle of animation is that if we change the length of the sector radius r, the mouse moves in R longer and out R shorter. It's just that in the process of changing again, we are not in place in one step, but complete it in many steps, for example, from 150 to 200, the middle distance is 50, we walk 1 at a time, and keep walking. When we stop, we will have animation effect.
Complete code
<!DOCTYPE html>
<html lang="en">
<head>
    <meta charset="UTF-8">
    <meta name="viewport" content="width=device-width, initial-scale=1.0">
    <meta http-equiv="X-UA-Compatible" content="ie=edge">
    <title>Document</title>
    <script>
        window.onload = function () {
            let oSvg = document.getElementById('s1');

            let cx = 400, cy = 300, r = 200,  sum = 0;//Initial center radius
            let data = [140, 100, 110, 90, 170,125];//Data to draw a sector
            data.forEach(item => {//Find the sum of data
                sum += item;
            })
            let now = 0;
            data.forEach(item => {//Circle drawing
                let ang = 360 * item / sum;
                pie(now, now + ang);
                now += ang;
            })
            function pie(ang1, ang2) {
                let oPath = document.createElementNS('http://www.w3.org/2000/svg', 'path');
                oPath.setAttribute('stroke', 'white');
                oPath.setAttribute('fill', `rgb(${Math.floor(Math.random() * 256)},${Math.floor(Math.random() * 256)},${Math.floor(Math.random() * 256)})`);
                oPath.setAttribute('stroke-width', 2);

                function calcD(r) {
                    function d2a(ang) {//Angular radian
                        return ang * Math.PI / 180;
                    }
                    function point(ang) {//Coordinate according to angle
                        return {
                            x: cx + r * Math.sin(d2a(ang)),
                            y: cy - r * Math.cos(d2a(ang))
                        }
                    }
                    //Three steps to draw a fan
                    let arr = [];
                    //First step
                    let { x: x1, y: y1 } = point(ang1);
                    arr.push(`M ${cx} ${cy} L ${x1} ${y1}`);//Draw the first line
                    //The second step
                    let { x: x2, y: y2 } = point(ang2);
                    arr.push(`A ${r} ${r} 0 ${ang2 - ang1 > 180 ? 1 : 0} 1 ${x2} ${y2}`);//Arc drawing
                    //The third step
                    arr.push('Z');//Close

                    oPath.setAttribute('d', arr.join(' '));//Splicing strings, executing drawing commands
                    oSvg.appendChild(oPath);//Add to svg
                }
                //animation
                calcD(r);
                let fnNext=null;
                let curR=r;
                let size=40;

                function move(end){
                    let start=curR//starting point
                    let dis=end-start;//How far is it to go?
                    let count=0;//Pace taking

                    fnNext=function(){
                        let a=1-count/size;//ratio
                        count++;//Step by step
                        curR=start+dis*(1-a*a*a);//Where to go now
                        calcD(curR);//Calculate and draw
                        if(count>=size){//Stop Animation if you get there
                            fnNext=null;
                        }
                    }
                }
                next();//Keep walking
                function next(){
                    fnNext&&fnNext();//If the fnNext function is reached, it will be null. Otherwise, continue.
                    requestAnimationFrame(next);
                }

                oPath.onmouseover = function () {
                    move(r * 1.2);//Move the mouse into the sector to enlarge
                }
                oPath.onmouseout = function () {
                    move(r);//Mouse out sector area recovery
                }
            }
        }
    </script>
</head>
<body>
    <svg id="s1" width=800 height=600></svg>
</body>
</html>