Tool link: Curve-Text-Detector/data at master · Yuliang-Liu/Curve-Text-Detector · GitHub
catalogue
3. Dataset label visualization
preface
The annotation methods and tools introduced this time are the curved text annotation methods and tools proposed by Liu Yuliang of South China University of technology in 2017 (original link: https://arxiv.org/abs/1712.02170 ), curved text can be marked. For specific data sets, see SCUT-CTW1500 proposed by the author of the paper.
Note: the following is the main content of this article, and the following is the summary of the experience of using the tool (the author of the paper also provides the tool user manual in the tool link)
1, Tool introduction
1. Label format
1) For rectangular or quadrilateral text area, it can be determined by using 4 vertices;
2) For curved text, the author found that it can be determined by using 14 points. The specific annotation method is shown in Figure 1. Firstly, four vertex positions (purple points) are determined, and then five points (green points) are determined on the upper and lower boundaries according to the auxiliary line, and the text content can be annotated for expansion into the text recognition data set. (for too curved text areas, the labeling effect is not used. It is recommended to label according to the word level to avoid too curved text areas)
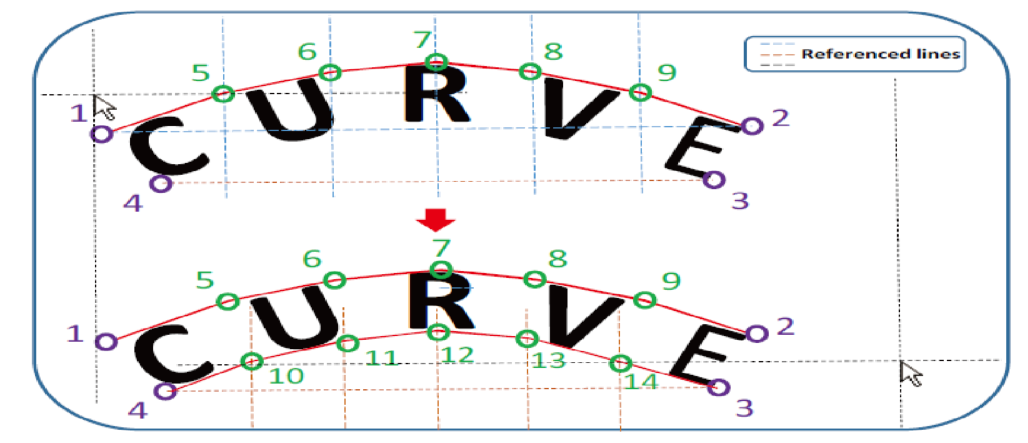
Figure 1 Labeling process
2. Use of tools
"b" and "f": move to the previous one and the next one respectively, and save the current status;
"r": switch the annotation mode (rectangle or polygon);
"D": first select the instance to be deleted in the instance column of the right text annotation box, and then press "d" to delete the instance;
Right click: save the current status and delete the current operation;
Left click: when labeling a rectangular area, first left click to determine the upper left corner, then drag the mouse to the lower right corner, and left click to determine the rectangular area; To determine the quadrilateral region, left click the mouse to determine four points in the quadrilateral region; The marking of curved text area is based on the marking of quadrilateral area, which needs the help of "k" and space;
"k" and space: it is mainly used to mark the curved text area. First determine the four vertex positions of the curved text (refer to the marking quadrilateral area), then "left click" the quadrilateral area just determined in the instance bar of the right text marking box, and then click "k" to display ten auxiliary lines (5 red and 5 Blue). Move the mouse, At the point where the horizontal line of the mouse intersects with the auxiliary line, if you click "space" at the appropriate position, you will determine a point, successively determine 5 points of the red auxiliary line, and then successively determine 5 points of the blue auxiliary line to complete the marking of the curved text;
Double left click: double left click an instance in the instance list on the right, and a box will appear in which text content can be filled to expand the annotation text identification data set. Click "Esc" to exit. Fill in the text content and click "Enter" to save and exit;
Mouse wheel: when zooming in and out of an image, you can combine Ctrl + wheel or Ctrl + Shift + wheel to speed up zooming in and out. When the label box is offset, it can be restored by switching pictures; (in the process of use, when labeling some zoomed out images, sometimes the label box will deviate. In this case, the original size of the image is labeled. This rarely happens. You can check the visual label box after all labeling work is completed.)
Scroll bar: when the image size is too large, a scroll bar will appear. You can move the canvas through the scroll bar;
"T": select an instance in the right instance bar and click "t" to help find the dimension box, but the prompt is not obvious and will not be used. Generally, the corresponding dimension box can be found by color.
The specific tool interface is shown in Figure 2:
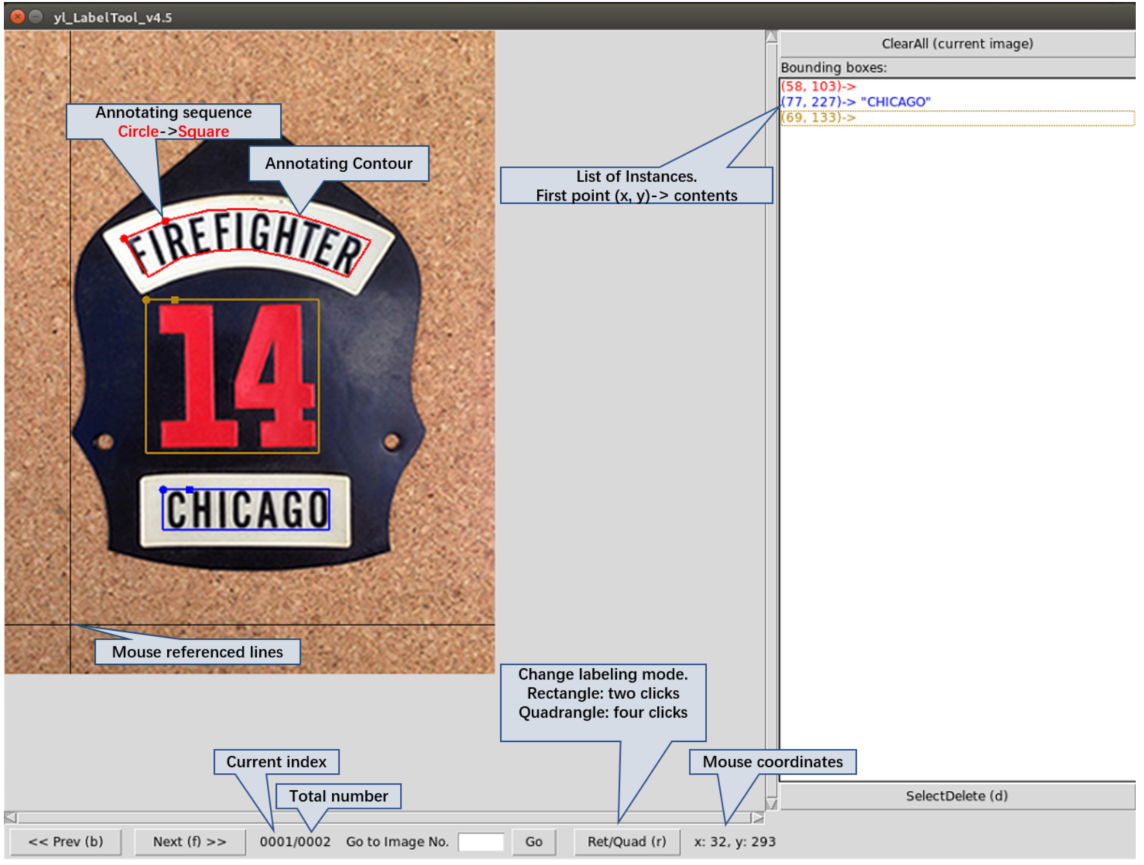
Figure 2 Annotation tool interface
2, To label
1. Data preparation
1) First, prepare the pictures to be labeled and rename them. At the same time, you can also disrupt the data set;
# Rename image
def change_name(root):
    # Read all images under the file path
    res = os.listdir(root)
    # Disrupt the list to prevent images of the same type from stacking together and can be randomly distributed
    random.shuffle(res)
    # Set up an index to name the file
    index = 1
    for i in res:
        # Change the name of jpg and png format pictures
        if ".jpg" in i or ".png" in i:
            os.rename(os.path.join(root, i), os.path.join(root, str(index) + '.' + i.split('.', 1)[1]))
            index += 1
        else:
            print('The picture you enter must be in jpg perhaps png Formatted')
2) It is recommended that all picture names have the same format and length. If you rename them from 1 and name them by numbers, it is recommended to fill in zero, because the tool reads them by string, so that the file order will be maintained;
# Add prefix 0 to file name
def add_zeros(root):
    res = os.listdir(root)
    # The unified length is 4 bits
    for i in res:
        if len(i.split('.', 1)[0]) == 1:
            os.rename(os.path.join(root, i), os.path.join(root, '000' + i))
        elif len(i.split('.', 1)[0]) == 2:
            os.rename(os.path.join(root, i), os.path.join(root, '00' + i))
        elif len(i.split('.', 1)[0]) == 3:
            os.rename(os.path.join(root, i), os.path.join(root, '0' + i))
3) Put the named picture in the image folder, and the marked txt will be generated in the label folder, and the name is consistent with the picture name.
2. Data annotation
1) Double click Run windows_label_tool.exe;
2) When you need to reach the last marked picture position, enter the serial number, and then click "go", as shown in Figure 3;

Figure 3 tool bottom
3) Reference the text area in the picture Tool use The operation in is enough. The operation diagram of quadrilateral and curved text area labeling is shown in Figure 4. The labeling of rectangular area is relatively simple, and a simple attempt will be made;
Figure 4 Annotation diagram
4) If you label the text detection data set, you do not need to fill in the text content. The label file is shown in Figure 5(a), and the text identification data set label is shown in Figure 5(b). In the first line, there is a text box number representing the number of text box instances, which can be used to count the total number of text instances marked in your data set (if not required, you can delete them after the labeling work is completed);

Figure 5 Schematic diagram of label
5) Special case description 1: if the curved text area is too curved, the effect on the left side of Figure 6 will be poor. It is recommended to mark it according to the word level to get the effect on the right side of Figure 7;

Figure 7 Comparison of marking effect of excessive curvature
6) When used under Windows, it is difficult to label the vertical curved text, the generated auxiliary line is relatively horizontal, and the movement cannot be subtle, resulting in the difficulty in determining the label box (whether this will happen under Ubuntu is not attempted). Two solutions are provided, as shown in Figure 8(a): extend the text area to make it have a certain slope, but reduce the fit of the area; Or Fig. 8(b), the vertices are uncertain in the four corners, which will not only affect the later training; You can try a better solution.
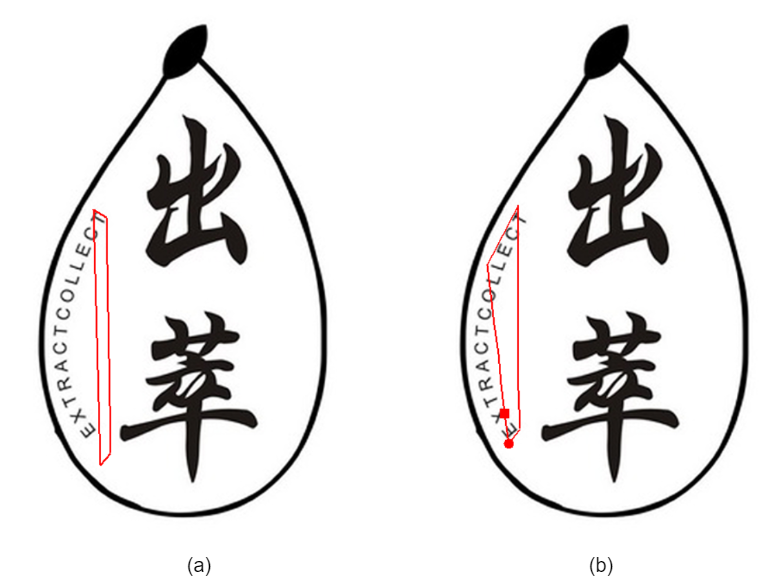 Figure 8 Schematic diagram of excessive bending dimension solution
3. Dataset label visualization
It is mainly to restore the marked text box to the original drawing and check whether the marked text box is accurate.
# Visually display the marked image
def visualize(image_root, gt_root, out_root, name):
    # Read out the image according to the path and file name. This example adopts jpg format
    image = cv2.imread(os.path.join(image_root, name+'.jpg'), 3)
    # Read the label file according to the path and file name, and the file format is txt
    gt_txt = open(os.path.join(gt_root, name+'.txt'))
    height, width, _ = image.shape
    lines = 0
    index = 0
    while 1:
        line = gt_txt.readline()
        if not line:
            break
        # Number of first line text boxes
        if lines == 0:
            lines = int(line)
            continue
        line = line.replace("\n", "")
        line = line.split(',')
        # print(line)
        now = np.empty(shape=[0, 1, 2])
        for i in range(0, len(line), 2):
            temp = np.empty(shape=[0, 2])
            temp = np.append(temp, [[line[i], line[i + 1]]], axis=0)
            now = np.append(now, [temp], axis=0)
        now = now.astype(np.int32)
        # Draw a polygon text box based on the coordinate points of the dimension file
        image = cv2.polylines(image, [now], True, (0, 0, 255), thickness=2)
        # cv2.imshow('image'+str(index), image)
        index = index + 1
    # Save the visual image to the output path
    cv2.imwrite(out_root + '\\' + name + '.jpg', image)
    print(name + '.jpg')
    cv2.waitKey(0)
    cv2.destroyAllWindows()
The effect is shown in Figure 9:
Figure 9 Dataset visualization diagram
summary
The above is an introduction to the experience of using the text detection dataset annotation tool. It mainly completes the annotation of the dataset by using the tools provided by the author of the paper. If you encounter better text annotation software, you can share and discuss it together.