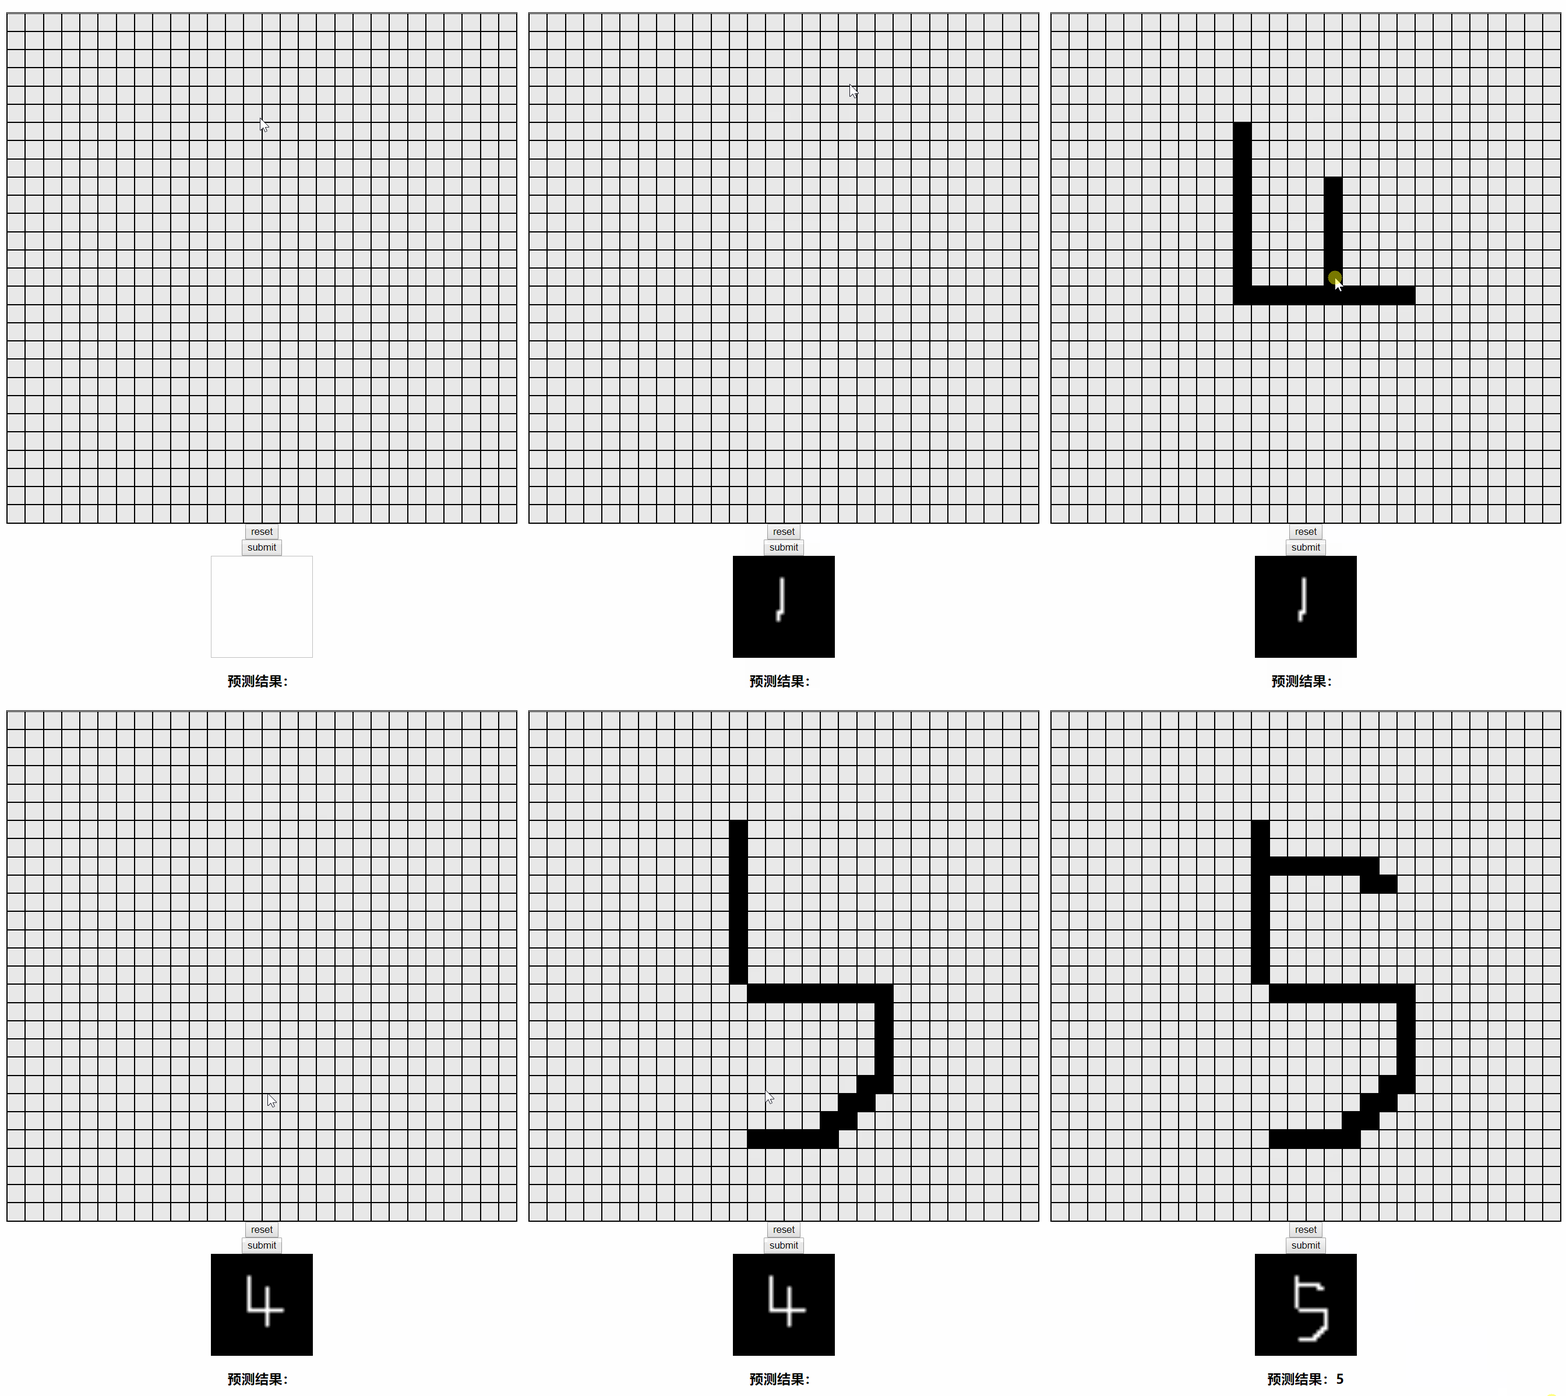
Effect

The web end loads the trained model, the simple model used this time, and then predicts the number and returns the result according to the image data transmitted from the front end
The saved png image is converted to base64 encoding and returned. In this way, the src with img tag can display the image directly in the front end, reducing the complexity of processing
from flask import Flask, jsonify, request, send_file, make_response
import json
from flask_cors import CORS
from flask_compress import Compress
from PIL import Image
import tensorflow as tf
import numpy as np
import base64

app = Flask(__name__)
Compress(app)
CORS(app)


@app.route('/send_img', methods=['post', 'get'])
def send_img():
    image = json.loads(request.values.get('img'))
    num = getnum(np.reshape(image, [1, 28 * 28]))
    data = np.reshape(image, [28, 28])
    # The elements in the matrix are all decimals of the pixel gray scale / 255, which needs to be multiplied by 255 to convert to gray scale value
    data = data * 255
    img = Image.fromarray(data.astype(np.uint8), 'L')
    # Save as picture
    img.save('img.png')
    with open('img.png', mode='rb') as f:
        s = base64.b64encode(f.read())
    return jsonify({
        'msg': str(num),
        'img': bytes.decode(s)
    })


# Define two placeholder s
x = tf.placeholder(tf.float32, [None, 784])
y = tf.placeholder(tf.float32, [None, 10])

# Simple neural network
w = tf.Variable(tf.zeros([784, 10]))
b = tf.Variable(tf.zeros([10]))
prediction = tf.nn.softmax(tf.matmul(x, w) + b)
loss = tf.reduce_mean(tf.nn.softmax_cross_entropy_with_logits(labels=y, logits=prediction))
train = tf.train.AdamOptimizer(0.001).minimize(loss)
init = tf.global_variables_initializer()
correct_predict = tf.equal(tf.argmax(y, 1), tf.argmax(prediction, 1))
saver = tf.train.Saver()
sess = tf.Session()
sess.run(init)
saver.restore(sess, 'net/my_net.ckpt')


def getnum(data):
    return sess.run(tf.argmax(prediction, 1), feed_dict={x: data})[0]


app.run(port=8888, debug='disable', host='0.0.0.0', threaded=True)
Front end
Use grid layout to set grid
When you click the mouse, you can change the state of the moving lattice. After drawing the graph, you can transfer the data to the back-end. After the back-end processing, you can return the object in json format. num represents the prediction result. img is the base64 code of the picture. Set the code to the img label to display
<template>
  <div class="main" @mouseup.prevent="isDraw=false" @mousedown.prevent="isDraw=true">
    <div class="grid">
      <div :class="img[i-1]==1?'cell_black':'cell_gray'" v-for="i in 28*28" @mouseover="isDraw && draw(i)"></div>
    </div>
    <button @click="reset">reset</button>
    <button @click="submit">submit</button>
    <img class="num" ref="img">
    <h3>Forecast results:{{num}}</h3>
  </div>
</template>

<script>
  import * as app from '../api'

  export default {
    name: "draw",
    data() {
      return {
        isDraw: false,
        img: Array(28 * 28).fill(0),
        num: '',
      }
    },
    methods: {
      draw(i) {
        // console.log(i)
        this.$set(this.img, i - 1, 0 + !this.img[i - 1])
      },
      async submit() {
        // console.log(this.img)
        let resp = await app.submit(this.img)
        // console.log(num)
        this.num = resp.msg
        this.$refs.img.src = `data:image/png;base64,${resp.img}`
      },
      reset() {
        this.img = Array(28 * 28).fill(0)
        this.num = ''
      }
    }
  }
</script>

<style scoped>
  .main {
    width: 100vw;
    height: 100vh;
    display: flex;
    flex-direction: column;
    justify-content: center;
    align-items: center;
  }

  .grid {
    display: grid;
    grid-template-columns: repeat(28, 1fr);
    width: 700px;
    height: 700px;
    border: 1px solid black;
  }

  .cell_gray {
    border: 1px solid black;
    background: rgb(233, 233, 233);
  }

  .cell_black {
    border: 1px solid black;
    background: black;

  }

  .num {
    width: 140px;
    height: 140px;

  }
</style>