problem
SQL Server is deployed on multiple platforms (Windows,Linux and Container) in many enterprises. A solution that can support multiple platforms is needed to collect and display related monitoring indicators.
I choose the popular monitoring display tool Grafana and monitoring indicator collection tool Telegraf to implement. This is also to facilitate the integration and docking with the existing monitoring platform in the enterprise.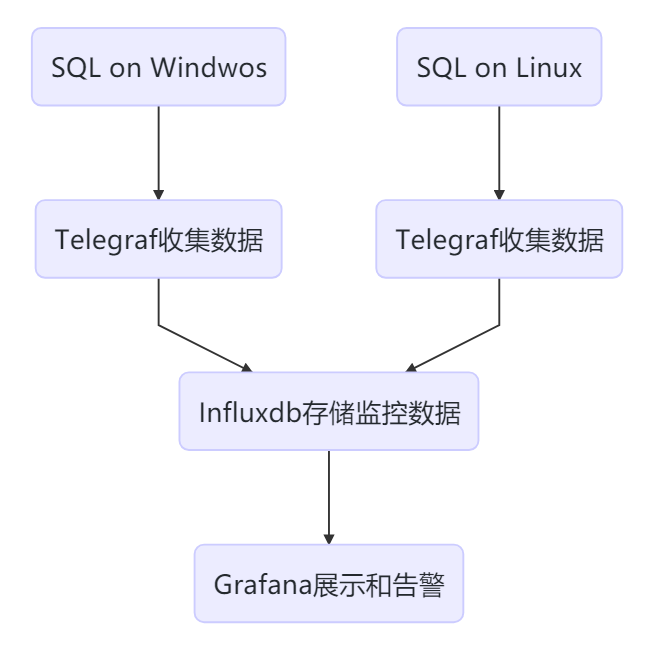
As shown in the above figure, Telegraf is deployed in the host where SQL is located, collects data and sends it to the temporal database, Influxdb for storage, and then Grafana is used to display the data.
Solution
-
Install and configure InfluxDB
I install InfluxDB and Grafana on the same CentOS host, preferably separately in the production environment.
# Download the stable version of 1.8 and install it
wget https://dl.influxdata.com/influxdb/releases/influxdb-1.8.0.x86_64.rpm
chmod 755 influxdb-1.8.0.x86_64.rpm
yum localinstall influxdb-1.8.0.x86_64.rpm

# Start and set self start
systemctl start influxdb
systemctl enable influxdb

# 8086 is used for HTTP connection of client and 8088 is used for CLI to call RPC for backup and restore operation
firewall-cmd --zone=public --add-port=8086/tcp --permanent
firewall-cmd --zone=public --add-port=8088/tcp --permanent
firewall-cmd --reload

# Connect to influxdb and create users
fluxdb
> CREATE USER admin WITH PASSWORD '<password>' WITH ALL PRIVILEGES

# Enable http user authentication, modify influxdb.conf Auth enabled = true in http section
vim /etc/influxdb/influxdb.conf
systemctl restart influxdb

# Create a database to store monitoring data and keep the data for 6 months
influx -username 'admin' -password '<password>'
> CREATE DATABASE telegraf
> CREATE RETENTION POLICY telegraf_6m ON telegraf DURATION 180d REPLICATION 1 DEFAULT
> SHOW DATABASES
-
Installing and configuring Grafana
# Download and install Grafana
wget https://dl.grafana.com/oss/release/grafana-7.0.1-1.x86_64.rpm
chmod 775 grafana-7.0.1-1.x86_64.rpm
yum localinstall grafana-7.0.1-1.x86_64.rpm

# Set self start
systemctl start grafana-server.service
systemctl enable grafana-server.service

# Allow Grafana's default port 3000
firewall-cmd --zone=public --add-port=3000/tcp --permanent
firewall-cmd --reload
Then visit http://:3000 in the Browser. When you first visit, the default login account and password are admin. You will be prompted to change the password after login.
-
Installing and configuring Telegraf on client hosts
The so-called client is the host of SQL
To connect to SQL, Telegraf requires a login with VIEW SERVER STATE and VIEW ANY DEFINITION permission, so it needs to be created on each monitored instance.
USE master;
GO
CREATE LOGIN [telegraf] WITH PASSWORD = N'1qaz@WSX';
GO
GRANT VIEW SERVER STATE TO [telegraf];
GO
GRANT VIEW ANY DEFINITION TO [telegraf];
GO
-
Telegraf on Linux
wget https://dl.influxdata.com/telegraf/releases/telegraf-1.14.3-1.x86_64.rpm
sudo yum localinstall telegraf-1.14.3-1.x86_64.rpm
After installation, modify the configuration file of Telegraf before starting. In the configuration file, there are two parts: input and output. Input indicates where the monitoring data comes from, and output indicates where the monitoring data is to be sent.
Open / etc/telegraf/telegraf.conf , found[[ outputs.influxdb ]]Section, all configuration items are annotated by default. We need to remove comments and configure some items. It is mainly the address, user name, password and database name of the Influxdb.
[[outputs.influxdb]]
  ## The full HTTP or UDP URL for your InfluxDB instance.
  ##
  ## Multiple URLs can be specified for a single cluster, only ONE of the
  ## urls will be written to each interval.
  # urls = ["unix:///var/run/influxdb.sock"]
  # urls = ["udp://127.0.0.1:8089"]
  urls = ["http://172.17.2.4:8086"]

  ## The target database for metrics; will be created as needed.
  ## For UDP url endpoint database needs to be configured on server side.
  database = "telegraf"

  ## The value of this tag will be used to determine the database.  If this
  ## tag is not set the 'database' option is used as the default.
  # database_tag = ""

  ## If true, the 'database_tag' will not be included in the written metric.
  # exclude_database_tag = false

  ## If true, no CREATE DATABASE queries will be sent.  Set to true when using
  ## Telegraf with a user without permissions to create databases or when the
  ## database already exists.
  skip_database_creation = true

  ## Name of existing retention policy to write to.  Empty string writes to
  ## the default retention policy.  Only takes effect when using HTTP.
  retention_policy = ""

  ## The value of this tag will be used to determine the retention policy.  If this
  ## tag is not set the 'retention_policy' option is used as the default.
  # retention_policy_tag = ""

  ## If true, the 'retention_policy_tag' will not be included in the written metric.
  # exclude_retention_policy_tag = false

  ## Write consistency (clusters only), can be: "any", "one", "quorum", "all".
  ## Only takes effect when using HTTP.
  write_consistency = "any"

  ## Timeout for HTTP messages.
  timeout = "5s"

  ## HTTP Basic Auth
  username = "admin"
  password = "<password>"
- Find[[ inputs.sqlserver ]]Section, uncomment the related configuration items, and the servers section connects to the local instance.
The default Plugin of Telegraf includes the implementation of SQL Server, which also includes the implementation of Azure SQL PaaS
# # Read metrics from Microsoft SQL Server
 [[inputs.sqlserver]]
#   ## Specify instances to monitor with a list of connection strings.
#   ## All connection parameters are optional.
#   ## By default, the host is localhost, listening on default port, TCP 1433.
#   ##   for Windows, the user is the currently running AD user (SSO).
#   ##   See https://github.com/denisenkom/go-mssqldb for detailed connection
#   ##   parameters, in particular, tls connections can be created like so:
#   ##   "encrypt=true;certificate=<cert>;hostNameInCertificate=<SqlServer host fqdn>"
        servers = [
                        "Server=localhost;Port=1433;User Id=telegraf;Password=<yourPassword>;app name=telegraf;log=1;"
                ]
#
#   ## Optional parameter, setting this to 2 will use a new version
#   ## of the collection queries that break compatibility with the original
#   ## dashboards.
        query_version = 2
#
#   ## If you are using AzureDB, setting this to true will gather resource utilization metrics
#   # azuredb = false
#
#   ## Possible queries:
#   ## - PerformanceCounters
#   ## - WaitStatsCategorized
#   ## - DatabaseIO
#   ## - DatabaseProperties
#   ## - CPUHistory
#   ## - DatabaseSize
#   ## - DatabaseStats
#   ## - MemoryClerk
#   ## - VolumeSpace
#   ## - PerformanceMetrics
#   ## - Schedulers
#   ## - AzureDBResourceStats
#   ## - AzureDBResourceGovernance
#   ## - SqlRequests
#   ## - ServerProperties
#   ## A list of queries to include. If not specified, all the above listed queries are used.
#   # include_query = []
#
#   ## A list of queries to explicitly ignore.
#   exclude_query = [ 'Schedulers' , 'SqlRequests']
After launching Telegraf, you can see the input and collection interval loaded at
[root@SQL19N1 log]# systemctl status telegraf
● telegraf.service - The plugin-driven server agent for reporting metrics into InfluxDB
   Loaded: loaded (/usr/lib/systemd/system/telegraf.service; enabled; vendor preset: disabled)
   Active: active (running) since Tue 2020-05-26 14:19:07 UTC; 19min ago
     Docs: https://github.com/influxdata/telegraf
 Main PID: 12359 (telegraf)
   CGroup: /system.slice/telegraf.service
           └─12359 /usr/bin/telegraf -config /etc/telegraf/telegraf.conf -config-directory /etc/telegraf/telegraf.d

May 26 14:19:07 SQL19N1 systemd[1]: Started The plugin-driven server agent for reporting metrics into InfluxDB.
May 26 14:19:07 SQL19N1 telegraf[12359]: 2020-05-26T14:19:07Z I! Starting Telegraf 1.14.3
May 26 14:19:07 SQL19N1 telegraf[12359]: 2020-05-26T14:19:07Z I! Loaded inputs: system cpu disk diskio kernel mem processes swap sqlserver
May 26 14:19:07 SQL19N1 telegraf[12359]: 2020-05-26T14:19:07Z I! Loaded aggregators:
May 26 14:19:07 SQL19N1 telegraf[12359]: 2020-05-26T14:19:07Z I! Loaded processors:
May 26 14:19:07 SQL19N1 telegraf[12359]: 2020-05-26T14:19:07Z I! Loaded outputs: influxdb
May 26 14:19:07 SQL19N1 telegraf[12359]: 2020-05-26T14:19:07Z I! Tags enabled: host=SQL19N1
May 26 14:19:07 SQL19N1 telegraf[12359]: 2020-05-26T14:19:07Z I! [agent] Config: Interval:20s, Quiet:false, Hostname:"SQL19N1", Flush Interval:10s
-
Telegraf on Windows
Execute the following PowerShell command as Administrator
# Download a software
wget https://dl.influxdata.com/telegraf/releases/telegraf-1.14.3_windows_amd64.zip ·
    -OutFile "c:\temp\telegraf-1.14.3_windows_amd64.zip"

# Extract to C:\Program Files\Telegraf
Expand-Archive "c:\temp\telegraf-1.14.3_windows_amd64.zip", "C:\Program Files"

# Installing telegraf as a windows Service
C:\"Program Files"\Telegraf\telegraf.exe --service install
modify telegraf.conf in outputs.influxdb And add inputs.sqlserver Part 2, these contents are the same as the configuration on Linux, so we won't go into details.
After the modification of conf, you can test whether the telegraf can start normally. If there is no problem, start the telegraf service.
# test
C:\"Program Files"\Telegraf\telegraf.exe --config C:\"Program Files"\Telegraf\telegraf.conf --test

# Start service
C:\"Program Files"\Telegraf\telegraf.exe --service start
-
Configure the data source and Dashboard of Grafana
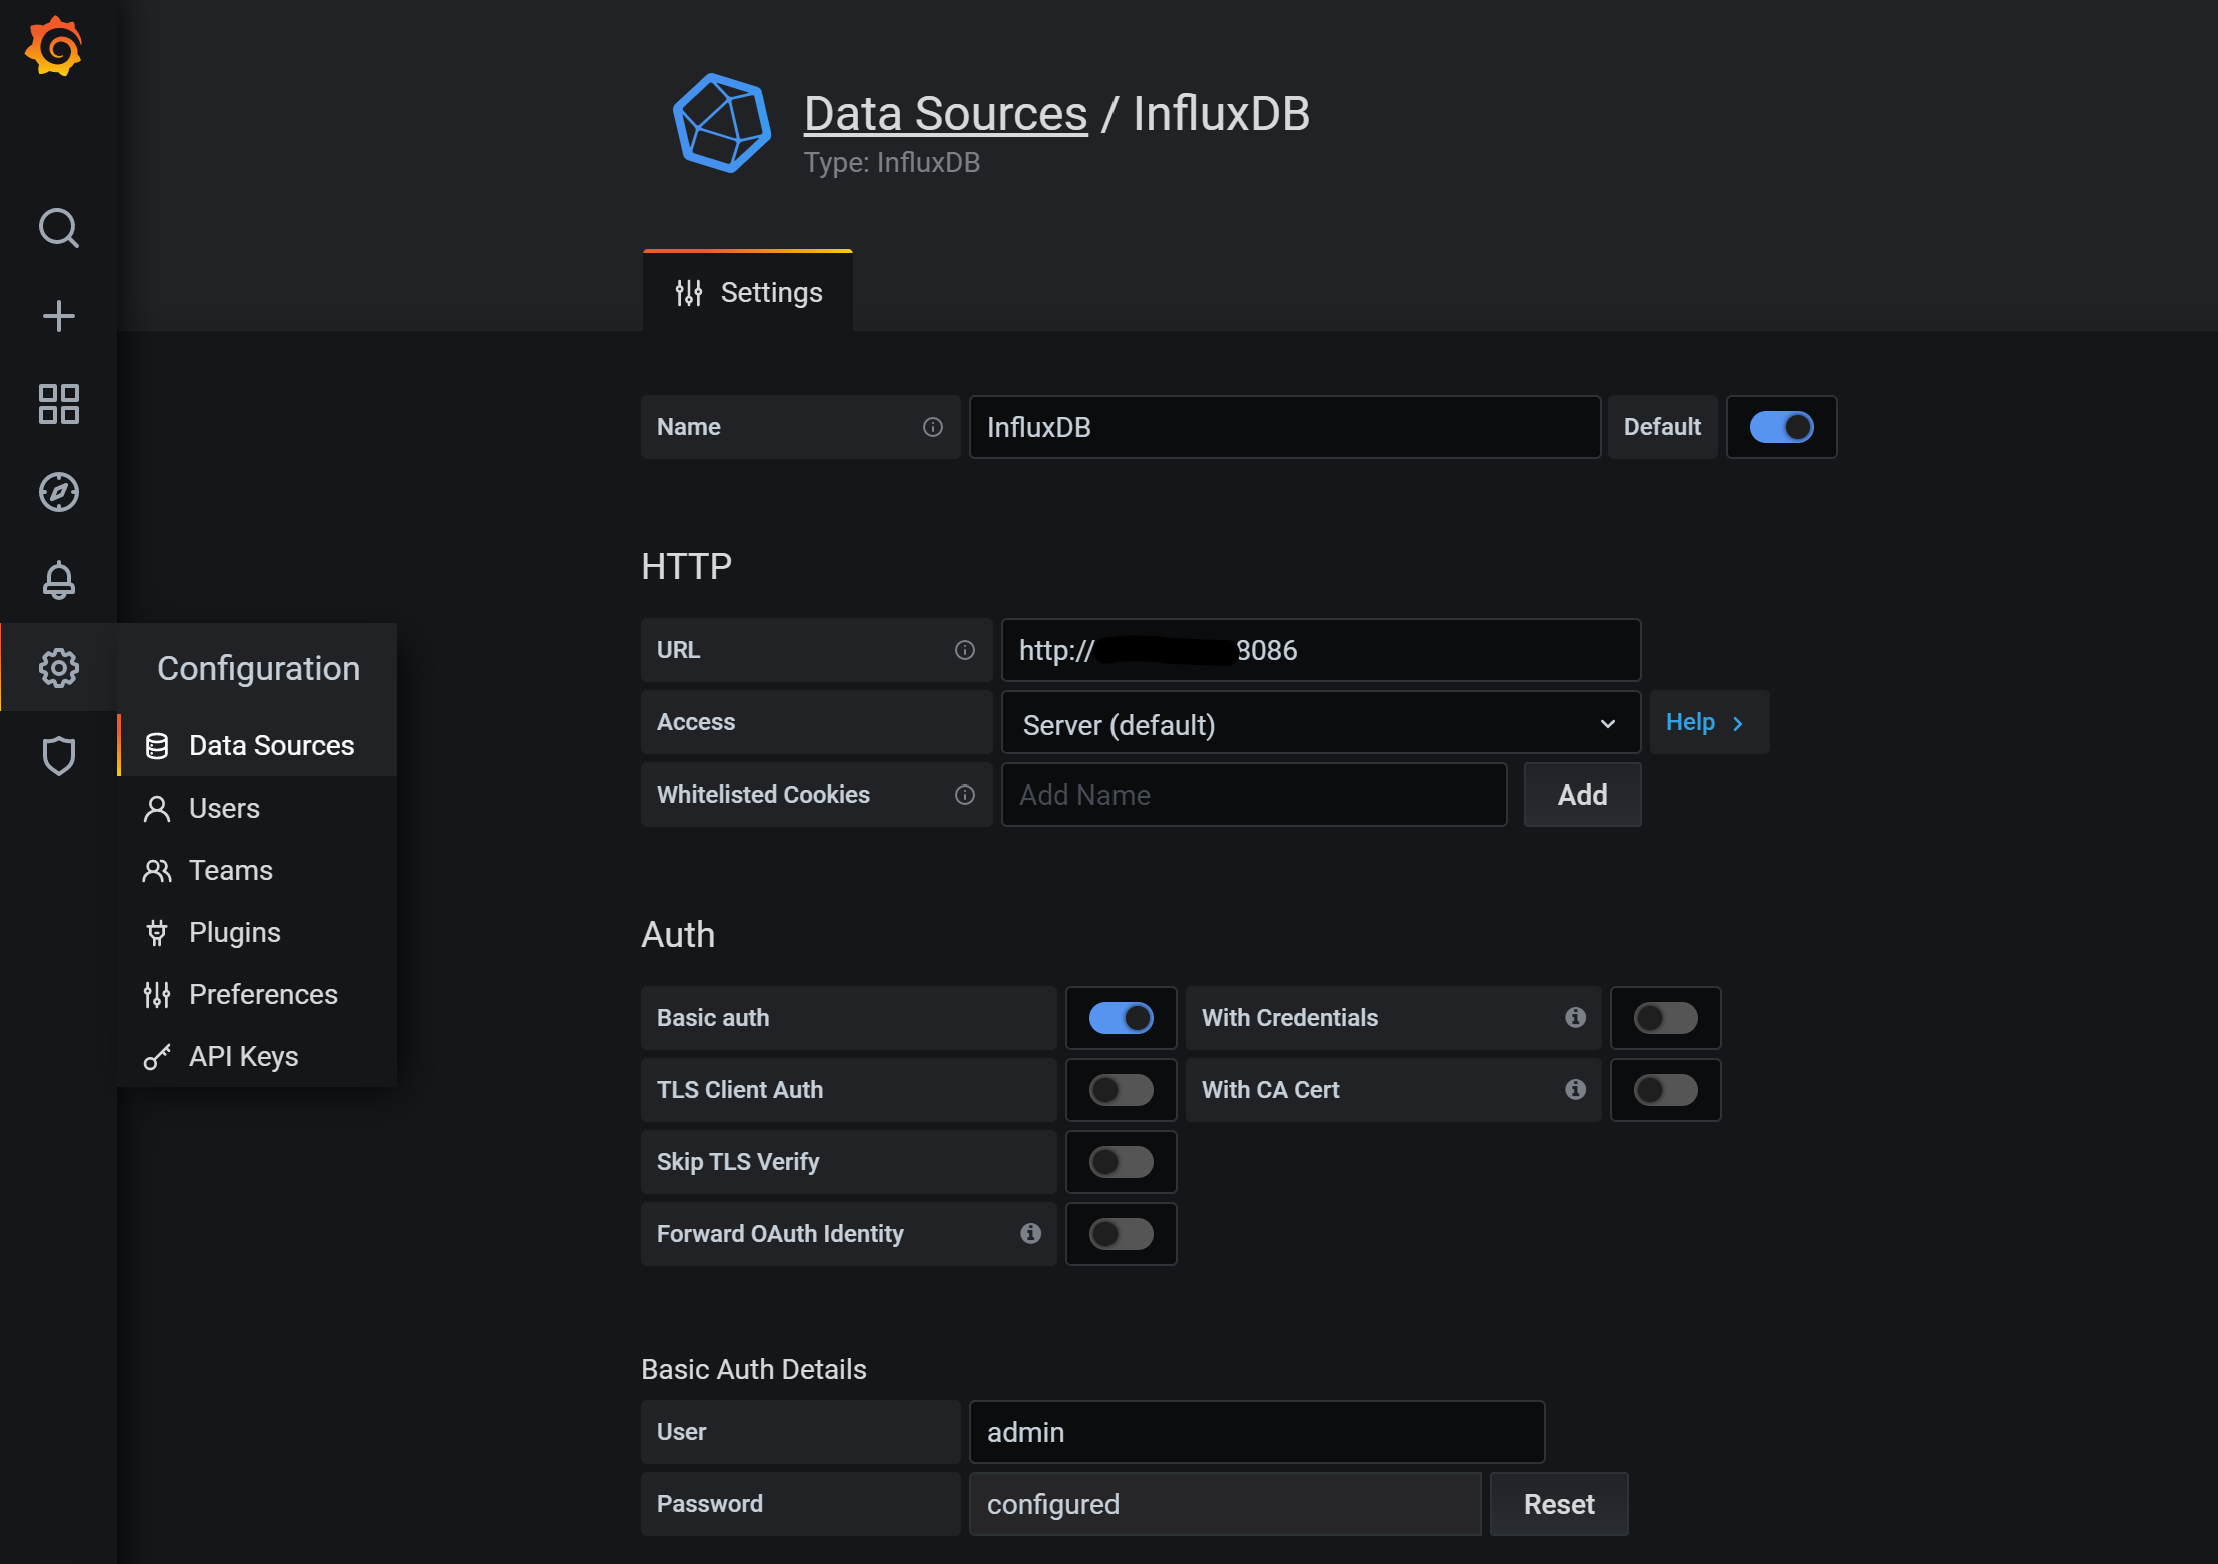
After logging in to Grafana, configure the InfluxDB data source in the configuration - > data source on the left, fill in the address, account, password and set it as the default data source, as shown in the following figure
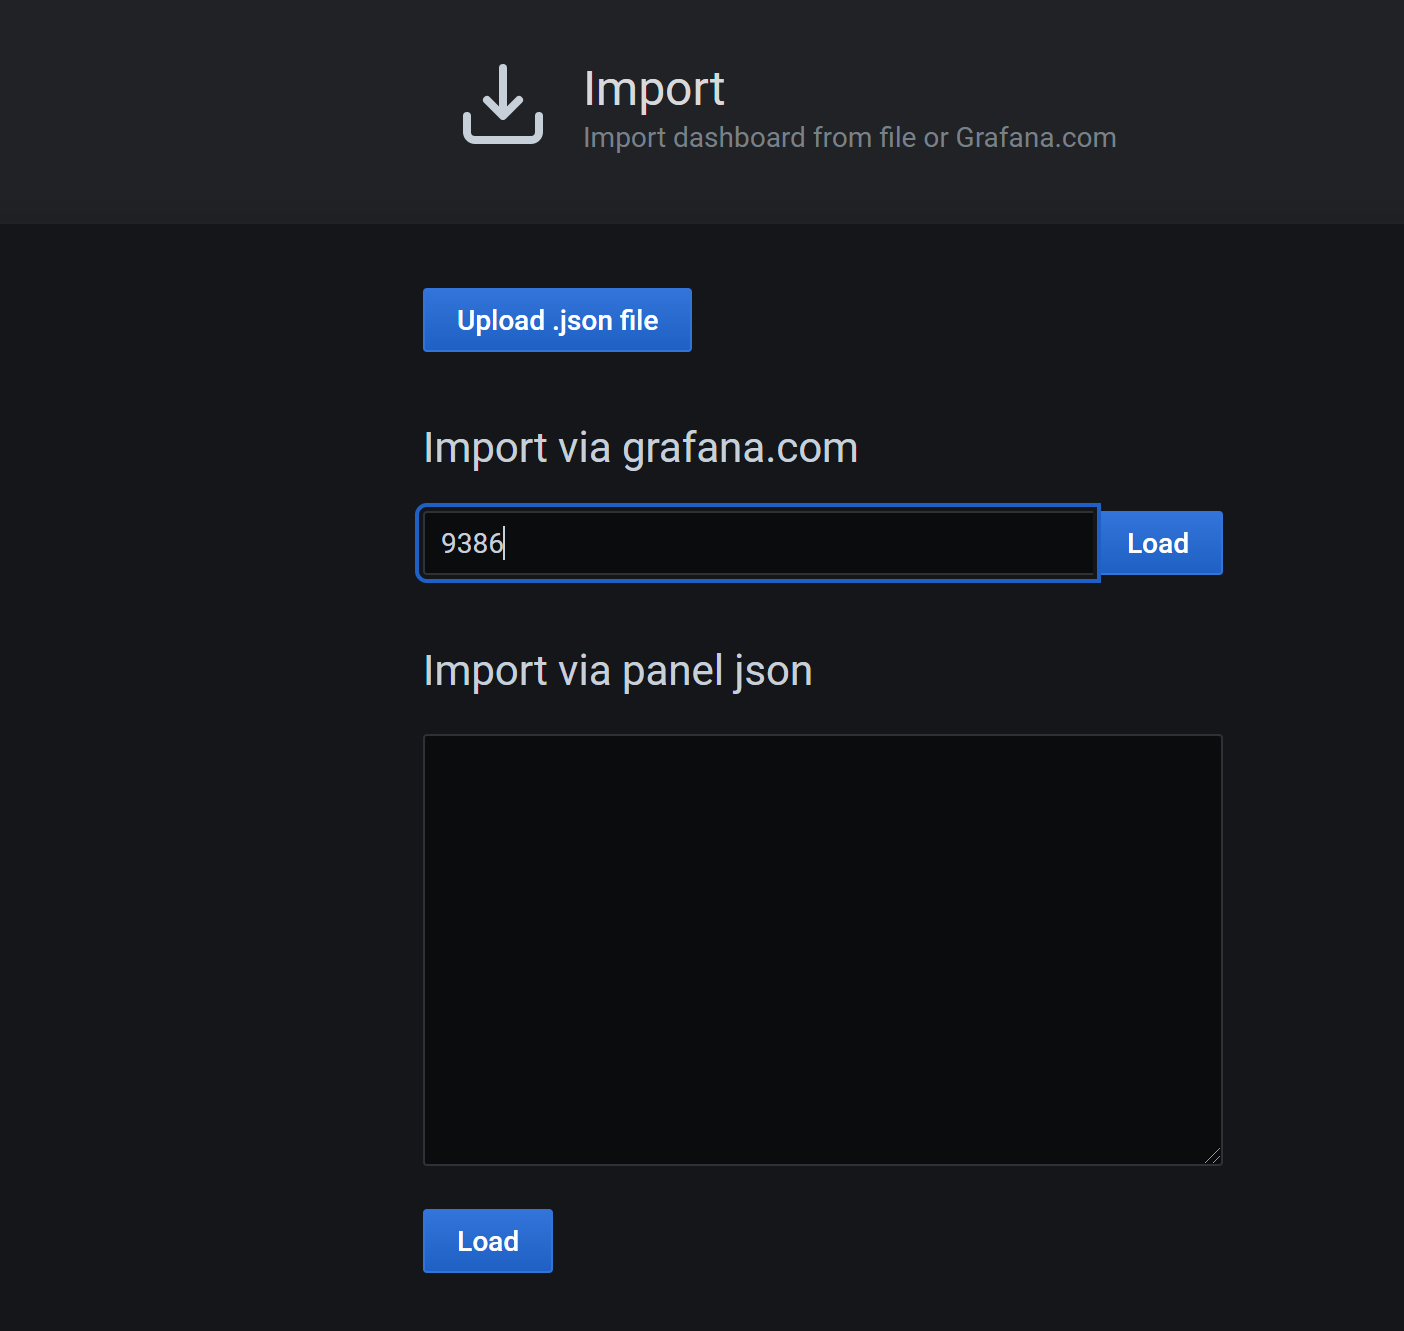
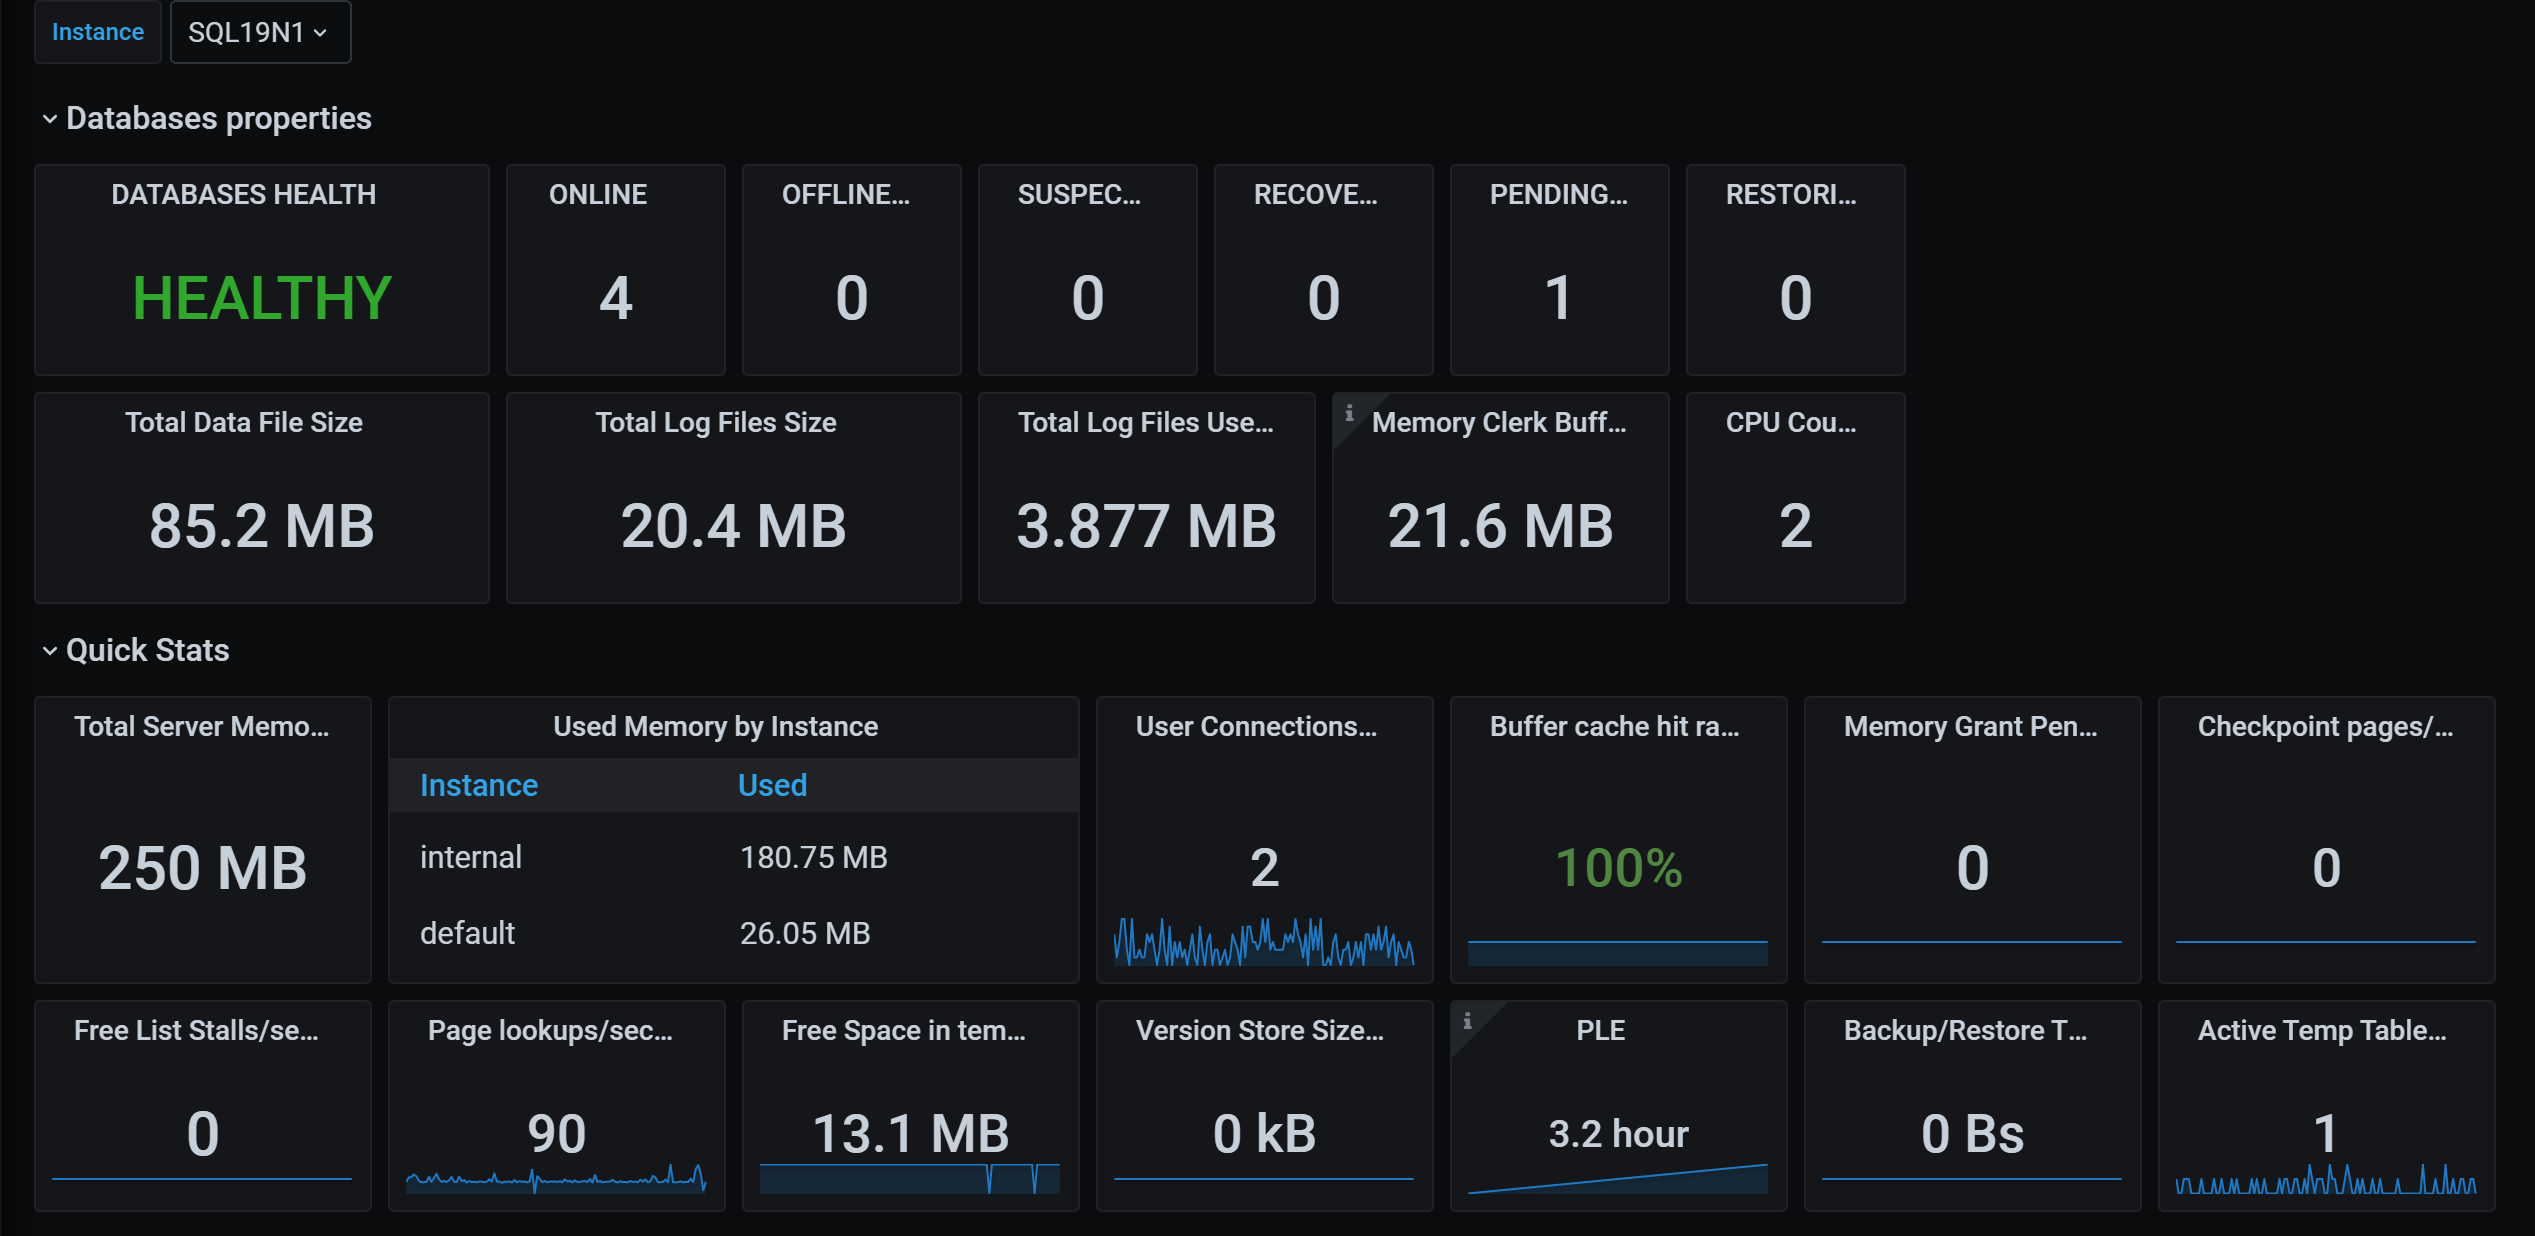
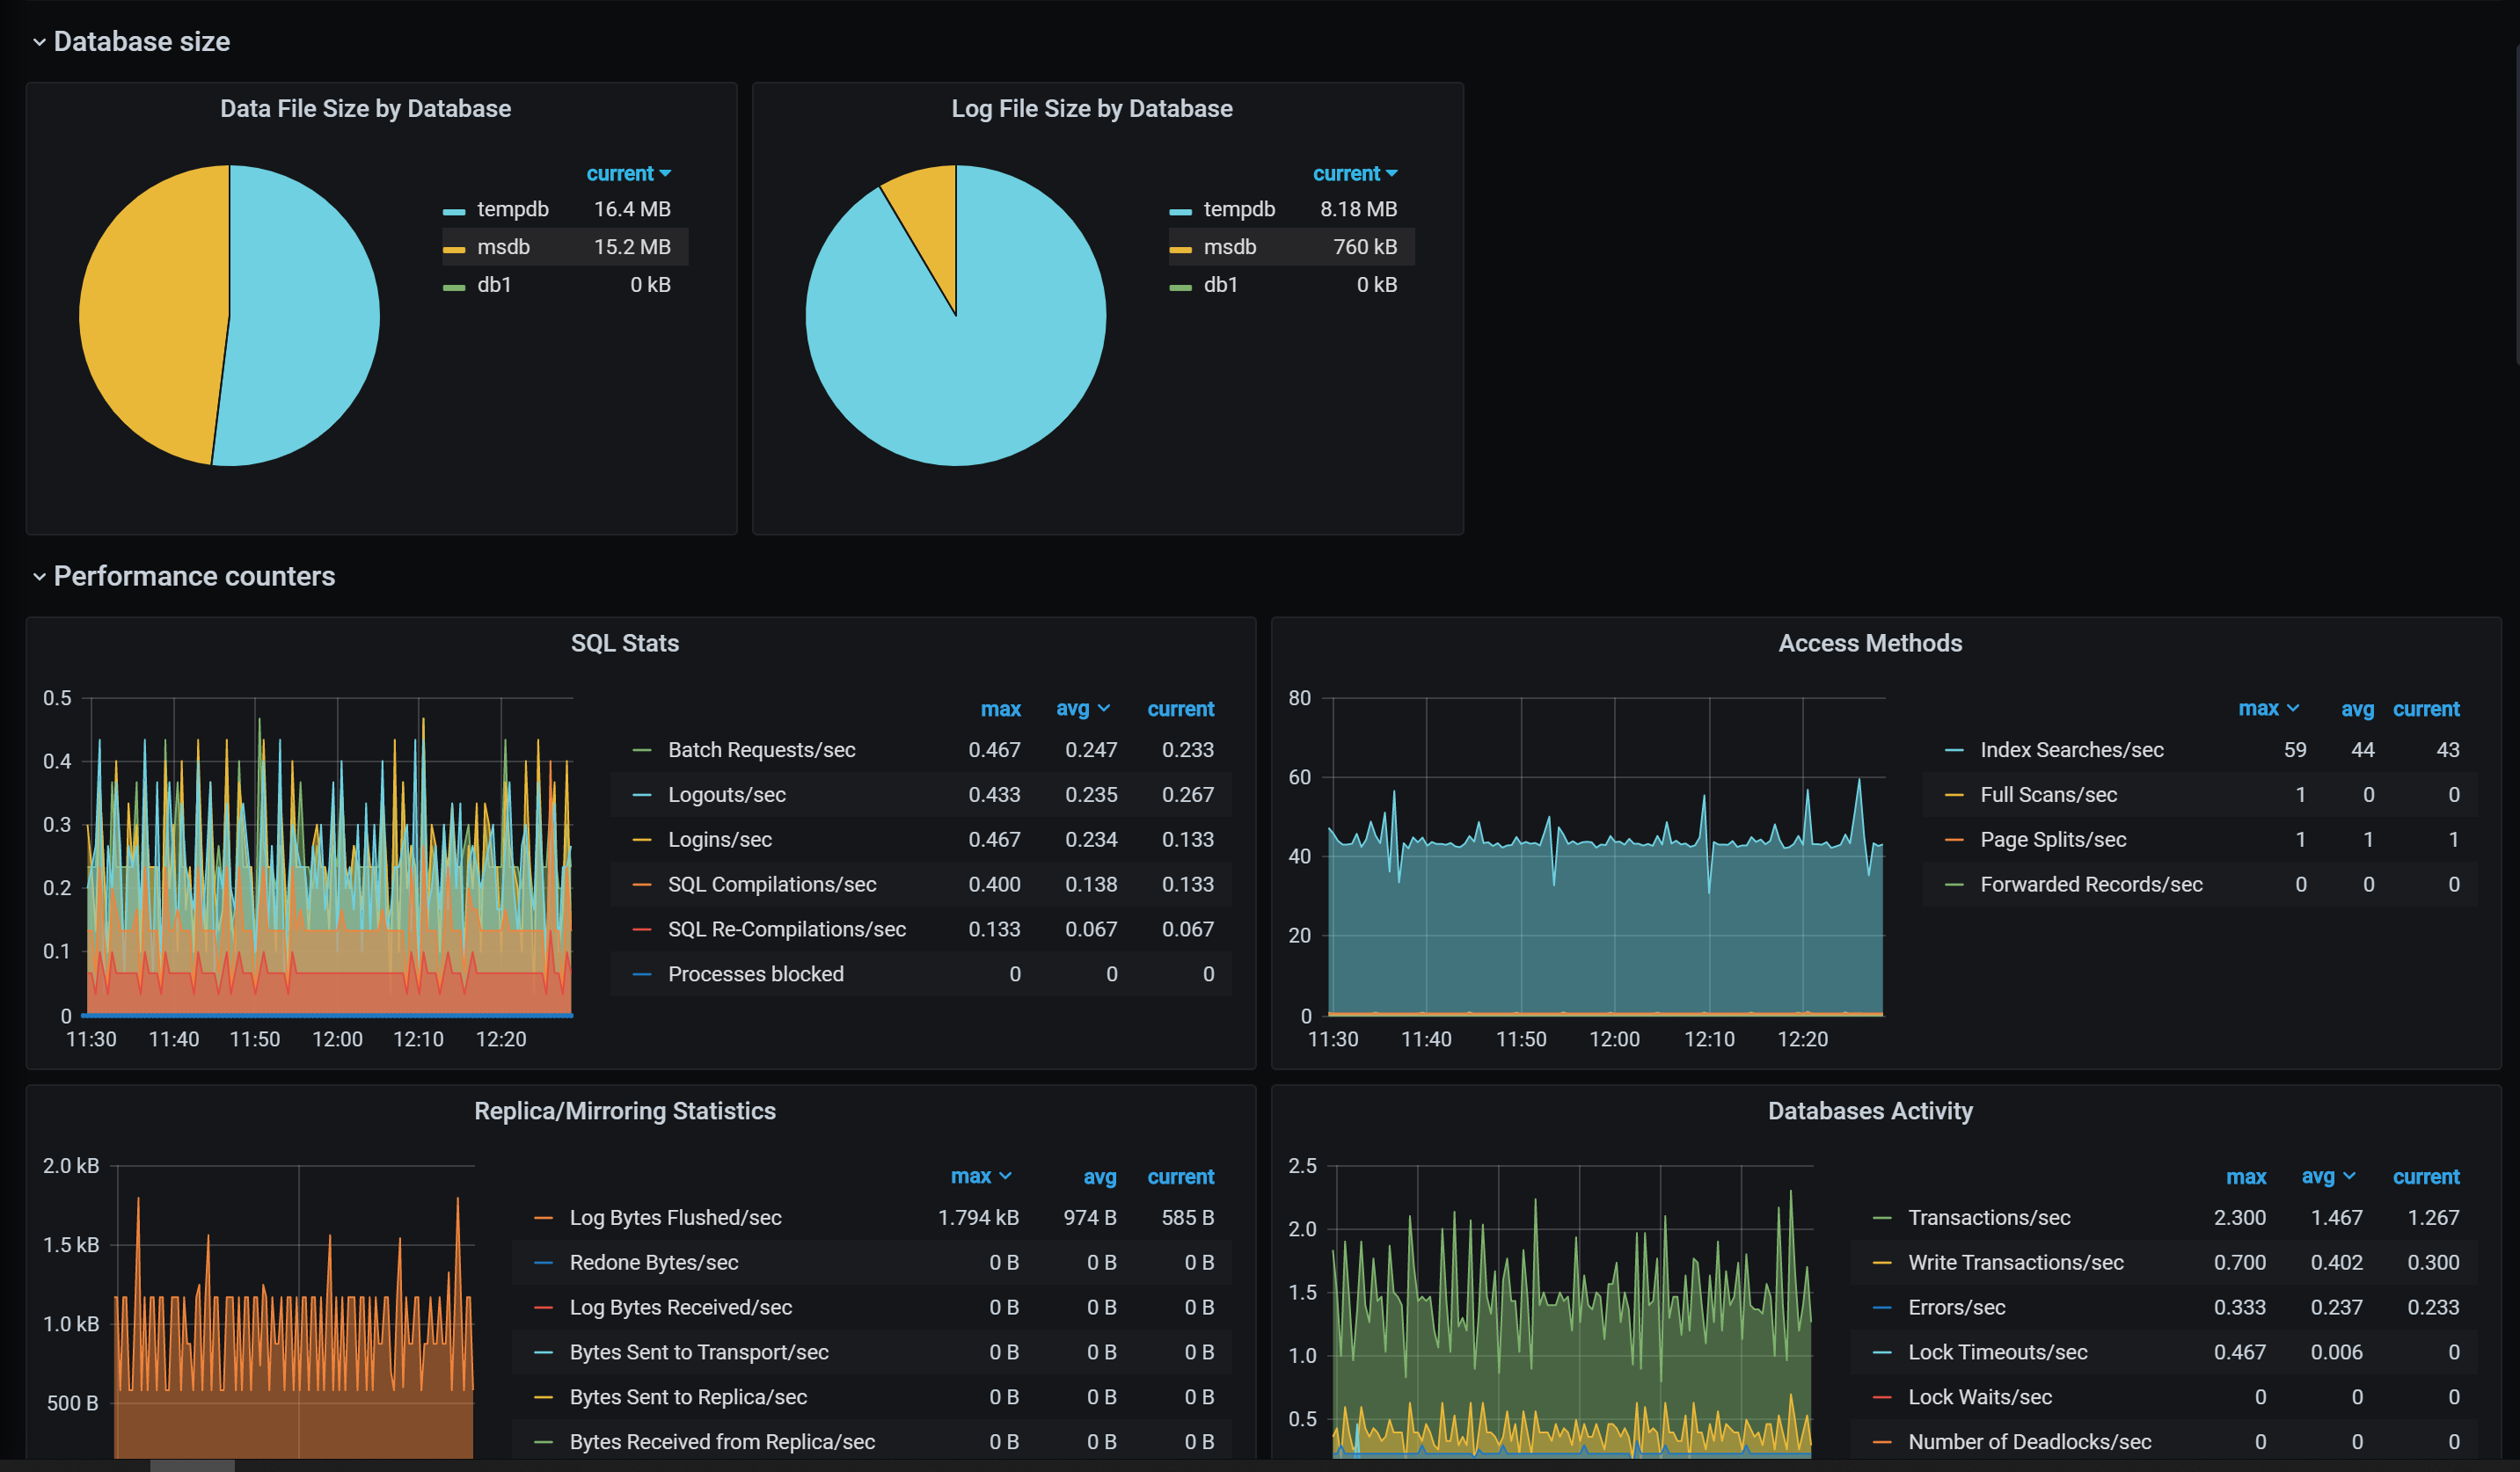
Dashboard s can be created by themselves or in the open community (thanks to the enthusiastic and selfless tycoons). Here, I use SQL Servers by Jonathan Rioux . The Piechart used in this Dashboard is not preset by Grafana, so you need to install:
# The Host of Grafana is installed, and the service restart takes effect
grafana-cli plugins install grafana-piechart-panel
systemctl restart grafana-server.service
Then in the Grafana interface, select dashboard - > Import - > fill in dashboard ID - > Import on the left, as shown below:
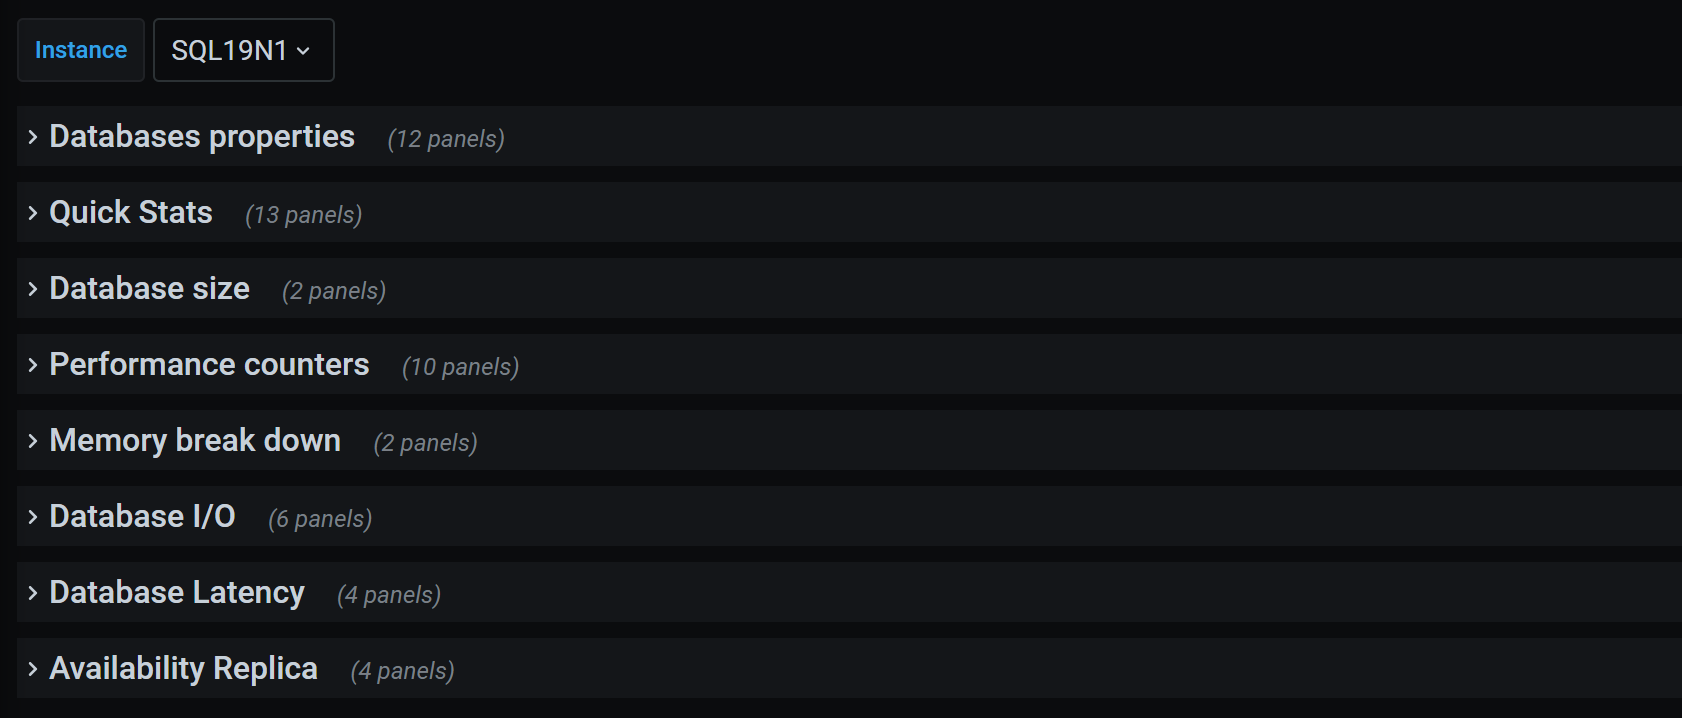
After configuration, you can see that the information provided by this Dashboard is rich, and you can also modify and add relevant content according to your own needs
summary
-
In fact, the data collection and report can not fully meet the business requirements. The customized data collection and Dashboard are also very easy to implement. Write again next time
-
If Zabbix is already in use, Grafana can directly output data to Zabbix.
-
Telegraf can support Cloud environment very well. Next time, let's talk about the monitoring of Azure SQL PaaS
-
The content of this article only represents personal views and is not related to any company or organization