Author: Gao Peng At the end of the article, there is his book "in-depth understanding of MySQL master-slave principle 32", in-depth understanding of MySQL master-slave, GTID related technical knowledge.
I. source of problems
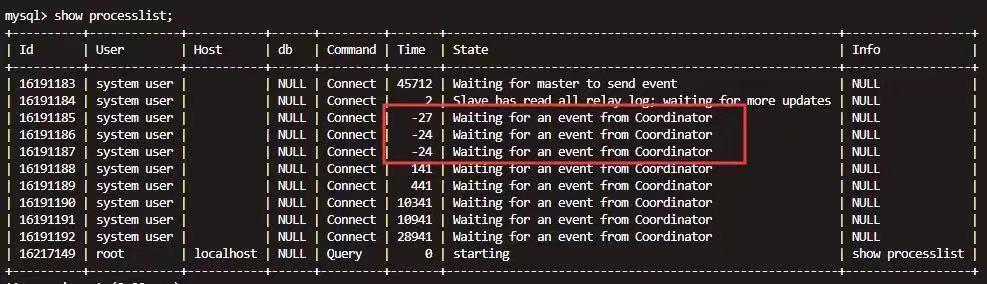
This is a question that a friend asked me. The question is as follows: what happens when the Worker thread sees that Time is negative in MTS, as follows:
II. About Time in show processlist
In fact, the information in show processlist basically comes from the function mysqld ﹣ list ﹣ processes. That is to say, this function needs to be executed every Time show processlist is executed to fill in. For the Time value, it comes from the following information:
Percona:
time_t now= my_time(0);
protocol->store_long ((thd_info->start_time > now) ? 0 :  (longlong) (now - thd_info->start_time));
//Official version:
time_t now= my_time(0);
protocol->store_long ((longlong) (now - thd_info->start_time));
We can notice that this output value has been optimized in the Percona version, that is, if there is a negative number, it will be displayed as 0 directly, but it is not done in the official version, and it may be negative.
III. interpretation and test of calculation method
Now let's take a look at this simple calculation formula. In fact, now has a good understanding of the current time of the server. The key is where the value of thd_info - > start_time comes from. The actual time comes from the function thd:: set ﹣ time, but it should be noted that this function will be overloaded in the following three ways:
Heavy load 1
inlinevoid set_time()
{
    start_utime= utime_after_lock= my_micro_time();
if(user_time.tv_sec || user_time.tv_usec)
{
      start_time= user_time;
}
else
      my_micro_time_to_timeval(start_utime, &start_time);
...
}
Heavy load 2
 inlinevoid set_time(conststruct timeval *t)
 {
    start_time= user_time= *t;
    start_utime= utime_after_lock= my_micro_time();
...
}
Heavy load 3
void set_time(QUERY_START_TIME_INFO *time_info)
{
    start_time= time_info->start_time;
    start_utime= time_info->start_utime;
}
In fact, there is a start Time. If start Time is set, then start Time will be specified as start Time, and whether start Time will be modified in overload 1 is more important. Now that we have mentioned three ways, let's see that Time calculation is possible as follows.
1. Execute command If the common commands executed by the main database will call overload 1 when the command is initiated, set start time to the time when the command starts executing as follows:
Stack:
#0  THD::set_time (this=0x7ffe7c000c90) at /mysqldata/percona-server-locks-detail-5.7.22/sql/sql_class.h:3505
#1  0x00000000015c5fe8 in dispatch_command (thd=0x7ffe7c000c90, com_data=0x7fffec03fd70, command=COM_QUERY)
    at /mysqldata/percona-server-locks-detail-5.7.22/sql/sql_parse.cc:1247
You can see that this function has no arguments, so start Time will be set to the current Time, and the calculation formula of Time now - thdinfo - > start Time is equal to (server current Time - the Time when the command starts executing).
2. Slave Sql thread and Worker thread
In fact, whether a single Sql thread or a Worker thread executes an Event, the start time here will be set to the timestamp time in the Event header (query event/dml event), which is actually the time when the main database command is initiated. As follows:
Stack:
query event:

#0  THD::set_time (this=0x7ffe78000950, t=0x7ffe701ec430) at /root/mysqlall/percona-server-locks-detail-5.7.22/sql/sql_class.h:3526
#1  0x00000000018459ab in Query_log_event::do_apply_event (this=0x7ffe701ec310, rli=0x7ffe7003c050, query_arg=0x7ffe701d88a9 "BEGIN", q_len_arg=5)
    at /root/mysqlall/percona-server-locks-detail-5.7.22/sql/log_event.cc:4714

//Stack:
dml event:
#0  THD::set_time (this=0x7ffe78000950, t=0x7ffe701ed5b8) at /root/mysqlall/percona-server-locks-detail-5.7.22/sql/sql_class.h:3526
#1  0x000000000185aa6e in Rows_log_event::do_apply_event (this=0x7ffe701ed330, rli=0x7ffe7003c050)
    at /root/mysqlall/percona-server-locks-detail-5.7.22/sql/log_event.cc:11417
We see that there is an argument passed in here. Let's see the code as follows:
thd->set_time(&(common_header->when))
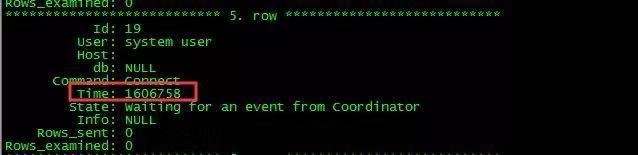
In fact, this is the line. This is overload 3 we mentioned earlier. After setting, start time and start time will be set. Even if overload 1 is called, it will not be changed. The calculation method of time is now thd Info - > start time, which is equal to (from the current time of the library server - the time in the Event header). But you need to know that the time in the Event header actually comes from Time when the master command was initiated. In this case, if the time of the slave database server is less than that of the master database server, the result of time may be negative. Of course, if the Percona version optimizes the negative number, it will be displayed as 0. If the time of the slave database server is greater than that of the master database, it may be seen that the time is larger. Because my test environment is Percona, in order to get obvious results, let's test the situation that the Worker thread time is very large, as follows:
Main storehouse:
[root@mysqltest2 test]# date
FriNov101:40:54 CST 2019

//From library:
[root@gp1 log]# date
TueNov1915:58:37 CST 2019
The main database makes a random command, and then observes as follows:
3. Set timestamp
If you specify timestamp manually, the calculation result of Time will also be affected, because both start Time and start Time will be set, as follows:
mysql> set timestamp=1572540000

//Stack:
#0  THD::set_time (this=0x7ffe7c000c90, t=0x7fffec03db30) at /mysqldata/percona-server-locks-detail-5.7.22/sql/sql_class.h:3526
#1  0x000000000169e509 in update_timestamp (thd=0x7ffe7c000c90, var=0x7ffe7c006860) at /mysqldata/percona-server-locks-detail-5.7.22/sql/sys_vars.cc:4966
#2  0x00000000016b9a3d in Sys_var_session_special_double::session_update (this=0x2e68e20, thd=0x7ffe7c000c90, var=0x7ffe7c006860)
    at /mysqldata/percona-server-locks-detail-5.7.22/sql/sys_vars.h:1889
We see that the actual parameter is brought in. Let's look at the line of code as follows:
thd->set_time(&tmp);
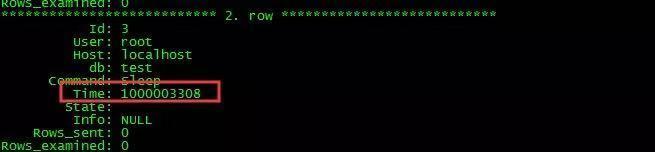
This is overload 2. After setting, start Time and start Time will be set. Even if overload 1 is called, it will not be changed. The implication is that Time will not be updated even if other commands are executed after timestamp is set. The calculation method of Time now - thdinfo - > starttime is equal to (server current Time - set timestamp Time). In this case, there may be Time exceptions, such as a large or negative number (Percona is 0) as follows:
4. Idle
If our session is idle, now will continue to increase in the now thd info > start Time formula, but thd info > start Time will not change, so Time will continue to increase, waiting until the next command comes.
Four, extension
Here I want to explain that if the slave database has enabled log [slave] updates, the slave database records the events from the master database, but how to get the values of the timestamp of these events and the exit time of query events?
Value of timestamp of Event
In fact, I have said above, because start time will be set to the timestamp time in the Event header (query event/dml event). When Evnet is recorded, the time is basically the same as the main database, as follows:
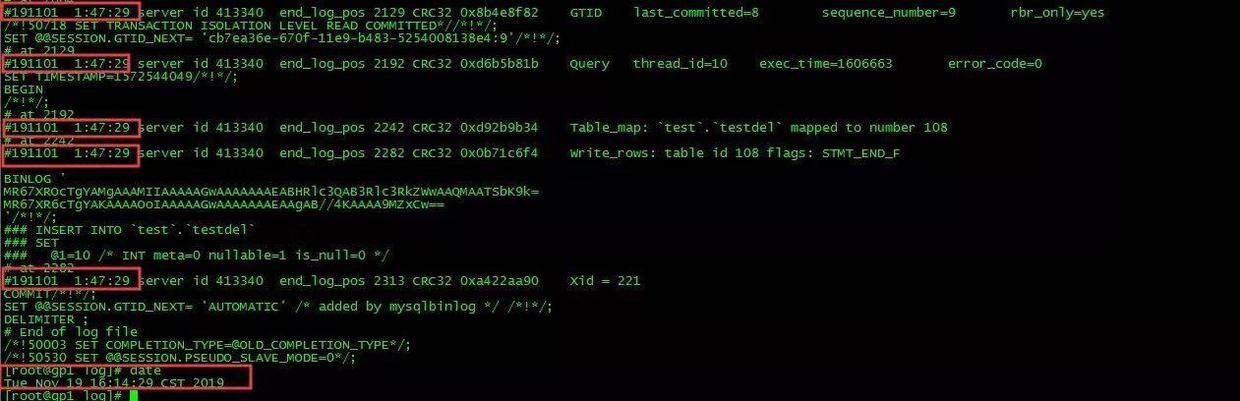
Obviously, we will find that the timestamp of these events is not the local time, but the time of the main database.
Exit of Query Event
Let's first look at how this time is calculated:
ulonglong micro_end_time= my_micro_time();//Get time query event here
  my_micro_time_to_timeval(micro_end_time, &end_time);

  exec_time= end_time.tv_sec - thd_arg->start_time.tv_sec;//Time is calculated here
I believe that it is no longer strange for thd_arg - > start_time. It is the time when the main database command is initiated. As I said in my in-depth understanding of the master-slave principle series, for the exit time of Query Event in row format binlog, DML statement will be the time when the first line of statement is modified, then we make the following definitions (row format DML statement):
- Master: server time when the first row of data in the master database is modified - time when the master database initiates this command
- From: server time when the data modification of the first line of the slave database is completed - time when the master database initiates this command
The difference between them is: (the server time when the first row of data in the slave database is modified - the server time when the first row of data in the master database is modified) similarly, if the time of our slave database is much longer than that of the master database, the exception will appear as follows:

Last:
Time is an indicator that we usually pay attention to. We often use it to indicate how long my statement has been executed. However, if there is an exception, we should be able to understand why. Here I give an incomplete explanation of its calculation method, hoping to help you. Of course, for the master-slave part or Event part, you can refer to my "in depth understanding the master-slave principle" series.