Author: Liu An A member of the test team of akesheng, who is mainly responsible for the related test tasks of TXLE open source project, is good at Python automatic test development, and is recently absorbed in the relevant knowledge of Linux performance analysis and optimization. Source: original contribution *Aikesheng is produced by the open source community. The original content cannot be used without authorization. Please contact the editor for reprint and indicate the source.
Recently, I learned "Linux Performance Optimization Practice" in Geek time and came into contact with BCC software package based on eBPF. Today, let's share a few tools used to observe MySQL in BCC package.
1. What is BPF and eBPF
- BPF = Berkeley Packet Filter
-
BPF is a kind of original interface of data link layer on Unix like system, which provides the sending and receiving of original link layer packets
-
BPF supports filtering packets -- a user state process can provide a filter to declare which packets it wants to receive
-
Since version 3.18, the Linux kernel has provided an extended BPF virtual machine, which is called "extended BPF", or eBPF for short. It can be used for non network related functions, such as attaching to different tracepoints, to obtain a lot of information about the current kernel operation
In fact, the libpcap used by tcpdump is based on BPF. The bcc package based on eBPF that we will introduce next can be simply understood as "tcpdump" that filters the running information of kernel.
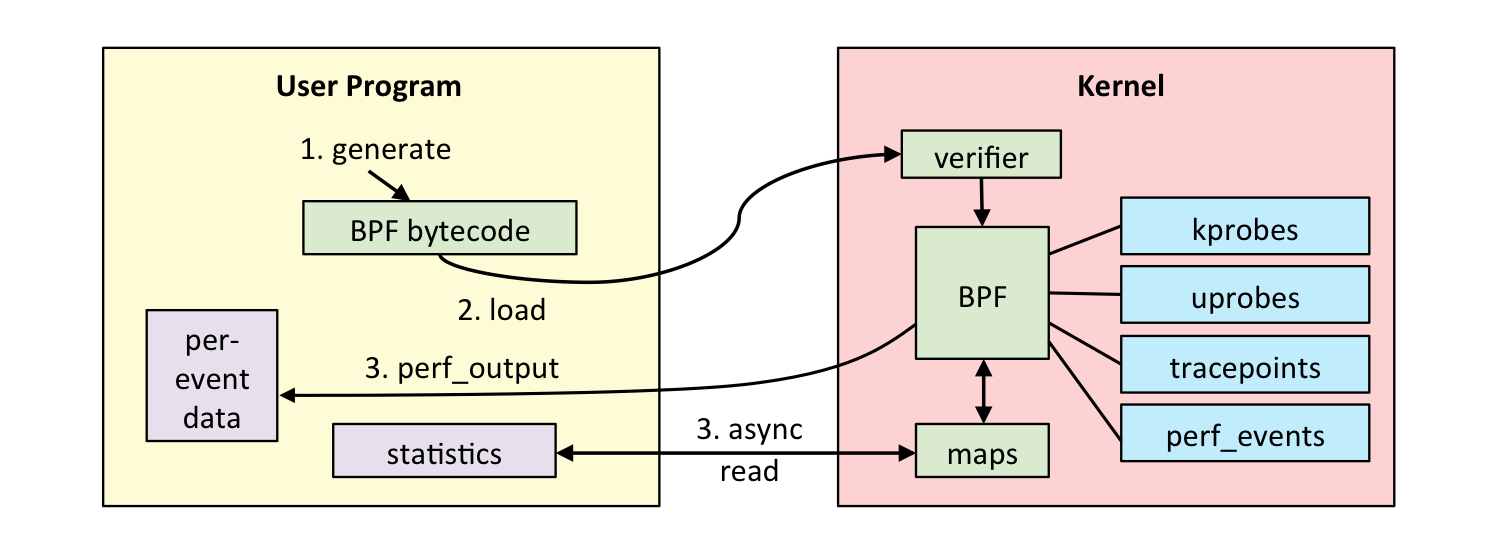
The following is a workflow diagram of BPF:

2. What is bcc
-
Bcc's open source projects https://github.com/iovisor/bcc
-
eBPF virtual machine uses instructions similar to assembly language, which is very difficult for programming. bcc provides a python library named bcc, which simplifies the development process of eBPF application
-
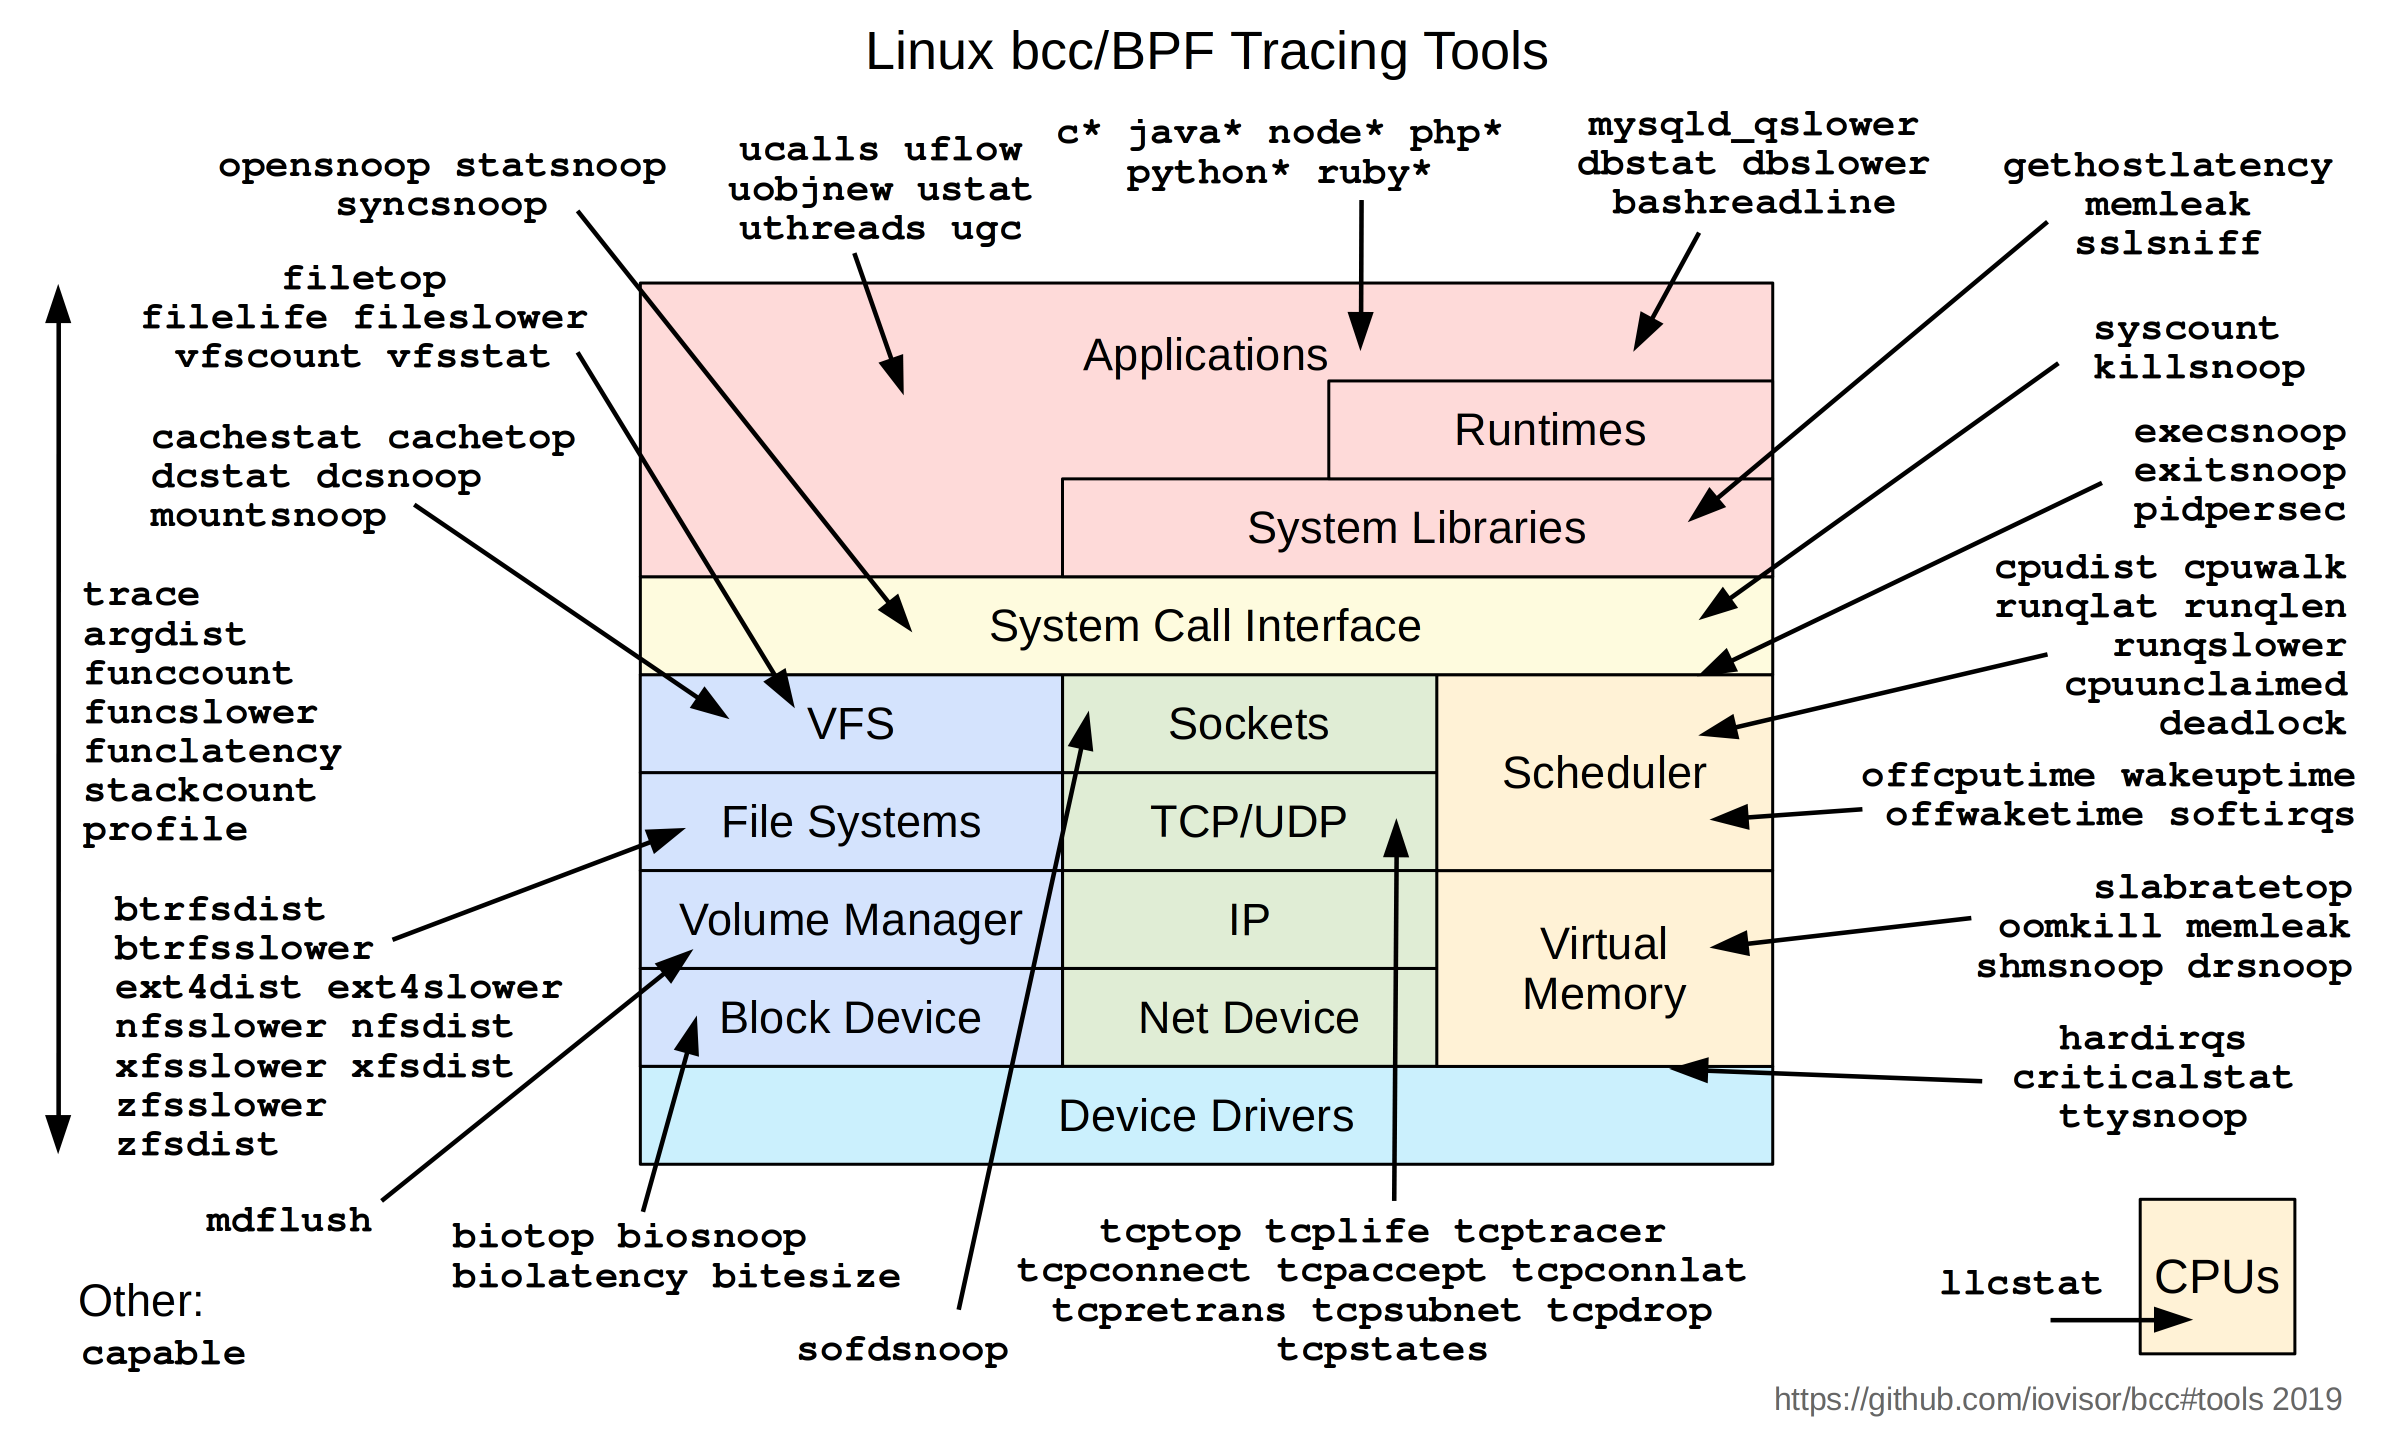
Bcc has collected a large number of ready-made eBPF programs that can be used directly. You can feel it through the following tool distribution map

3. install bcc
# Ubuntu
sudo apt-key adv --keyserver keyserver.ubuntu.com --recv-keys 4052245BD4284CDD
echo "deb https://repo.iovisor.org/apt/$(lsb_release -cs) $(lsb_release -cs) main" | sudo tee /etc/apt/sources.list.d/iovisor.list
sudo apt-get update
sudo apt-get install bcc-tools libbcc-examples linux-headers-$(uname -r)
export PATH=$PATH:/usr/share/bcc/tools

# CentOS
yum install bcc-tools
export PATH=$PATH:/usr/share/bcc/tools
Taking CentOS 7.7 as an example, the installed toolset is as follows:

4. Use bcc tool to observe MySQL:
1)dbstat
-
Function: summarize query delay of MySQL/PostgreSQL into histogram
-
Syntax:
dbstat [-h] [-v] [-p [PID [PID ...]]] [-m THRESHOLD] [-u] [-i INTERVAL]
              {mysql,postgres}
- Options:
{mysql,postgres}                           # Which database to observe
-h, --help                                 # Show help and exit
-v, --verbose                              # Show BPF program
-p [PID [PID ...]], --pid [PID [PID ...]]  # Process number to observe, space separated
-m THRESHOLD, --threshold THRESHOLD        # Only those with higher query delay than this threshold are counted
-u, --microseconds                         # Display delay in microseconds (default: ms)
-i INTERVAL, --interval INTERVAL           # Time interval to print summary in seconds
- Example:
# Using sysbench to perform select on the observed database
[root@liuan tools]# dbstat mysql -p `pidof mysqld` -u
Tracing database queries for pids 3350 slower than 0 ms...
^C[14:42:26]
     query latency (us)  : count     distribution
         0 -> 1          : 0        |                                        |
         2 -> 3          : 0        |                                        |
         4 -> 7          : 0        |                                        |
         8 -> 15         : 0        |                                        |
        16 -> 31         : 0        |                                        |
        32 -> 63         : 0        |                                        |
        64 -> 127        : 0        |                                        |
       128 -> 255        : 0        |                                        |
       256 -> 511        : 0        |                                        |
       512 -> 1023       : 491612   |****************************************|
      1024 -> 2047       : 46152    |****                                    |
      2048 -> 4095       : 261      |                                        |
      4096 -> 8191       : 1        |                                        |
      8192 -> 16383      : 3        |                                        |
2)dbslower
-
Function: the query time of tracking MySQL/PostgreSQL is higher than the threshold value
-
Syntax:
dbslower [-h] [-v] [-p [PID [PID ...]]] [-x PATH] [-m THRESHOLD]
                 {mysql,postgres}
- Parameters:
 {mysql,postgres}                           # Which database to observe
 -h, --help                                 # Show help and exit
 -v, --verbose                              # Show BPF program
 -p [PID [PID ...]], --pid [PID [PID ...]]  # Process number to observe, space separated
 -m THRESHOLD, --threshold THRESHOLD        # Only those with higher query delay than this threshold are counted
 -x PATH, --exe PATH                        # Location of database binaries
- Example:
 # Using sysbench to perform update? Index on the observed database
 [root@liuan tools]# dbslower mysql -p `pidof mysqld` -m 2
 Tracing database queries for pids 3350 slower than 2 ms...
 TIME(s)        PID          MS QUERY
 1.765087       3350      2.996 UPDATE sbtest1 SET k=k+1 WHERE id=963
 3.187147       3350      2.069 UPDATE sbtest1 SET k=k+1 WHERE id=628
 5.945987       3350      2.171 UPDATE sbtest1 SET k=k+1 WHERE id=325
 7.771761       3350      3.853 UPDATE sbtest1 SET k=k+1 WHERE id=595
5. Restrictions on use
-
bcc is developed based on eBPF (Linux 3.15 and later is required). Most of the content used by bcc requires Linux 4.1 and later.
-
"Bcc.usdt.usdtexception: failed to enable probe 'query \u start'; a possible cause can be that the probe requires a PID to enable" requires MySQL to have Dtrace tracepoint.
dbslower man page: https://github.com/iovisor/bcc/blob/master/man/man8/mysqld_qslower.8#L17-L18