APM is the abbreviation of Application Performance Monitoring, which monitors and manages the performance and availability of software applications. Application performance management is very important for the continuous and stable operation of an application. So this article talks about how to accurately monitor and report data from the perspective of iOS App performance management
The performance of App is one of the important factors that affect user experience. Performance problems mainly include: Crash, network request error or timeout, slow UI response speed, main thread stuck, high CPU and memory utilization, large power consumption, etc. Most of the problems are caused by developers' misuse of thread locks, system functions, programming specifications, data structures, and so on. The key to solve the problem is to find and locate the problem as early as possible.
This article focuses on the reasons for APM and how to collect data. After APM data collection, combined with data reporting mechanism, upload data to the server according to a certain strategy. The server consumes this information and produces reports. Please combine Sisters It summarizes how to build a flexible, configurable and powerful data reporting component.
1, Caton monitoring
The Caton problem is the problem that the main thread cannot respond to user interaction. It affects the user's direct experience, so the carton monitoring for App is an important part of APM.
FPS (frame per second) the number of frame refreshes per second. For iPhone, 60 is the best. For some iPad models, 120 is also a reference parameter for Caton monitoring. Why is it a reference parameter? Because it's not accurate. Let's talk about how to get FPS first. Cadisplaylink is a system timer that refreshes the view at the same rate as the frame refresh rate. [CADisplayLink displayLinkW ithTarget:self selector :@selector (###:)]. As for why not let's look at the following example code
_displayLink = [CADisplayLink displayLinkWithTarget:self selector:@selector(p_displayLinkTick:)];
[_displayLink setPaused:YES];
[_displayLink addToRunLoop:[NSRunLoop currentRunLoop] forMode:NSRunLoopCommonModes];
As shown in the code, the CADisplayLink object is added to a Mode of the specified RunLoop. So it's still CPU level operation. The experience of carton is the result of the whole image rendering: CPU + GPU. Please keep looking down
1. Screen drawing principle
Talk about the principle of the old CRT display. The CRT electron gun scans from the top to the next line according to the above method. After the scanning is completed, the display will show a frame picture, and then the electron gun returns to the initial position to continue the next scanning. In order to synchronize the display process of the display with the video controller of the system, the display (or other hardware) will use the hardware clock to generate a series of timing signals. When the gun changes to a new line and is ready for scanning, the display will send out a horizontal synchronization signal (HSync for short); when a frame of picture is drawn, the gun will return to its original position, and before the next frame is ready to be drawn, the display will send out a Vertical synchronization signal (VSync for short). The display is usually refreshed at a fixed frequency, which is the frequency of VSync signal generation. Although the current display is basically LCD, but the principle remains the same.
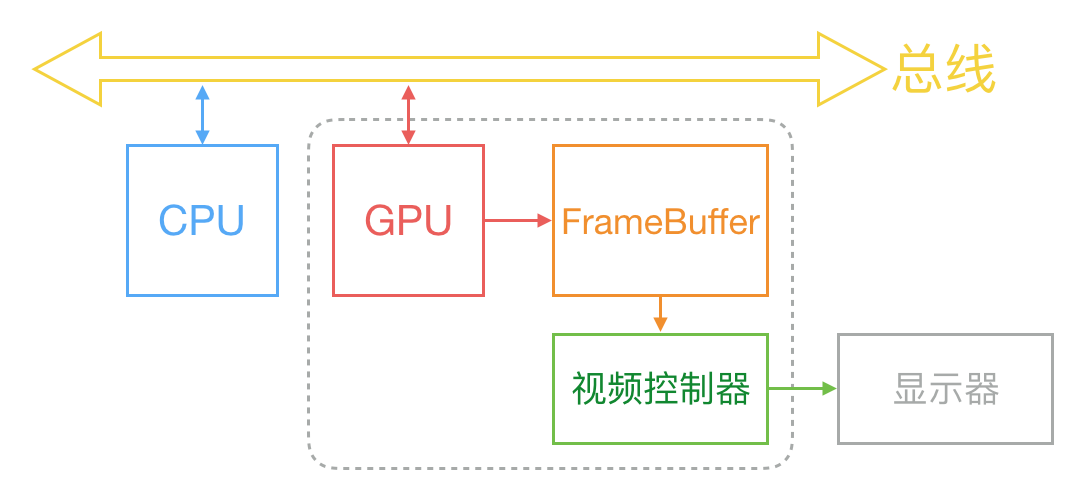
Generally, the display of a picture on the screen is coordinated by CPU, GPU and display according to the above figure. CPU calculates the real content (such as view creation, layout calculation, picture decoding, text drawing, etc.) according to the code written by the engineer, and then submits the calculation results to GPU, which is responsible for layer synthesis and texture rendering, and then GPU submits the rendering results to the frame buffer. Then the video controller will read the data of the frame buffer line by line according to the VSync signal, and pass it to the display through the digital to analog conversion.
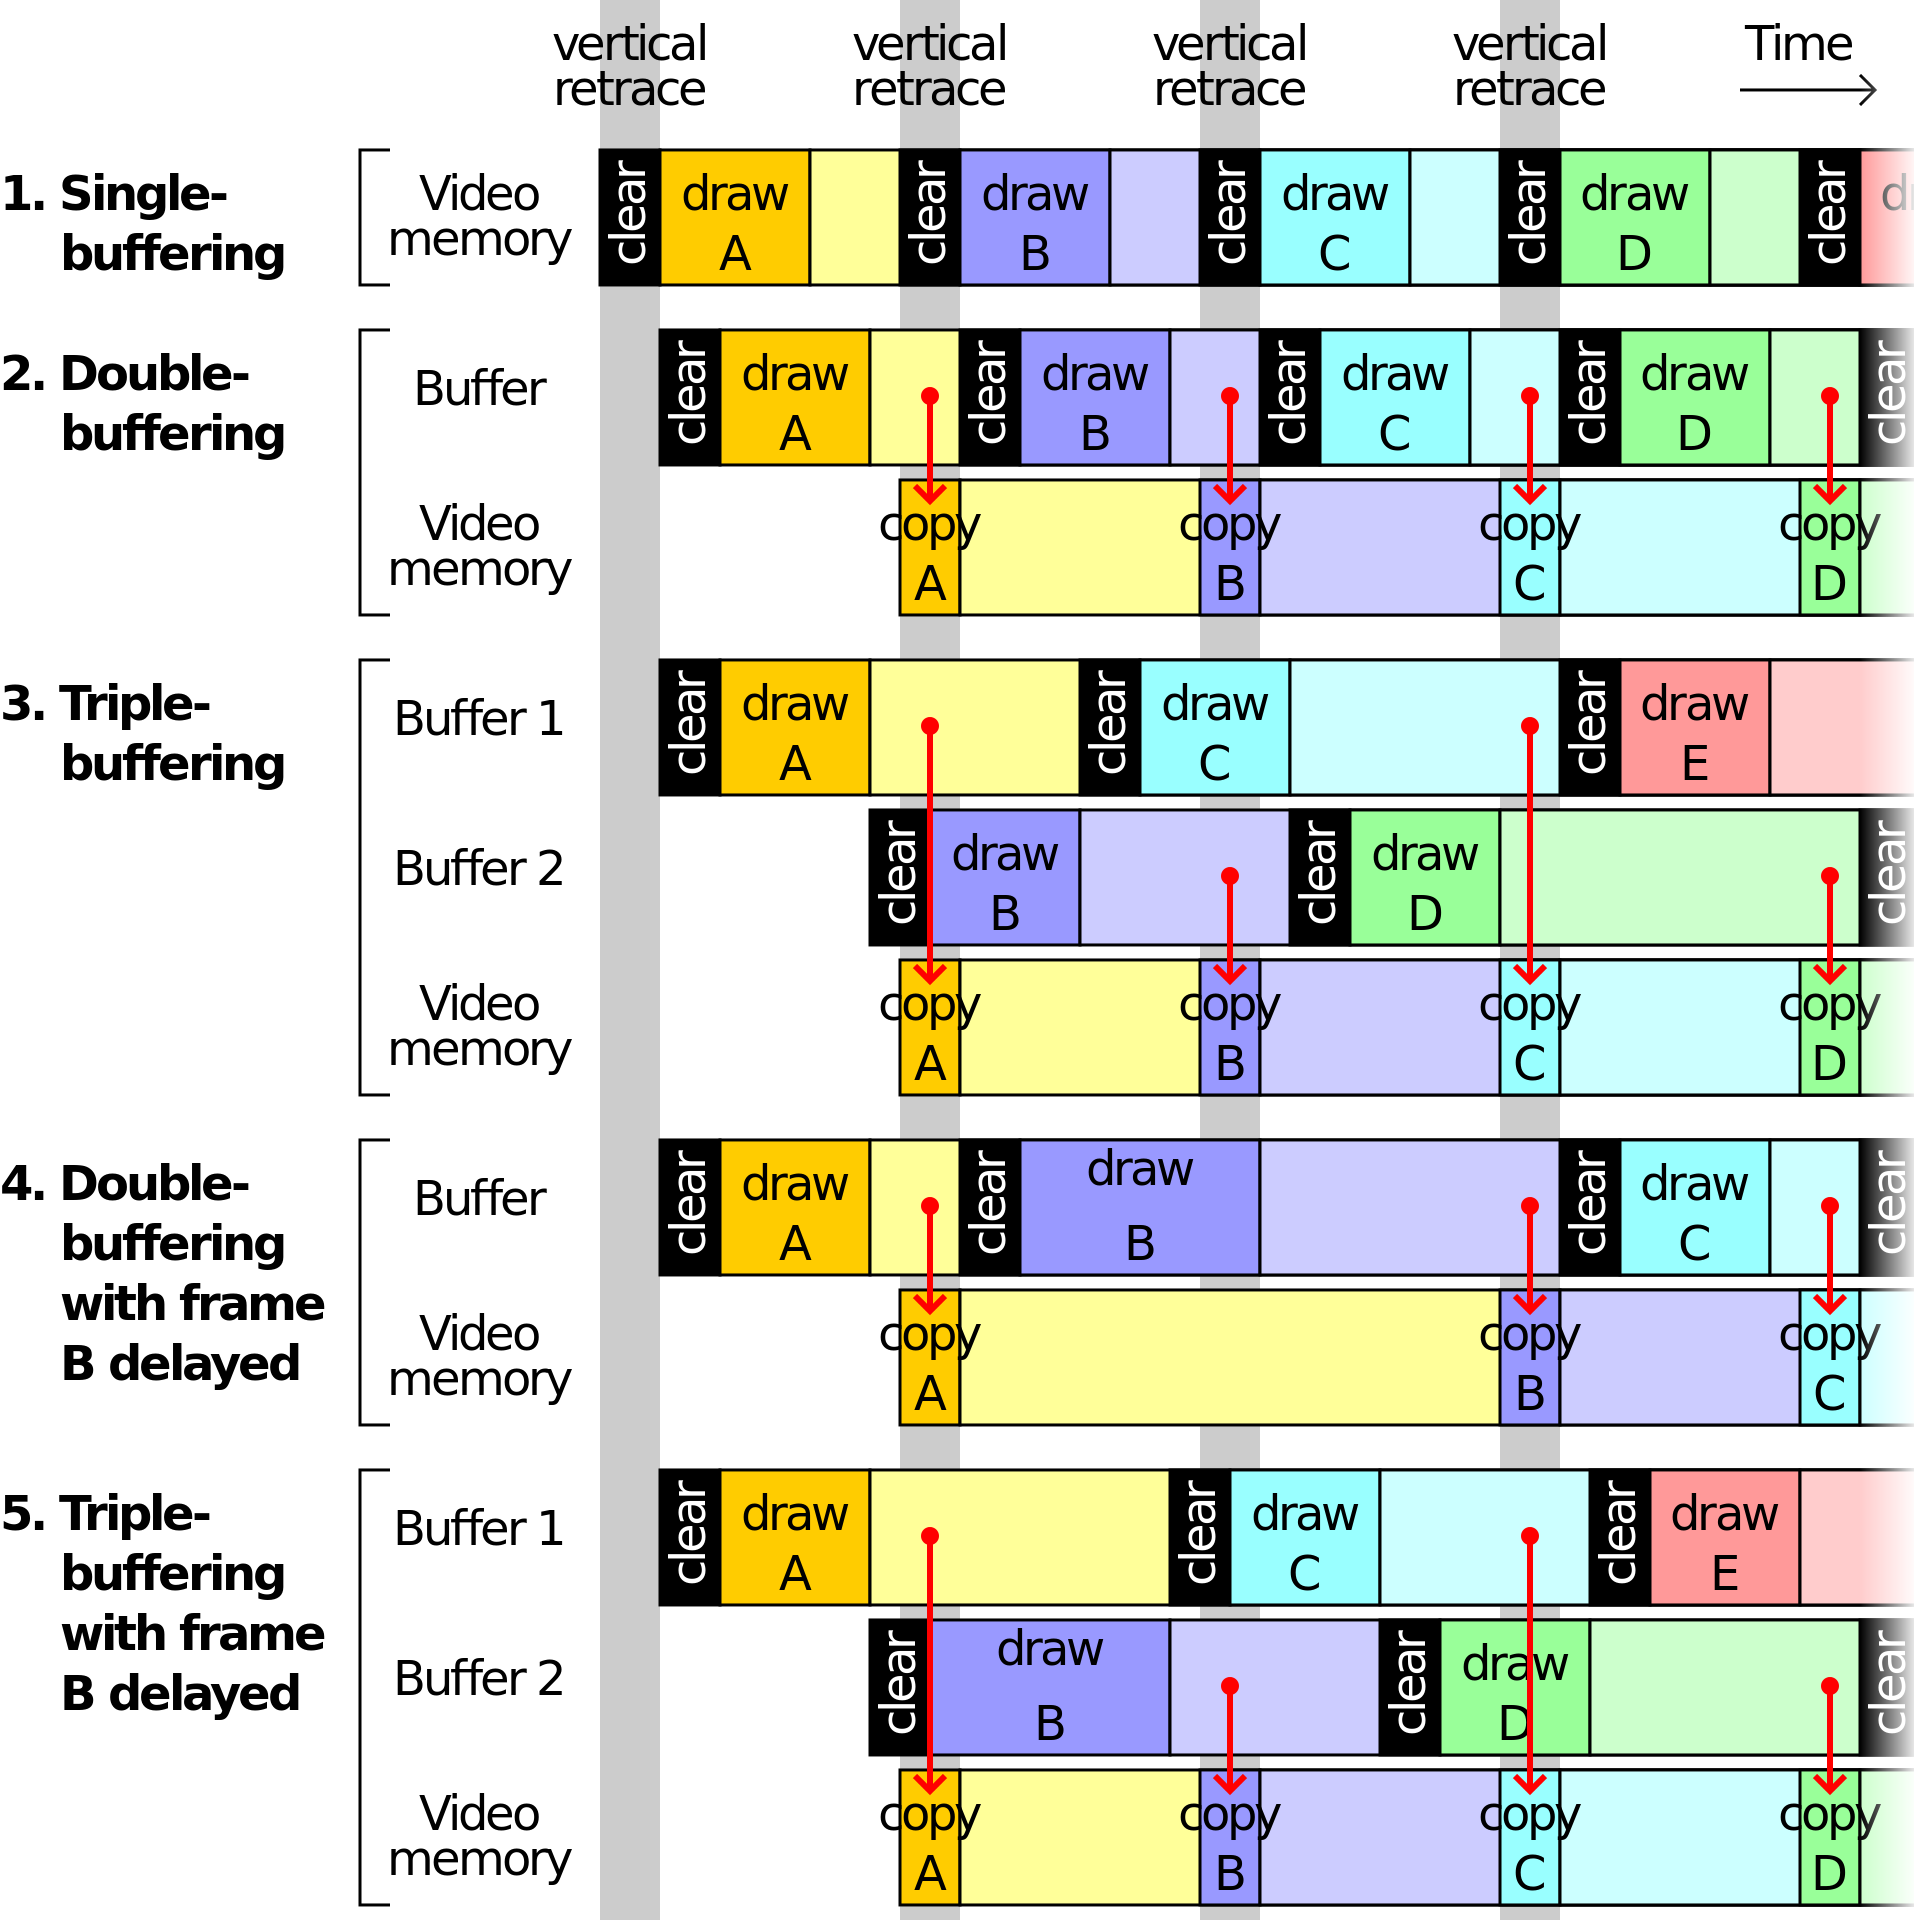
In the case of only one frame buffer, there are efficiency problems in reading and refreshing the frame buffer. In order to solve the efficiency problems, the display system will introduce two buffers, namely double buffer mechanism. In this case, GPU will pre render a frame and put it into the frame buffer for the video controller to read. After the next frame is rendered, GPU will directly point the pointer of the video controller to the second buffer. Improved efficiency.
At present, the double buffer improves the efficiency, but brings new problems: when the video controller has not finished reading, that is, the display part of the screen content, GPU Submit a new rendered frame to another frame buffer and point the pointer of the video controller to the new frame buffer. The video controller will display the lower half of the new frame data on the screen, causing the picture tearing.
To solve this problem, GPU usually has a mechanism called V-Sync. When the V-Sync signal is turned on, GPU will wait until the video controller sends the V-Sync signal before rendering a new frame and updating the frame buffer. These mechanisms solve the problem of tearing the picture and increase the smoothness of the picture. But more computing resources are needed
answering question
Some people may see that "when the vertical sync signal is turned on, the GPU will wait until the video controller sends the V-Sync signal before rendering a new frame and updating the frame buffer". Here they think that the GPU will only render a new frame and update the frame buffer after receiving the V-Sync signal. Does the double buffer lose its meaning?
Imagine a process in which a display shows the first image and the second image. First, in the case of double buffer, GPU first renders a frame image and stores it in the frame buffer, and then makes the pointer of video controller directly in the buffer to display the first frame image. After the content display of the first frame image is completed, the video controller sends V-Sync signal, and the GPU renders the second frame image after receiving the V-Sync signal and points the pointer of the video controller to the second frame buffer.
It seems that the second image is a V-Sync signal sent by the video controller after waiting for the first frame to be displayed. Is it? Is it true? 😭 Of course not. 🐷 Otherwise, double buffer has no meaning
Uncover the secrets. See the picture below
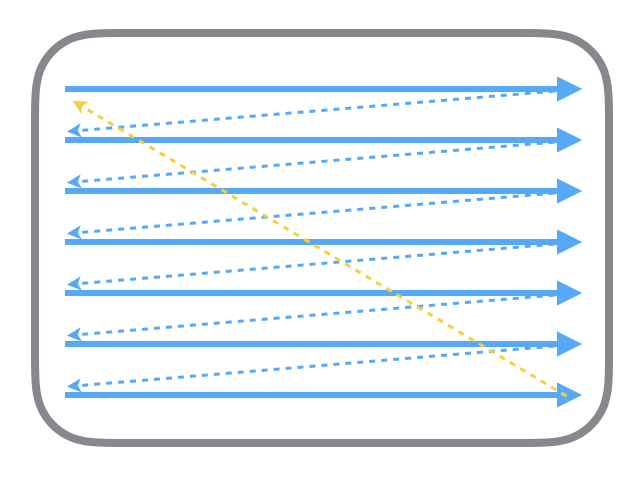
When the first V-Sync signal arrives, first render a frame image and put it into the frame buffer, but do not display it. When the second V-Sync signal is received, read the first rendered result (the video controller's pointer points to the first frame buffer), render a new frame image at the same time and store the result in the second frame buffer, etc. receive the third V-Sync After the signal, read the content of the second frame buffer (the pointer of the video controller points to the second frame buffer), and start the rendering of the third frame image and send it to the first frame buffer, and continue to cycle in turn.
Please check the information, ladder is required: Multiple buffering
2. Causes of carton
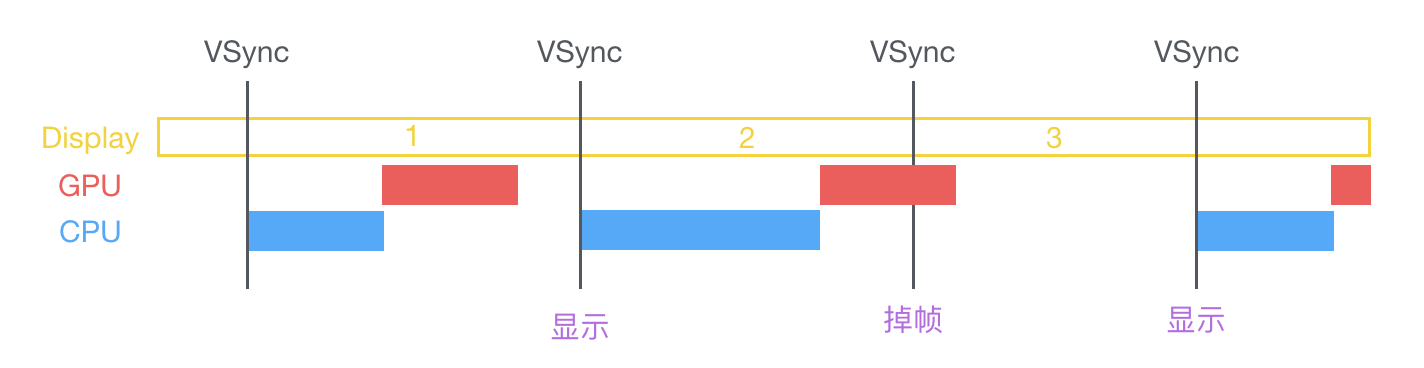
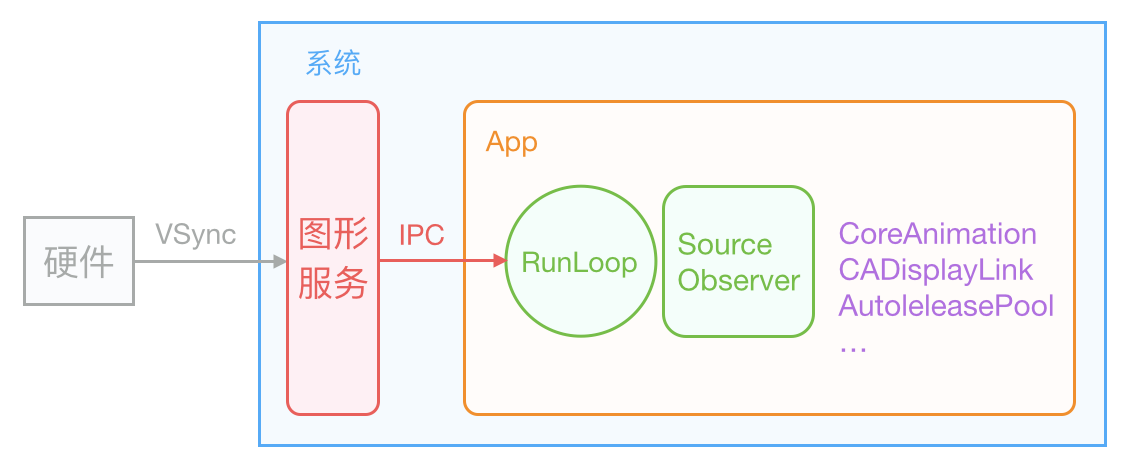
After the VSync signal arrives, the system graphics service will notify the App through CADisplayLink and other mechanisms, and the App main thread starts to calculate the display content (view creation, layout calculation, picture decoding, text drawing, etc.) in the CPU. Then the calculation content is submitted to GPU, which is transformed, synthesized and rendered by layers. Then GPU submits the rendering results to the frame buffer, waiting for the next VSync signal to come and display the rendered results. In the case of the vertical synchronization mechanism, if the CPU or GPU fails to submit the content within a VSync time cycle, the frame will be discarded, waiting for the next opportunity to display again. At this time, the screen is still the previously rendered image, so this is the reason why the CPU and GPU layer interface is stuck.
At present, there are two caching mechanisms and three buffering mechanisms in iOS devices. Android is now the mainstream of three buffering mechanism, and in the early stage, it was a single buffering mechanism.
An example of iOS three buffer mechanism
There are many reasons for CPU and GPU resource consumption, such as frequent creation of objects, attribute adjustment, file reading, view level adjustment, layout calculation (AutoLayout When there are more views, it is more difficult to solve linear equation, picture decoding (reading optimization of large picture), image drawing, text rendering, database reading (reading or writing optimistic lock, pessimistic lock scene), lock use (for example, improper use of spin lock will waste CPU), etc. Developers find the best solution based on their own experience (this is not the focus of this article).
3. How APM monitors and reports Caton
CADisplayLink is definitely not used. This FPS is only for reference. Generally speaking, there are two ways to monitor Caton: monitoring RunLoop status callback and sub thread ping main thread
3.1 RunLoop status monitoring mode
RunLoop is responsible for monitoring the input source for scheduling. For example, network, input device, periodic or delayed event, asynchronous callback, etc. RunLoop receives two types of input sources: one is an asynchronous message (source0 event) from another thread or from different applications, and the other is an event from a scheduled or repeated interval.
The RunLoop status is as follows
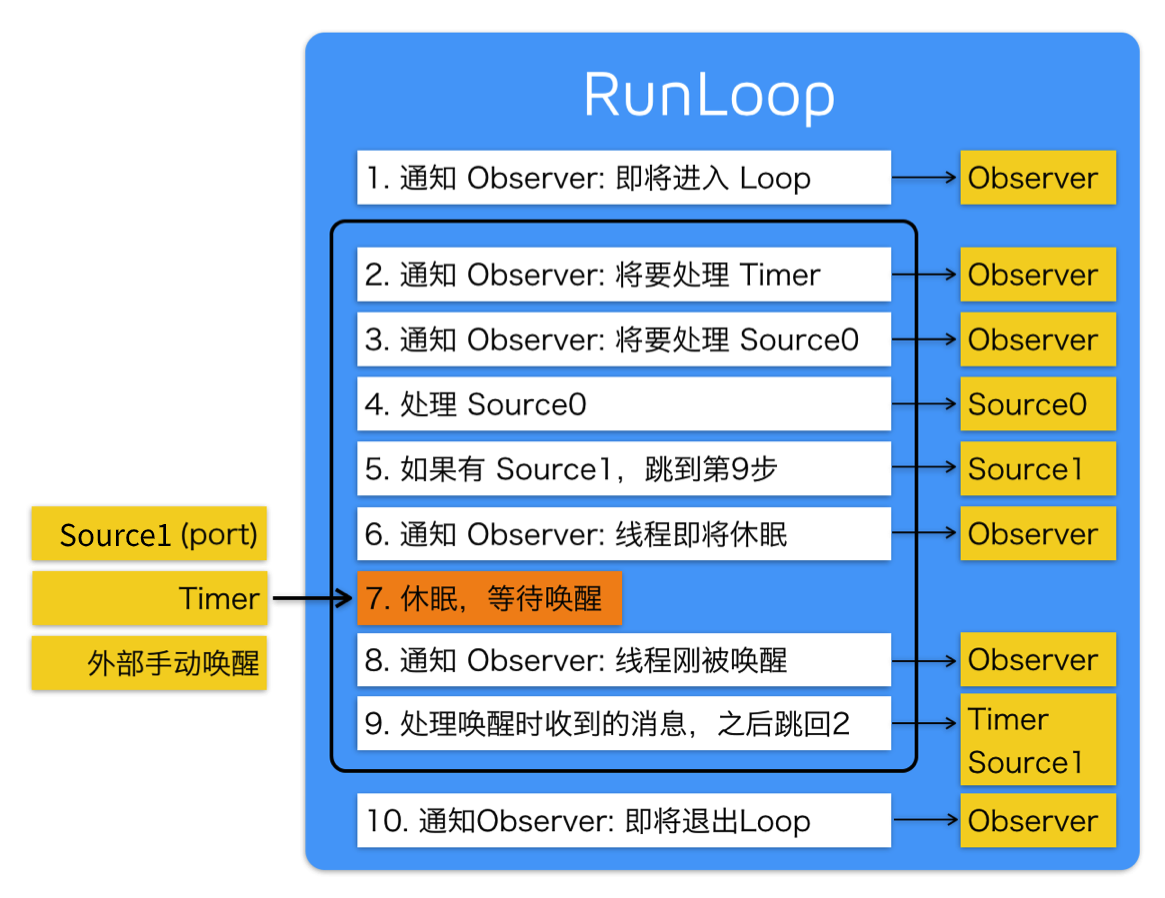
Step 1: inform the Observers that the RunLoop will start to enter the loop, and then enter the loop
if (currentMode->_observerMask & kCFRunLoopEntry )
    // Notify observers that runloop is about to enter the loop
    __CFRunLoopDoObservers(rl, currentMode, kCFRunLoopEntry);
// Enter loop
result = __CFRunLoopRun(rl, currentMode, seconds, returnAfterSourceHandled, previousMode);
Step 2: start the do while loop to keep the thread alive, notify the Observers, run loop to trigger Timer callback and Source0 callback, and then execute the added block
 if (rlm->_observerMask & kCFRunLoopBeforeTimers)
    //  Notify Observers: RunLoop is about to trigger Timer callback
    __CFRunLoopDoObservers(rl, rlm, kCFRunLoopBeforeTimers);
if (rlm->_observerMask & kCFRunLoopBeforeSources)
    //  Notify Observers: RunLoop is about to trigger the Source callback
    __CFRunLoopDoObservers(rl, rlm, kCFRunLoopBeforeSources);
// Execute the added block
__CFRunLoopDoBlocks(rl, rlm);
Step 3: after the RunLoop triggers the Source0 callback, if Source1 is ready, it will jump to handle_msg to process the message.
//  If Source1 (port based) is in the ready state, process this Source1 directly and jump to process the message
if (MACH_PORT_NULL != dispatchPort && !didDispatchPortLastTime) {
#if DEPLOYMENT_TARGET_MACOSX || DEPLOYMENT_TARGET_EMBEDDED || DEPLOYMENT_TARGET_EMBEDDED_MINI
    msg = (mach_msg_header_t *)msg_buffer;

    if (__CFRunLoopServiceMachPort(dispatchPort, &msg, sizeof(msg_buffer), &livePort, 0, &voucherState, NULL)) {
        goto handle_msg;
    }
#elif DEPLOYMENT_TARGET_WINDOWS
    if (__CFRunLoopWaitForMultipleObjects(NULL, &dispatchPort, 0, 0, &livePort, NULL)) {
        goto handle_msg;
    }
#endif
}
Step 4: after the callback is triggered, notify the Observers that they are going to sleep
Boolean poll = sourceHandledThisLoop || (0ULL == timeout_context->termTSR);
// Notify observers that the thread of runloop is about to enter sleep
if (!poll && (rlm->_observerMask & kCFRunLoopBeforeWaiting)) __CFRunLoopDoObservers(rl, rlm, kCFRunLoopBeforeWaiting);
    __CFRunLoopSetSleeping(rl);
Step 5: after entering sleep, you will wait for mach_port message to wake up again. Only the following four situations can be awakened again.
- port based source events
- Timer time is up
- RunLoop timeout
- Awakened by callee
do {
    if (kCFUseCollectableAllocator) {
        // objc_clear_stack(0);
        // <rdar://problem/16393959>
        memset(msg_buffer, 0, sizeof(msg_buffer));
    }
    msg = (mach_msg_header_t *)msg_buffer;

    __CFRunLoopServiceMachPort(waitSet, &msg, sizeof(msg_buffer), &livePort, poll ? 0 : TIMEOUT_INFINITY, &voucherState, &voucherCopy);

    if (modeQueuePort != MACH_PORT_NULL && livePort == modeQueuePort) {
        // Drain the internal queue. If one of the callout blocks sets the timerFired flag, break out and service the timer.
        while (_dispatch_runloop_root_queue_perform_4CF(rlm->_queue));
        if (rlm->_timerFired) {
            // Leave livePort as the queue port, and service timers below
            rlm->_timerFired = false;
            break;
        } else {
            if (msg && msg != (mach_msg_header_t *)msg_buffer) free(msg);
        }
    } else {
        // Go ahead and leave the inner loop.
        break;
    }
} while (1);
Step 6: notify the Observer when waking up. The thread of RunLoop has just been woken up
// Notify observers that the thread of runloop has just been woken up
if (!poll && (rlm->_observerMask & kCFRunLoopAfterWaiting)) __CFRunLoopDoObservers(rl, rlm, kCFRunLoopAfterWaiting);
    // Processing messages
    handle_msg:;
    __CFRunLoopSetIgnoreWakeUps(rl);
Step 7: after RunLoop wakes up, process the message received during wakeup
- If Timer time is up, trigger Timer's callback
- If it is a dispatch, execute block
- If it is a source1 event, handle this event
#if USE_MK_TIMER_TOO
        // If a Timer reaches the time, trigger the Timer's callback
        else if (rlm->_timerPort != MACH_PORT_NULL && livePort == rlm->_timerPort) {
            CFRUNLOOP_WAKEUP_FOR_TIMER();
            // On Windows, we have observed an issue where the timer port is set before the time which we requested it to be set. For example, we set the fire time to be TSR 167646765860, but it is actually observed firing at TSR 167646764145, which is 1715 ticks early. The result is that, when __CFRunLoopDoTimers checks to see if any of the run loop timers should be firing, it appears to be 'too early' for the next timer, and no timers are handled.
            // In this case, the timer port has been automatically reset (since it was returned from MsgWaitForMultipleObjectsEx), and if we do not re-arm it, then no timers will ever be serviced again unless something adjusts the timer list (e.g. adding or removing timers). The fix for the issue is to reset the timer here if CFRunLoopDoTimers did not handle a timer itself. 9308754
            if (!__CFRunLoopDoTimers(rl, rlm, mach_absolute_time())) {
                // Re-arm the next timer
                __CFArmNextTimerInMode(rlm, rl);
            }
        }
#endif
        //  If there is a dispatch to main_ Block of queue, execute block
        else if (livePort == dispatchPort) {
            CFRUNLOOP_WAKEUP_FOR_DISPATCH();
            __CFRunLoopModeUnlock(rlm);
            __CFRunLoopUnlock(rl);
            _CFSetTSD(__CFTSDKeyIsInGCDMainQ, (void *)6, NULL);
#if DEPLOYMENT_TARGET_WINDOWS
            void *msg = 0;
#endif
            __CFRUNLOOP_IS_SERVICING_THE_MAIN_DISPATCH_QUEUE__(msg);
            _CFSetTSD(__CFTSDKeyIsInGCDMainQ, (void *)0, NULL);
            __CFRunLoopLock(rl);
            __CFRunLoopModeLock(rlm);
            sourceHandledThisLoop = true;
            didDispatchPortLastTime = true;
        }
        // If a source 1 (port based) issues an event, handle the event
        else {
            CFRUNLOOP_WAKEUP_FOR_SOURCE();

            // If we received a voucher from this mach_msg, then put a copy of the new voucher into TSD. CFMachPortBoost will look in the TSD for the voucher. By using the value in the TSD we tie the CFMachPortBoost to this received mach_msg explicitly without a chance for anything in between the two pieces of code to set the voucher again.
            voucher_t previousVoucher = _CFSetTSD(__CFTSDKeyMachMessageHasVoucher, (void *)voucherCopy, os_release);

            CFRunLoopSourceRef rls = __CFRunLoopModeFindSourceForMachPort(rl, rlm, livePort);
            if (rls) {
#if DEPLOYMENT_TARGET_MACOSX || DEPLOYMENT_TARGET_EMBEDDED || DEPLOYMENT_TARGET_EMBEDDED_MINI
        mach_msg_header_t *reply = NULL;
        sourceHandledThisLoop = __CFRunLoopDoSource1(rl, rlm, rls, msg, msg->msgh_size, &reply) || sourceHandledThisLoop;
        if (NULL != reply) {
            (void)mach_msg(reply, MACH_SEND_MSG, reply->msgh_size, 0, MACH_PORT_NULL, 0, MACH_PORT_NULL);
            CFAllocatorDeallocate(kCFAllocatorSystemDefault, reply);
        }
#elif DEPLOYMENT_TARGET_WINDOWS
                sourceHandledThisLoop = __CFRunLoopDoSource1(rl, rlm, rls) || sourceHandledThisLoop;
#endif
Step 8: judge whether to enter the next loop according to the current RunLoop status. When it is forced to stop or the loop times out, it will not continue to the next loop, otherwise it will enter the next loop
if (sourceHandledThisLoop && stopAfterHandle) {
    // When entering the loop, the parameter says that after handling the event, it will return
    retVal = kCFRunLoopRunHandledSource;
    } else if (timeout_context->termTSR < mach_absolute_time()) {
        // Timeout exceeded for incoming parameter token
        retVal = kCFRunLoopRunTimedOut;
} else if (__CFRunLoopIsStopped(rl)) {
        __CFRunLoopUnsetStopped(rl);
    // Forced to stop by an external caller
    retVal = kCFRunLoopRunStopped;
} else if (rlm->_stopped) {
    rlm->_stopped = false;
    retVal = kCFRunLoopRunStopped;
} else if (__CFRunLoopModeIsEmpty(rl, rlm, previousMode)) {
    // No source/timer
    retVal = kCFRunLoopRunFinished;
}
For complete and annotated RunLoop code, see here . Source1 is used by RunLoop to handle system events from Mach port, and Source0 is used to handle user events. After receiving the system event of source1, it essentially calls the handler of Source0 event.
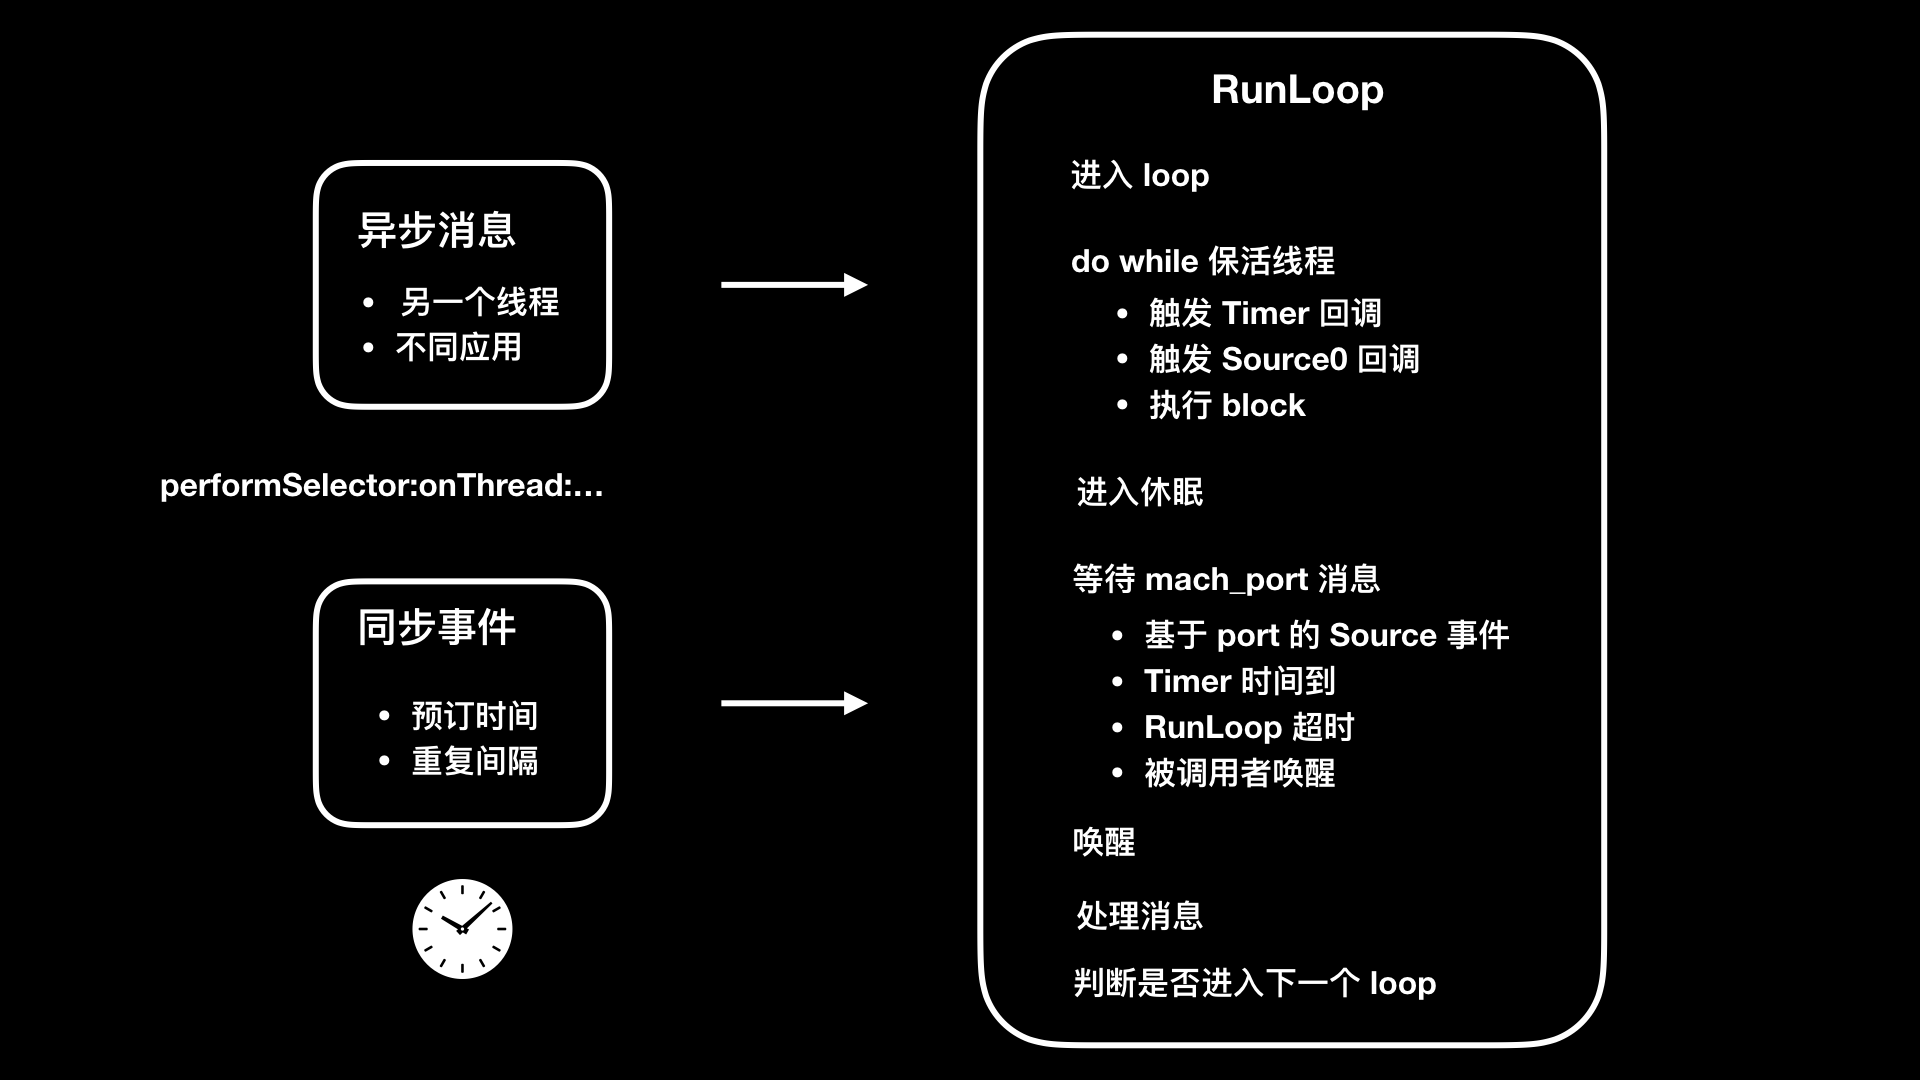
RunLoop 6 states
typedef CF_OPTIONS(CFOptionFlags, CFRunLoopActivity) {
    kCFRunLoopEntry ,           // Enter loop
    kCFRunLoopBeforeTimers ,    // Trigger Timer callback
    kCFRunLoopBeforeSources ,   // Trigger Source0 callback
    kCFRunLoopBeforeWaiting ,   // Wait for mach_port message
    kCFRunLoopAfterWaiting ),   // Receive mach_port message
    kCFRunLoopExit ,            // Exit loop
    kCFRunLoopAllActivities     // All status changes of loop
}
RunLoop will block the thread if the method before entering sleep takes too long to execute, or if the thread wakes up and receives messages for too long to enter the next step. If it's the main thread, it's stuck.
Once it is found that the state of KCFRunLoopBeforeSources before sleep or KCFRunLoopAfterWaiting after wake-up does not change within the set time threshold, it can be judged as stuck. At this time, dump the stack information, restore the crime scene, and then solve the problem of stuck.
Start a subthread to continuously loop to check whether it is stuck. It is considered to be stuck after n times of exceeding the threshold value. After being stuck, stack dump and report (with certain mechanism, data processing will be discussed in the next part).
WatchDog has different values in different states.
- Launch: 20s
- Resume: 10s
- Suspend: 10s
- Quit: 6s
- Background: 3min (10min can be applied before iOS7; changed to 3min later; can be applied continuously, up to 10min)
The Caton threshold is set based on the WatchDog mechanism. The threshold value in the APM system needs to be less than the WatchDog value, so the value range is between [1, 6]. The industry usually chooses 3 seconds.
Through long dispatch_ semaphore_ wait(dispatch_ semaphore_ t dsema, dispatch_ time_ Return zero on success, or non zero if the timeout occurred.
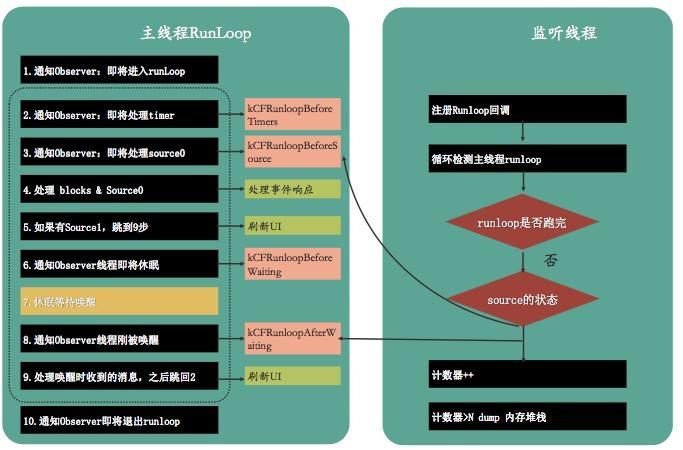
Many people may wonder why KCFRunLoopBeforeSources and KCFRunLoopAfterWaiting are selected when there are so many RunLoop states? Because most of them are between kcfrunloop before sources and kcfrunloop after waiting. For example, App internal events of type Source0
The flow chart of Runloop detection is as follows:
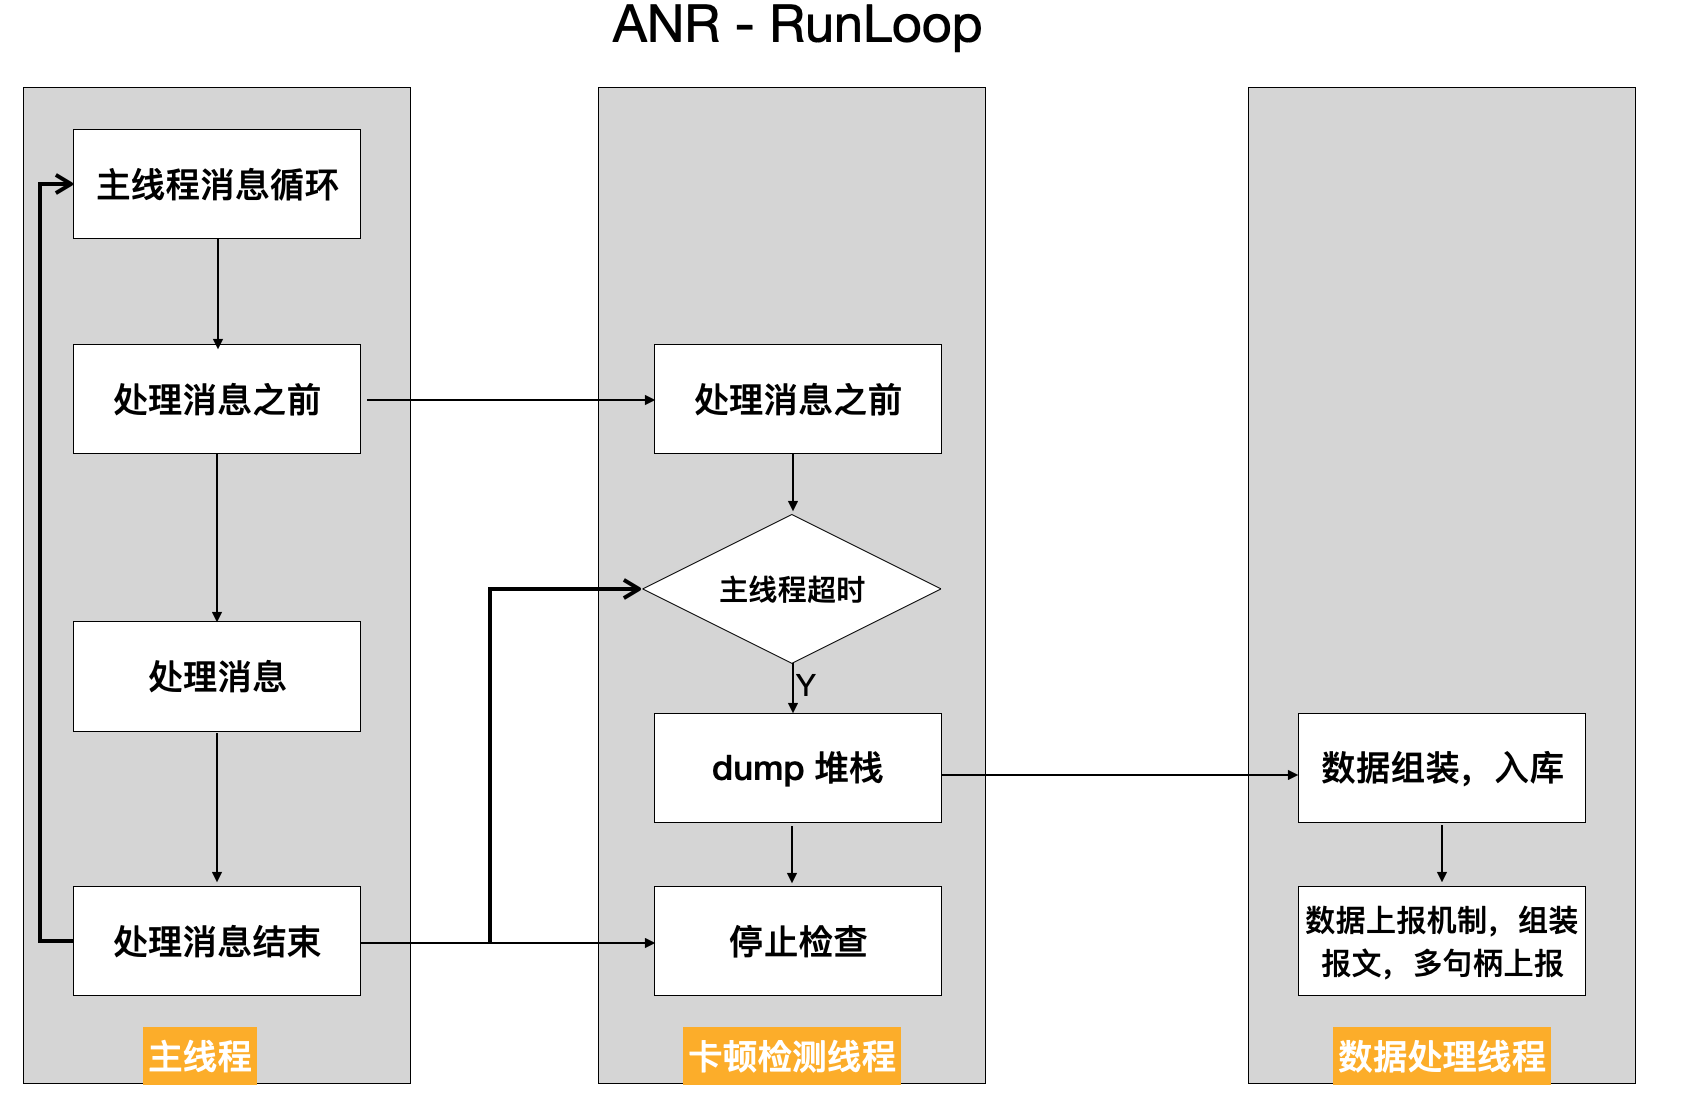
The key codes are as follows:
// Set the running environment of Runloop observer
CFRunLoopObserverContext context = {0, (__bridge void *)self, NULL, NULL};
// Create a Runloop observer object
_observer = CFRunLoopObserverCreate(kCFAllocatorDefault,
                                    kCFRunLoopAllActivities,
                                    YES,
                                    0,
                                    &runLoopObserverCallBack,
                                    &context);
// Add the new observer to the runloop of the current thread
CFRunLoopAddObserver(CFRunLoopGetMain(), _observer, kCFRunLoopCommonModes);
// Create signal
_semaphore = dispatch_semaphore_create(0);

__weak __typeof(self) weakSelf = self;
// Monitoring time in child thread
dispatch_async(dispatch_get_global_queue(0, 0), ^{
    __strong __typeof(weakSelf) strongSelf = weakSelf;
    if (!strongSelf) {
        return;
    }
    while (YES) {
        if (strongSelf.isCancel) {
            return;
        }
        // N times of stuck over threshold T is recorded as one stuck
        long semaphoreWait = dispatch_semaphore_wait(self->_semaphore, dispatch_time(DISPATCH_TIME_NOW, strongSelf.limitMillisecond * NSEC_PER_MSEC));
        if (semaphoreWait != 0) {
            if (self->_activity == kCFRunLoopBeforeSources || self->_activity == kCFRunLoopAfterWaiting) {
                if (++strongSelf.countTime < strongSelf.standstillCount){
                    continue;
                }
                // Stack information dump and data reporting mechanism are combined to upload data to the server according to certain strategies. Stack dump is explained below. Data reporting will create powerful, flexible and configurable data reporting components in( https://github.com/FantasticLBP/knowledge-kit/blob/master/Chapter1%20-%20iOS/1.80.md )Talk about
            }
        }
        strongSelf.countTime = 0;
    }
});
3.2 sub thread ping main thread listening mode
Start a sub thread and create a semaphore with an initial value of 0 and a boolean type flag bit with an initial value of YES. Send the task with flag set to NO to the main thread, and determine whether the flag is successful by the main thread (the value is NO) after the time is up. If it is not successful, it is considered that the pig thread is stuck. At this time, dump stack information and data reporting mechanism are combined to upload data to the server according to certain policies. Data reporting will be done in Build a powerful, flexible and configurable data reporting component speak
while (self.isCancelled == NO) {
        @autoreleasepool {
            __block BOOL isMainThreadNoRespond = YES;

            dispatch_semaphore_t semaphore = dispatch_semaphore_create(0);

            dispatch_async(dispatch_get_main_queue(), ^{
                isMainThreadNoRespond = NO;
                dispatch_semaphore_signal(semaphore);
            });

            [NSThread sleepForTimeInterval:self.threshold];

            if (isMainThreadNoRespond) {
                if (self.handlerBlock) {
                    self.handlerBlock(); // External dump stack inside the block (to be discussed below), data reporting
                }
            }

            dispatch_semaphore_wait(semaphore, DISPATCH_TIME_FOREVER);
        }
    }
4. Stack dump
Getting the method stack is a hassle. Think about it. [NSThread callStackSymbols] can get the call stack of the current thread. But when monitoring the occurrence of Caton, there is no way to get the stack information of the main thread. The path from any thread back to the main thread doesn't work. Do a knowledge review first.
In computer science, call stack is a stack type data structure used to store thread information about computer programs. This kind of stack is also called execution stack, program stack, control stack, runtime stack, machine stack, etc. The subroutine used by the call stack to trace each activity should return a point of control after execution.
Wikipedia found a picture and an example of "Call Stack", as follows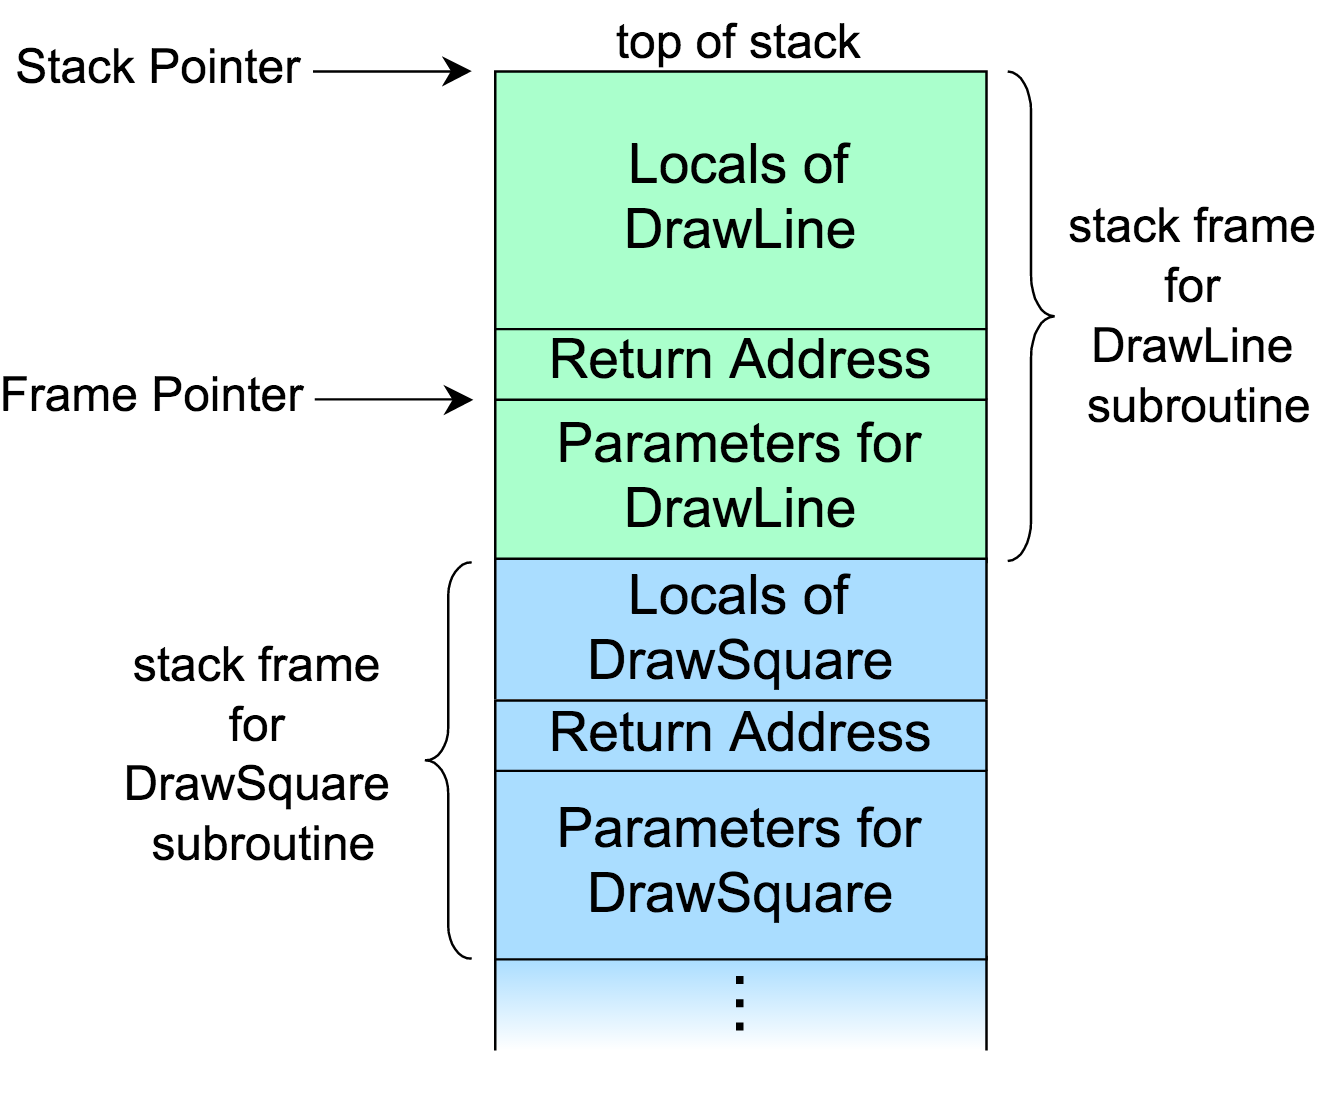
The image above shows a stack. It is divided into several stack frames, each of which corresponds to a function call. The blue part below represents the DrawSquare function, which invokes the DrawLine function in the process of execution and uses the green part.
It can be seen that stack frame consists of three parts: function parameter, return address and local variable. For example, DrawLine function is called in DrawSquare: first, the parameters required by DrawLine function are pushed into the stack; second, the return address (control information). For example: function A calls function B, and the address of the next line of code that calls function B is the return address) is pushed into the stack; local variables in the third function are also stored in the stack.
Stack Pointer indicates the top of the current stack. Most operating systems are stack down, so Stack Pointer is the minimum value. In the address pointed to by Frame Pointer, the value of the last Stack Pointer is stored, that is, the return address.
In most operating systems, each stack frame also stores the Frame Pointer of the previous stack frame. Therefore, if you know the stack point and frame point of the current stack frame, you can continuously backtrack and recursively obtain the frame at the bottom of the stack.
The next step is to get the stack point and frame point of all threads. Then go back to the scene of the crime.
5. Mach Task knowledge
Mach task:
When an App is running, it corresponds to a Mach Task, and there may be multiple threads executing tasks at the same time under the Task. In OS X and iOS Kernel Programming, Mach Task is described as: Task is a container object, through which virtual memory space and other resources are managed, including devices and other handles. Simply summarized as: Mack task is a machine independent thread execution environment abstraction.
Function: task can be understood as a process, including its thread list.
Structure: task_threads, set target_ All threads under the task task are saved in Act_ In the list array, the number of arrays is act_listCnt
kern_return_t task_threads
(
  task_t traget_task,
  thread_act_array_t *act_list,                     //Thread pointer list
  mach_msg_type_number_t *act_listCnt  //Number of threads
)
thread_info:
kern_return_t thread_info
(
  thread_act_t target_act,
  thread_flavor_t flavor,
  thread_info_t thread_info_out,
  mach_msg_type_number_t *thread_info_outCnt
);
How to get the stack data of a thread:
System method kern_return_t task_threads(task_inspect_t target_task, thread_act_array_t *act_list, mach_msg_type_number_t *act_listCnt); all threads can be obtained, but the thread information obtained by this method is the lowest Mach thread.
For each thread, Kern can be used_ return_ t thread_ get_ state(thread_ act_ t target_ act, thread_ state_ flavor_ t flavor, thread_ state_ t old_ state, mach_ msg_ type_ number_ t *old_ Statecnt); method gets all its information, which is filled in the_ STRUCT_ Among the parameters of type mcontext, there are two parameters in this method that vary with the CPU architecture. So we need to define the difference between different CPUs of macro mask.
_STRUCT_MCONTEXTIn the structure, the current thread's Stack Pointer And the top stack frame Frame pointer,It then traces back the entire thread call stack.But the above method gets the kernel thread, and the information we need is NSThread,So you need to convert the kernel thread to NSThread.
pthread Of p yes POSIX Abbreviation for「Portable operating system interface」(Portable Operating System Interface). The original intention of the design is that each system has its own thread model, and different systems operate on threads API It's not the same. therefore POSIX The goal is to provide abstract pthread And related API. these ones here API There are different implementations in different operating systems, but the functions are the same.
Unix System provided
task_threadsandthread_get_stateThe kernel system is operated by each kernel thread thread_t Of type id Unique identification. pthread The only identification of is pthread_t Type. Where kernel threads and pthread Transformation of (i.e thread_t and pthread_t)It's easy because pthread The original intention of the design is「Abstract kernel thread」.
memorystatus_action_neededpthread_createMethod to create a thread nsthreadLauncher.static void *nsthreadLauncher(void* thread) { NSThread *t = (NSThread*)thread; [nc postNotificationName: NSThreadDidStartNotification object:t userInfo: nil]; [t _setName: [t name]]; [t main]; [NSThread exit]; return NULL; }
Nsthreaddidstartnotification is actually the string @ "_ NSThreadDidStartNotification".
<NSThread: 0x...>{number = 1, name = main}
In order to match the NSThread with the kernel thread, you can only match one by one through name. Pthread API pthread_getname_np can also get the kernel thread name. np stands for not POSIX, so it cannot be used across platforms.
The idea is as follows: store the original name of NSThread, change the name to a random number (time stamp), and then traverse the name of kernel thread pthread. When the name matches, NSThread corresponds to kernel thread. When found, the thread name will be restored to its original name. For the main thread, pthread cannot be used_ getname_ NP, so get the thread in the load method of the current code_ t. Then match the name.
static mach_port_t main_thread_id;
+ (void)load {
    main_thread_id = mach_thread_self();
}
2, App start time monitoring
1. Monitoring of APP startup time
Application startup time is one of the important factors affecting user experience, so we need to quantify how fast an App starts. Start up is divided into cold start and hot start.
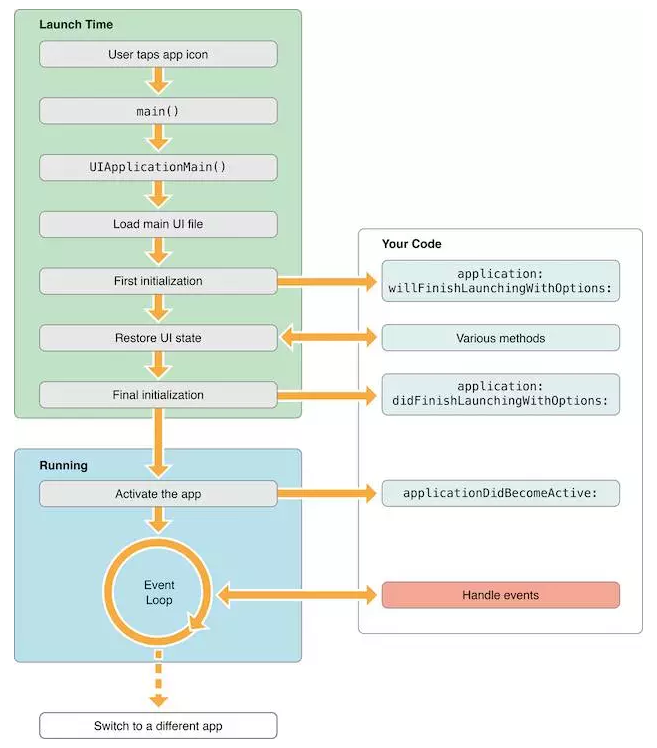
Cold start: App is not running, you must load and build the whole App. Finish initializing the App. There is a large optimization space for cold start. The cold start time is calculated from the application: didFinishLaunchingWithOptions: method. The App usually performs basic initialization of various SDK s and apps here.
Hot start: the application has been running in the background (common scenarios: for example, the user clicks the Home key and then opens the App when using the App). Because some events wake up the App to the foreground, the App will accept the events that the App enters the foreground in the applicationwillenterforegroup: method
The idea is relatively simple. as follows
- Get the current time value in the load method of the monitoring class
- Listen for the notice uiapplicationdidfinishlaunchinginotification after the App is started
- Get the current time after receiving the notice
- The time difference between steps 1 and 3 is the App startup time.
mach_absolute_time is a CPU / bus dependent function that returns the number of CPU clock cycles. It does not increase when the system sleeps. It's a nanosecond number. After 2 nanoseconds before and after acquisition, it needs to be converted to second. Need a system time-based benchmark, via mach_timebase_info.
mach_timebase_info_data_t g_cmmStartupMonitorTimebaseInfoData = 0;
mach_timebase_info(&g_cmmStartupMonitorTimebaseInfoData);
uint64_t timelapse = mach_absolute_time() - g_cmmLoadTime;
double timeSpan = (timelapse * g_cmmStartupMonitorTimebaseInfoData.numer) / (g_cmmStartupMonitorTimebaseInfoData.denom * 1e9);
2. Online monitoring of start-up time is good, but the start-up time needs to be optimized in the development stage.
To optimize the start-up time, we need to know what has been done in the start-up phase, and make plans for the current situation.
The pre main stage is defined as the stage from the start of App to the system call of main function; the main stage is defined as the viewdidappearance from the main function entry to the main UI framework.
App launch process:
- Analysis Info.plist : load relevant information, such as flash screen; sandbox establishment and permission check;
- Mach-O loading: if it is a fat binary file, look for the part suitable for the current CPU architecture; load all dependent Mach-O files (recursively call the method of Mach-O loading); define internal and external pointer references, such as strings, functions, etc.; load the methods in the classification; load c + + static objects, call the + load() function of Objc; execute the declaration as__ attribute_ c function of ((constructor));
- Program execution: call main(); call UIApplicationMain(); call applicationWillFinishLaunching();
Pre main stage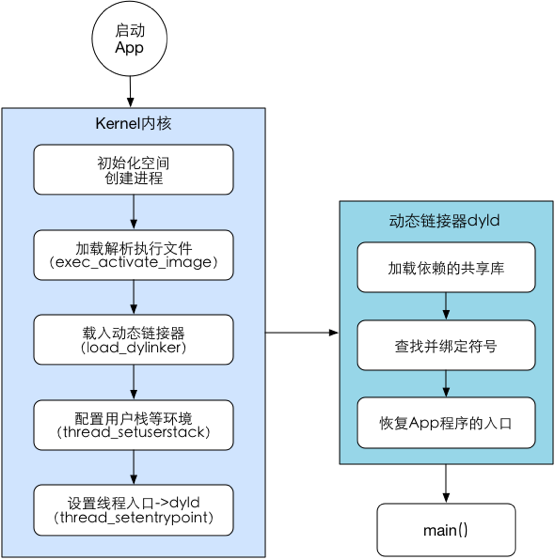
Main stage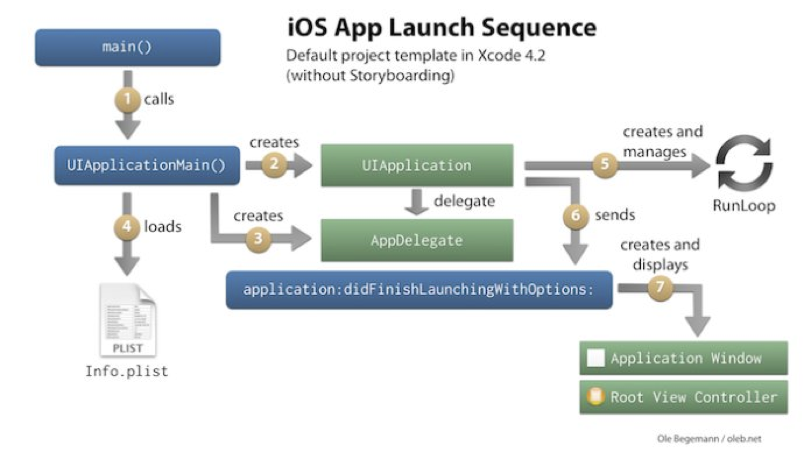
2.1 loading Dylib
For the loading of each dynamic library, dyld needs to
- Dynamic library on which analysis depends
- Find the Mach-O file for the dynamic library
- Open file
- Validation file
- Register file signature in system core
- Call mmap() on each segment of the dynamic library
Optimization:
- Reduce dependence on non system libraries
- Use static rather than dynamic libraries
- Merge non system dynamic library into a dynamic library
2.2 Rebase && Binding
Optimization:
- Reduce the number of Objc classes and selector s, and delete unused classes and functions
- Reduce the number of c + + virtual functions
- Switch to Swift struct (essentially reducing the number of symbols)
2.3 Initializers
Optimization:
- Use + initialize instead of + load
- Do not use attribute*((constructor)) to mark the method display as an initializer, but let it execute when the method is called. For example, using dispatch_one,pthread_once() or std::once(). In other words, it is initialized only when it is used for the first time, which delays part of the work time and tries not to use static objects of c + +
2.4 pre main stage influencing factors
- The more dynamic libraries are loaded, the slower they start.
- The more ObjC classes and functions, the slower the startup.
- The larger the executable, the slower the startup.
- The more constructor functions in C, the slower the startup.
- The more static objects in C + +, the slower to start.
- The more + load ObjC has, the slower it starts.
Optimization means:
- Reduce dependence on unnecessary libraries, whether dynamic or static; transform dynamic libraries into static ones if possible; merge multiple non system dynamic libraries into one
- Check that the framework should be set to optional and required. If the framework exists in all iOS system versions supported by the current App, then it should be set to required. Otherwise, it should be set to optional, because there will be some additional checks
- Merge or delete some OC classes and functions. For cleaning up the classes not used in the project, use the AppCode code code check function to find the classes not used in the current project (it can also be analyzed according to the linkmap file, but the accuracy is not very high)
There is one called FUI The only problem is that it can't deal with the classes provided by dynamic and static libraries, and can't deal with the class templates of C + +
- Delete some useless static variables
- Prune methods that have not been called or have been discarded
- Delay what you don't have to do in the + load method to + initialize, and try not to use C + + virtual functions (creating virtual function tables is expensive)
- Class and method names should not be too long: each class and method name in iOS__ The corresponding string values are stored in the cstring segment, so the length of class and method names also affects the size of the executable
Because it is also the dynamic feature of Object-c, it needs to find the class / method through class / method name reflection to call, and the Object-c object model will save the class / method name string;
- Using dispatch_once() replaces all attribute((constructor)) functions, C + + static object initialization, and ObjC + load functions;
- Compressing the size of the image within the acceptable range of the designer will bring unexpected benefits.
Why can compressed pictures speed up startup? Because it's normal to load a dozen or so large and small images at startup,
If the image is small, the IO operation will be small, and the startup will be fast. The more reliable compression algorithm is TinyPNG.
2.5 main stage optimization
- Reduce the process of initiating initialization. If it can be lazy, it will be lazy. If it can be lazy, it will be lazy. If it can be delayed, it will be delayed. It is not necessary to start the main thread of the card. The business code that has been offline will be deleted directly
- Optimize code logic. Remove unnecessary logic and code to reduce the time consumed by each process
- In the start-up phase, multithreading is used to initialize to maximize CPU performance
- Use pure code instead of xib or storyboard to describe the UI, especially the main UI framework, such as TabBarController. Because xib and storyboard still need to be parsed into code to render the page, a step more.
3, CPU usage monitoring
1. CPU architecture
CPU (Central Processing Unit) central processor. The mainstream architectures in the market include ARM (arm64), Intel (x86), AMD, etc. Intel uses CISC (Complex Instruction Set Computer) and ARM uses RISC (Reduced Instruction Set Computer). The difference lies in different CPU design concepts and methods.
In the early days, all CPUs were CISC architecture, which was designed to complete the required computing tasks with the least machine language instructions. For example, for multiplication, on the CPU of CISC architecture. An instruction MUL ADDRA, ADDRB can multiply the memory ADDRA and the data in the memory ADDRB, and store the result in the ADDRA. What we do is: read the data in ADDRA and ADDRB into the register, and the operation of writing the result of multiplication into the memory depends on the CPU design, so CISC architecture will increase the complexity of CPU and the requirements of CPU technology.
RISC architecture requires software to specify each operation step. For example, the above multiplication instructions are implemented as MOVE A, ADDRA; MOVE B, ADDRB; MUL A, B; STR ADDRA, A;. This architecture can reduce the complexity of CPU and allow more powerful CPU to be produced at the same level of technology, but it has higher requirements for compiler design.
At present, most iPhone s in the market are based on arm64 architecture. And the energy consumption of arm architecture is low.
2. Get thread information
After that, how to monitor CPU utilization
- Turn on the timer and continue to execute the following logic according to the set cycle
- Get the current task. Get all thread information (number of threads, thread array) from the current task
- Traverse all thread information to determine whether the CPU utilization of any thread exceeds the set threshold
- dump stack if thread usage exceeds threshold
- Assembly data, reporting data
Thread information structure
struct thread_basic_info {
    time_value_t    user_time;      /* user run time(User run time) */
    time_value_t    system_time;    /* system run time(System operation time) */
    integer_t       cpu_usage;      /* scaled cpu usage percentage(CPU Usage, up to 1000) */
    policy_t        policy;         /* scheduling policy in effect(Effective scheduling strategy) */
    integer_t       run_state;      /* run state (Operation status, see below) */
    integer_t       flags;          /* various flags (All kinds of marks) */
    integer_t       suspend_count;  /* suspend count for thread(Thread hangs) */
    integer_t       sleep_time;     /* number of seconds that thread
                                     *  has been sleeping(Sleep time) */
};
When talking about stack restore, I've talked about the above analysis
thread_act_array_t threads;
mach_msg_type_number_t threadCount = 0;
const task_t thisTask = mach_task_self();
kern_return_t kr = task_threads(thisTask, &threads, &threadCount);
if (kr != KERN_SUCCESS) {
    return ;
}
for (int i = 0; i < threadCount; i++) {
    thread_info_data_t threadInfo;
    thread_basic_info_t threadBaseInfo;
    mach_msg_type_number_t threadInfoCount;

    kern_return_t kr = thread_info((thread_inspect_t)threads[i], THREAD_BASIC_INFO, (thread_info_t)threadInfo, &threadInfoCount);

    if (kr == KERN_SUCCESS) {

        threadBaseInfo = (thread_basic_info_t)threadInfo;
        // todo: conditional judgment, can't understand
        if (!(threadBaseInfo->flags & TH_FLAGS_IDLE)) {
            integer_t cpuUsage = threadBaseInfo->cpu_usage / 10;
            if (cpuUsage > CPUMONITORRATE) {

                NSMutableDictionary *CPUMetaDictionary = [NSMutableDictionary dictionary];
                NSData *CPUPayloadData = [NSData data];

                NSString *backtraceOfAllThread = [BacktraceLogger backtraceOfAllThread];
                // 1. Meta information of assembly carton
                CPUMetaDictionary[@"MONITOR_TYPE"] = CMMonitorCPUType;

                // 2. Assemble the Payload information of carton (a JSON object whose Key is the agreed STACK_TRACE, stack information after value is base64)
                NSData *CPUData = [SAFE_STRING(backtraceOfAllThread) dataUsingEncoding:NSUTF8StringEncoding];
                NSString *CPUDataBase64String = [CPUData base64EncodedStringWithOptions:0];
                NSDictionary *CPUPayloadDictionary = @{@"STACK_TRACE": SAFE_STRING(CPUDataBase64String)};

                NSError *error;
                // The NSJSONWritingOptions parameter must be passed to 0, because the server needs to process logic according to \ n, and the json string generated by passing 0 does not contain \ n
                NSData *parsedData = [NSJSONSerialization dataWithJSONObject:CPUPayloadDictionary options:0 error:&error];
                if (error) {
                    CMMLog(@"%@", error);
                    return;
                }
                CPUPayloadData = [parsedData copy];

                // 3. Data reporting will create powerful, flexible and configurable data reporting components in( https://github.com/FantasticLBP/knowledge-kit/blob/master/Chapter1%20-%20iOS/1.80.md )Talk about
                [[PrismClient sharedInstance] sendWithType:CMMonitorCPUType meta:CPUMetaDictionary payload:CPUPayloadData];
            }
        }
    }
}
4, OOM problem
1. Basic knowledge preparation
Hard disk: also called disk, used to store data. The songs, pictures and videos you store are all on your hard disk.
Memory: due to the slow reading speed of the hard disk, if all the data are read directly from the hard disk during the CPU running the program, the efficiency will be greatly affected. So the CPU will read the data needed by the program from the hard disk to the memory. Then CPU and data in memory are calculated and exchanged. Memory is volatile memory (data disappears after power failure). The memory module area is some memory inside the computer (on the main board), which is used to store the intermediate data and results of CPU operation. Memory is the bridge between program and CPU. Read data from hard disk or run program to provide CPU.
Virtual memory is a technology of memory management in computer system. It makes the program think that it has continuous available memory, but in fact, it is usually divided into multiple physical memory fragments, which may be temporarily stored on the external disk (hard disk) memory (when needed, the data in the hard disk is exchanged into memory). It is called "virtual memory" in Windows system and "swap space" in Linux/Unix system.
Does iOS support swap space? Not only does iOS not support switching space, but most mobile systems do not. Because a large amount of memory of mobile devices is flash memory, its reading and writing speed is far smaller than the hard disk used by computers, that is to say, even if the mobile phone uses switching space technology, because of the problem of slow flash memory, it can not improve performance, so there is no switching space technology.
2. iOS memory knowledge
Memory (RAM), like CPU, is the most scarce resource in the system, and it is also easy to compete. Application memory is directly related to performance. iOS has no swap space as an alternative resource, so memory resources are particularly important.
What is oom? Is the abbreviation of out of memory, which literally means that the memory limit is exceeded. It is divided into FOOM (background OOM) and BOOM (background OOM). It is a kind of non mainstream Crash caused by the Jetsam mechanism of iOS. It cannot be captured by the monitoring scheme of Signal.
What is the jetsam mechanism? Jetsam mechanism can be understood as a management mechanism adopted by the system to control the excessive use of memory resources. Jetsam mechanism runs in an independent process, each process has a memory threshold, once the memory threshold is exceeded, jetsam will kill the process immediately.
Why design Jetsam mechanism? Because the memory of the device is limited, memory resources are very important. The system process and other used apps will seize this resource. Because iOS doesn't support switching space, Jetsam will release as much memory as possible once a low memory event is triggered, so that when there is insufficient memory on iOS system, the App will be killed by the system and turned into crash.
Two situations trigger OOM: the system will kill the App with lower priority based on priority policy because the overall memory usage is too high; the current App reaches "high water mark", and the system will also kill the current App (exceeding the memory limit of the system for the current single App).
Read the source code (xnu/bsd/kern/kern_memorystatus.c) will find that there are two mechanisms for memory killing, as follows
highwater processing - > our App can't use more memory than a single limit
- Loop through the priority list to find threads
- Judge whether it meets p_ memstat_ The limitation of memlimit
- Diamonoseactive, FREEZE filtration
- Kill the process, if successful, exit, otherwise loop
memorystatus_act_aggressive processing - > high memory consumption, kill according to priority
- According to the policy home in jld_bucket_count, used to determine whether to be killed
- From JETSAM_PRIORITY_ELEVATED_INACTIVE starts to kill
- Old_bucket_count and memorystatus_jld_eval_period_msecs to determine whether to start killing
- Kill according to priority from low to high until memorystatus_avail_pages_below_pressure
Some cases of excessive memory
- App memory consumption is low, and other app memory management is also great. Even if we switch to other apps, our own app is still "alive" and retains the user status. Good experience
- App memory consumption is low, but other app memory consumption is too large (it may be memory management is poor, or it may itself consume resources, such as games). Then, in addition to the threads in the foreground, other apps will be killed by the system, and memory resources will be recycled to provide memory for active processes.
- App memory consumption is large. After switching to other apps, even if the memory applied by other apps to the system is small, the system will give priority to killing apps with large memory consumption because of memory resource shortage. It means that the user exits the app to the background and later opens it again to find that the app is reloaded and started.
- App memory consumption is very large, which is killed by the system when running in the foreground, causing flash back.
When the App runs out of memory, the system will make more space for use according to a certain strategy. A common method is to move some data with low priority to disk, which is called page out. When the data is accessed again later, the system will be responsible for moving it back to memory. This operation is called page in.
Memory page * * is the smallest unit in memory management. It is allocated by the system. A page may hold multiple objects, or a large object may span multiple pages. Usually it is 16KB in size and has three types of pages.
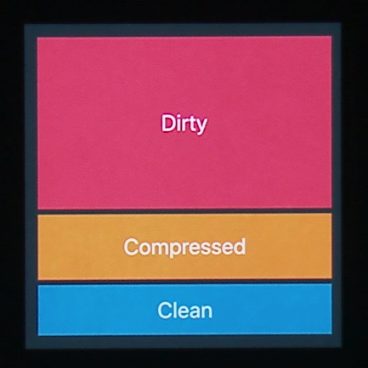
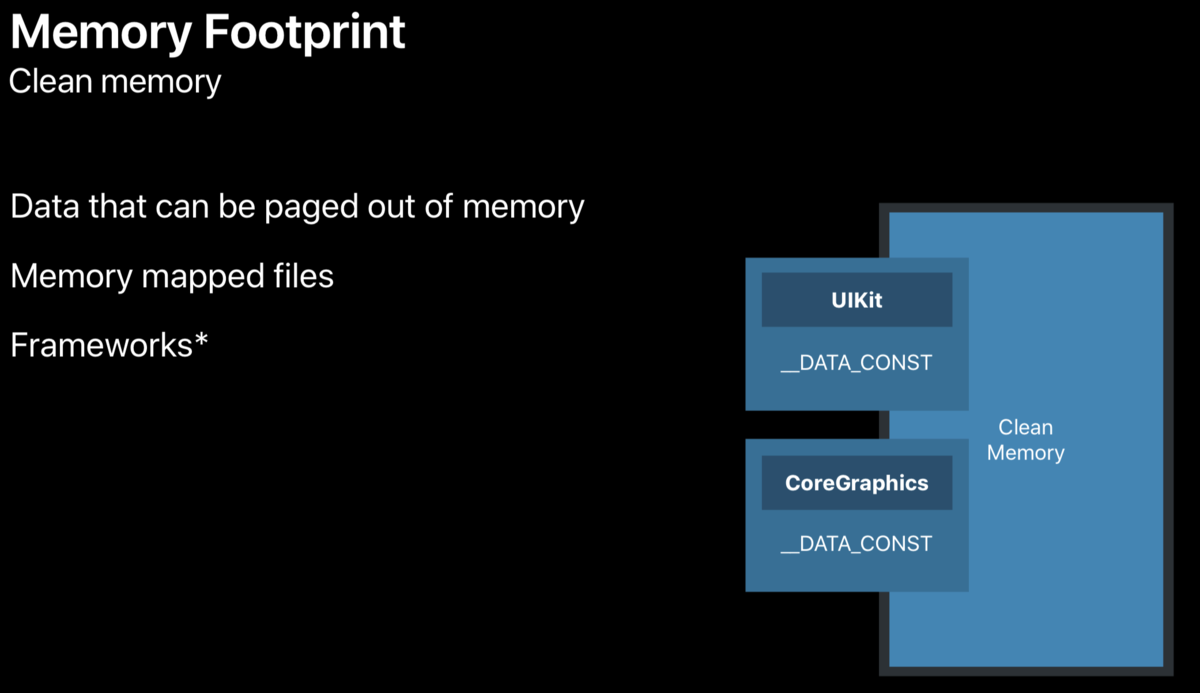
- Clean Memory
Clean memory includes three types: memory that can be paged out, memory mapping file, and framework used by App (each framework has_ DATA_CONST segment, usually in clean state, but with runtime swilling, it becomes dirty).At the beginning, the allocated pages are clean (except for the allocation of objects in the heap). When we write the App data, it becomes dirty. The files read into memory from the hard disk are also read-only and clean page s.
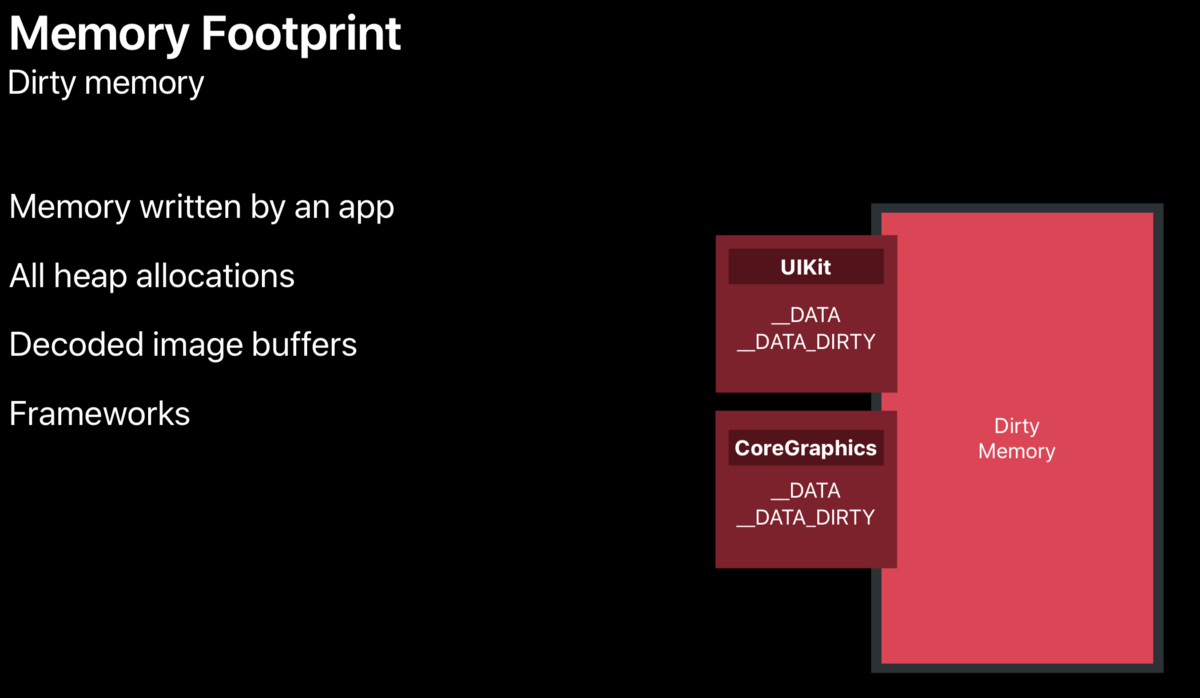
- Dirty Memory
Dirty memory includes four types: memory written by App, all heap allocated objects, image decoding buffer, framework (framework has_ Data segments and_ DATA_DIRTY segments, their memory is dirty).
In the process of using framework, Dirty memory will be generated. Using single instance or global initialization method can help reduce Dirty memory (because once a single instance is created, it will not be destroyed. It is always in memory, and the system does not think of it as Dirty memory).
- Compressed Memory
Due to the limitation of flash memory capacity and read / write, iOS does not have the mechanism of switching space, but introduces memory compressor in iOS 7. It is able to compress the memory objects that have not been used in recent period when the memory is tight. The memory compressor will compress the objects and release more page s. The memory compressor decompresses and reuses it when needed. It can save memory and improve response speed.
For example, when an App uses a Framework, it has an NSDictionary attribute to store data and uses 3 pages of memory. When it is not accessed recently, the memory compressor compresses it to 1 page, and when it is used again, it reverts to 3 pages.
App running memory = pageNumbers * pageSize. Because Compressed Memory belongs to Dirty memory. So Memory footprint = dirtySize + CompressedSize
Different devices have different upper limit of memory occupation, higher upper limit of App, lower upper limit of extension, crash to exc beyond the upper limit_ RESOURCE_ EXCEPTION. 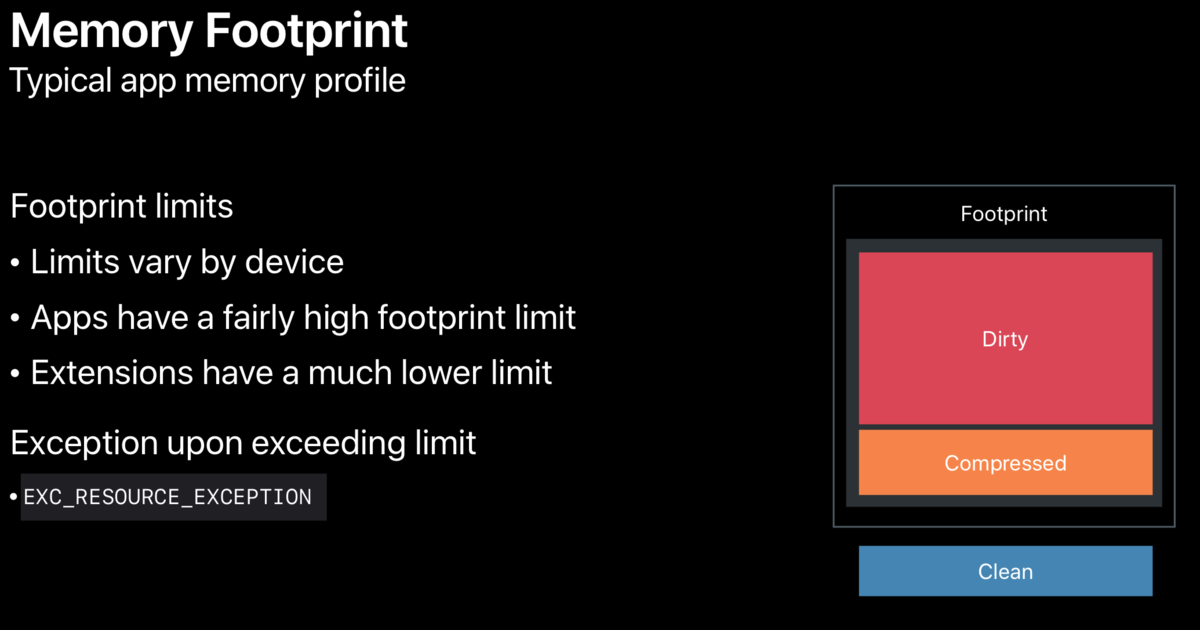
Next, let's talk about how to get the upper limit of memory, and how to monitor whether the App is forced to kill because it occupies too much memory.
3. Get memory information
3.1 calculating memory limit through JetsamEvent log
When the App is killed by Jetsam mechanism, the phone will generate a system log. View path: settings privacy Analytics & improvements analytics data. You can see the logs in the form of JetsamEvent-2020-03-14-161828.ips, starting with JetsamEvent. These JetsamEvent logs are all left by the iOS system kernel to kill apps that have low priority (idle, frontmost, suspended) and occupy more memory than the system memory limit.
The log contains App memory information. You can see that there is a pageSize field at the top of the log, and find the per process limit. The rpages in the structure where the node is located can be obtained by rpages * pageSize.
In the log, the largestProcess field represents the App name; the reason field represents the memory reason; and the states field represents the status of the App (idle, suspended, frontmost...) when it crashes.
In order to test the accuracy of the data, I will test all the apps of the two devices (iPhone 6s plus/13.3.1, iPhone 11 Pro/13.3.1) and quit completely. I only ran a Demo App to test the memory threshold. The ViewController code is as follows
- (void)viewDidLoad {
    [super viewDidLoad];
    NSMutableArray *array = [NSMutableArray array];
    for (NSInteger index = 0; index < 10000000; index++) {
        UIImageView *imageView = [[UIImageView alloc] initWithFrame:CGRectMake(0, 0, 100, 100)];
        UIImage *image = [UIImage imageNamed:@"AppIcon"];
        imageView.image = image;
        [array addObject:imageView];
    }
}
iPhone 6s plus/13.3.1 data are as follows:
{"bug_type":"298","timestamp":"2020-03-19 17:23:45.94 +0800","os_version":"iPhone OS 13.3.1 (17D50)","incident_id":"DA8AF66D-24E8-458C-8734-981866942168"}
{
  "crashReporterKey" : "fc9b659ce486df1ed1b8062d5c7c977a7eb8c851",
  "kernel" : "Darwin Kernel Version 19.3.0: Thu Jan  9 21:10:44 PST 2020; root:xnu-6153.82.3~1\/RELEASE_ARM64_S8000",
  "product" : "iPhone8,2",
  "incident" : "DA8AF66D-24E8-458C-8734-981866942168",
  "date" : "2020-03-19 17:23:45.93 +0800",
  "build" : "iPhone OS 13.3.1 (17D50)",
  "timeDelta" : 332,
  "memoryStatus" : {
  "compressorSize" : 48499,
  "compressions" : 7458651,
  "decompressions" : 5190200,
  "zoneMapCap" : 744407040,
  "largestZone" : "APFS_4K_OBJS",
  "largestZoneSize" : 41402368,
  "pageSize" : 16384,
  "uncompressed" : 104065,
  "zoneMapSize" : 141606912,
  "memoryPages" : {
    "active" : 26214,
    "throttled" : 0,
    "fileBacked" : 14903,
    "wired" : 20019,
    "anonymous" : 37140,
    "purgeable" : 142,
    "inactive" : 23669,
    "free" : 2967,
    "speculative" : 2160
  }
},
  "largestProcess" : "Test",
  "genCounter" : 0,
  "processes" : [
  {
    "uuid" : "39c5738b-b321-3865-a731-68064c4f7a6f",
    "states" : [
      "daemon",
      "idle"
    ],
    "lifetimeMax" : 188,
    "age" : 948223699030,
    "purgeable" : 0,
    "fds" : 25,
    "coalition" : 422,
    "rpages" : 177,
    "pid" : 282,
    "idleDelta" : 824711280,
    "name" : "com.apple.Safari.SafeBrowsing.Se",
    "cpuTime" : 10.275422000000001
  },
  // ...
  {
    "uuid" : "83dbf121-7c0c-3ab5-9b66-77ee926e1561",
    "states" : [
      "frontmost"
    ],
    "killDelta" : 2592,
    "genCount" : 0,
    "age" : 1531004794,
    "purgeable" : 0,
    "fds" : 50,
    "coalition" : 1047,
    "rpages" : 92806,
    "reason" : "per-process-limit",
    "pid" : 2384,
    "cpuTime" : 59.464373999999999,
    "name" : "Test",
    "lifetimeMax" : 92806
  },
  // ...
 ]
}
The OOM threshold of iPhone 6s plus/13.3.1 is (16384*92806)/(1024*1024)=1450.09375M
iPhone 11 Pro/13.3.1 data are as follows:
{"bug_type":"298","timestamp":"2020-03-19 17:30:28.39 +0800","os_version":"iPhone OS 13.3.1 (17D50)","incident_id":"7F111601-BC7A-4BD7-A468-CE3370053057"}
{
  "crashReporterKey" : "bc2445adc164c399b330f812a48248e029e26276",
  "kernel" : "Darwin Kernel Version 19.3.0: Thu Jan  9 21:11:10 PST 2020; root:xnu-6153.82.3~1\/RELEASE_ARM64_T8030",
  "product" : "iPhone12,3",
  "incident" : "7F111601-BC7A-4BD7-A468-CE3370053057",
  "date" : "2020-03-19 17:30:28.39 +0800",
  "build" : "iPhone OS 13.3.1 (17D50)",
  "timeDelta" : 189,
  "memoryStatus" : {
  "compressorSize" : 66443,
  "compressions" : 25498129,
  "decompressions" : 15532621,
  "zoneMapCap" : 1395015680,
  "largestZone" : "APFS_4K_OBJS",
  "largestZoneSize" : 41222144,
  "pageSize" : 16384,
  "uncompressed" : 127027,
  "zoneMapSize" : 169639936,
  "memoryPages" : {
    "active" : 58652,
    "throttled" : 0,
    "fileBacked" : 20291,
    "wired" : 45838,
    "anonymous" : 96445,
    "purgeable" : 4,
    "inactive" : 54368,
    "free" : 5461,
    "speculative" : 3716
  }
},
  "largestProcess" : "Hangzhou Xiaoliu",
  "genCounter" : 0,
  "processes" : [
  {
    "uuid" : "2dd5eb1e-fd31-36c2-99d9-bcbff44efbb7",
    "states" : [
      "daemon",
      "idle"
    ],
    "lifetimeMax" : 171,
    "age" : 5151034269954,
    "purgeable" : 0,
    "fds" : 50,
    "coalition" : 66,
    "rpages" : 164,
    "pid" : 11276,
    "idleDelta" : 3801132318,
    "name" : "wcd",
    "cpuTime" : 3.430787
  },
  // ...
  {
    "uuid" : "63158edc-915f-3a2b-975c-0e0ac4ed44c0",
    "states" : [
      "frontmost"
    ],
    "killDelta" : 4345,
    "genCount" : 0,
    "age" : 654480778,
    "purgeable" : 0,
    "fds" : 50,
    "coalition" : 1718,
    "rpages" : 134278,
    "reason" : "per-process-limit",
    "pid" : 14206,
    "cpuTime" : 23.955463999999999,
    "name" : "Hangzhou Xiaoliu",
    "lifetimeMax" : 134278
  },
  // ...
 ]
}
The OOM threshold of iPhone 11 Pro/13.3.1 is: (16384*134278)/(1024*1024)=2098.09375M
How does iOS discover Jetsam?
Mac OS / IOS is a BSD derived system, its kernel is Mach, but the interface exposed to the upper layer is generally based on the packaging of Mach by BSD layer. Mach is a microkernel architecture, in which real virtual memory management is also carried out. BSD provides the upper interface for memory management. Jetsam events are also generated by BSD. bsd_init function is the entry, which basically initializes each subsystem, such as virtual memory management.
// 1. Initialize the kernel memory allocator. Initialize the BSD memory zone. This zone is built based on the zone of the Mach kernel
kmeminit();

// 2. Initialize background freezing, a unique feature on IOS, is a resident monitoring thread for memory and process sleep
#if CONFIG_FREEZE
#ifndef CONFIG_MEMORYSTATUS
    #error "CONFIG_FREEZE defined without matching CONFIG_MEMORYSTATUS"
#endif
    /* Initialise background freezing */
    bsd_init_kprintf("calling memorystatus_freeze_init\n");
    memorystatus_freeze_init();
#endif>

// 3. iOS unique, JetSAM (i.e. resident monitoring thread for low memory events)
#if CONFIG_MEMORYSTATUS
    /* Initialize kernel memory status notifications */
    bsd_init_kprintf("calling memorystatus_init\n");
    memorystatus_init();
#endif /* CONFIG_MEMORYSTATUS */
The main function is to open two threads with the highest priority to monitor the memory of the whole system.
CONFIG_ When freeze is on, the kernel freezes rather than kills the process. The freezing function is to start a MEMORYSTATUS in the kernel_ freeze_ Thread performs the process, calling memorystatus_ after receiving the signal. freeze_ top_ Process is frozen.
iOS system will start the highest priority thread vm_pressure_monitor to monitor the memory pressure of the system and maintain all App processes through a stack. The iOS system also maintains a memory snapshot table, which is used to save the consumption of each process memory page. The logic related to Jetsam, or memorystatus, can be found in Kern in XNU project_ memorystatus. H and Kern_ See the source code of memorystatus. C.
Before the iOS system forcibly kills the App due to high memory consumption, at least 6 seconds can be used for priority judgment, and the JetsamEvent log is also generated in these 6 seconds.
As mentioned above, iOS system has no exchange space, so memory status mechanism (also known as Jetsam) is introduced. That is to say, free as much memory as possible on iOS system for current App. This mechanism is manifested in priority, which is to kill the background application first; if there is still not enough memory, it will kill the current application. In Mac OS, MemoryStatus only kills processes marked as idle exits.
The MemoryStatus mechanism will open a memorystatus_jetsam_thread, which is responsible for killing apps and logging, does not send messages, so the memory pressure detection thread cannot get the messages of killing apps.
When the monitoring thread finds that an App has memory pressure, it will issue a notification, and the App with memory will execute the didReceiveMemoryWarning agent method. At this time, we still have the opportunity to do some memory resource release logic, which may prevent the App from being killed by the system.
Source code view
The iOS system kernel has an array dedicated to maintaining thread priority. Each item in the array is a structure containing a list of processes. The structure is as follows:
#define MEMSTAT_BUCKET_COUNT (JETSAM_PRIORITY_MAX + 1)

typedef struct memstat_bucket {
    TAILQ_HEAD(, proc) list;
    int count;
} memstat_bucket_t;

memstat_bucket_t memstat_bucket[MEMSTAT_BUCKET_COUNT];
At Kern_ Priority information can be seen in MEMORYSTATUS. H
#define JETSAM_PRIORITY_IDLE_HEAD                -2
/* The value -1 is an alias to JETSAM_PRIORITY_DEFAULT */
#define JETSAM_PRIORITY_IDLE                      0
#define JETSAM_PRIORITY_IDLE_DEFERRED          1 /* Keeping this around till all xnu_quick_tests can be moved away from it.*/
#define JETSAM_PRIORITY_AGING_BAND1          JETSAM_PRIORITY_IDLE_DEFERRED
#define JETSAM_PRIORITY_BACKGROUND_OPPORTUNISTIC  2
#define JETSAM_PRIORITY_AGING_BAND2          JETSAM_PRIORITY_BACKGROUND_OPPORTUNISTIC
#define JETSAM_PRIORITY_BACKGROUND                3
#define JETSAM_PRIORITY_ELEVATED_INACTIVE      JETSAM_PRIORITY_BACKGROUND
#define JETSAM_PRIORITY_MAIL                      4
#define JETSAM_PRIORITY_PHONE                     5
#define JETSAM_PRIORITY_UI_SUPPORT                8
#define JETSAM_PRIORITY_FOREGROUND_SUPPORT        9
#define JETSAM_PRIORITY_FOREGROUND               10
#define JETSAM_PRIORITY_AUDIO_AND_ACCESSORY      12
#define JETSAM_PRIORITY_CONDUCTOR                13
#define JETSAM_PRIORITY_HOME                     16
#define JETSAM_PRIORITY_EXECUTIVE                17
#define JETSAM_PRIORITY_IMPORTANT                18
#define JETSAM_PRIORITY_CRITICAL                 19

#define JETSAM_PRIORITY_MAX                      21
It can be seen clearly that the background App priority is jetsam_ PRIORITY_ Backgroup is 3, the priority of foreground App is JETSAM_PRIORITY_FOREGROUND is 10.
The priority rules are: kernel thread priority > operating system priority > App priority. And the priority of foreground App is higher than that of background App; when the priority of threads is the same, the priority of threads with more CPU will be reduced.
At Kern_ You can see the possible reasons for OOM in MEMORYSTATUS. C:
/* For logging clarity */
static const char *memorystatus_kill_cause_name[] = {
    ""                                ,        /* kMemorystatusInvalid                            */
    "jettisoned"                    ,        /* kMemorystatusKilled                            */
    "highwater"                        ,        /* kMemorystatusKilledHiwat                        */
    "vnode-limit"                    ,        /* kMemorystatusKilledVnodes                    */
    "vm-pageshortage"                ,        /* kMemorystatusKilledVMPageShortage            */
    "proc-thrashing"                ,        /* kMemorystatusKilledProcThrashing                */
    "fc-thrashing"                    ,        /* kMemorystatusKilledFCThrashing                */
    "per-process-limit"                ,        /* kMemorystatusKilledPerProcessLimit            */
    "disk-space-shortage"            ,        /* kMemorystatusKilledDiskSpaceShortage            */
    "idle-exit"                        ,        /* kMemorystatusKilledIdleExit                    */
    "zone-map-exhaustion"            ,        /* kMemorystatusKilledZoneMapExhaustion            */
    "vm-compressor-thrashing"        ,        /* kMemorystatusKilledVMCompressorThrashing        */
    "vm-compressor-space-shortage"    ,        /* kMemorystatusKilledVMCompressorSpaceShortage    */
};
View memorystatus_init is the key code to initialize Jetsam thread in this function
__private_extern__ void
memorystatus_init(void)
{
    // ...
  /* Initialize the jetsam_threads state array */
    jetsam_threads = kalloc(sizeof(struct jetsam_thread_state) * max_jetsam_threads);

    /* Initialize all the jetsam threads */
    for (i = 0; i < max_jetsam_threads; i++) {

        result = kernel_thread_start_priority(memorystatus_thread, NULL, 95 /* MAXPRI_KERNEL */, &jetsam_threads[i].thread);
        if (result == KERN_SUCCESS) {
            jetsam_threads[i].inited = FALSE;
            jetsam_threads[i].index = i;
            thread_deallocate(jetsam_threads[i].thread);
        } else {
            panic("Could not create memorystatus_thread %d", i);
        }
    }
}
/*
 *    High-level priority assignments
 *
 *************************************************************************
 * 127        Reserved (real-time)
 *                A
 *                +
 *            (32 levels)
 *                +
 *                V
 * 96        Reserved (real-time)
 * 95        Kernel mode only
 *                A
 *                +
 *            (16 levels)
 *                +
 *                V
 * 80        Kernel mode only
 * 79        System high priority
 *                A
 *                +
 *            (16 levels)
 *                +
 *                V
 * 64        System high priority
 * 63        Elevated priorities
 *                A
 *                +
 *            (12 levels)
 *                +
 *                V
 * 52        Elevated priorities
 * 51        Elevated priorities (incl. BSD +nice)
 *                A
 *                +
 *            (20 levels)
 *                +
 *                V
 * 32        Elevated priorities (incl. BSD +nice)
 * 31        Default (default base for threads)
 * 30        Lowered priorities (incl. BSD -nice)
 *                A
 *                +
 *            (20 levels)
 *                +
 *                V
 * 11        Lowered priorities (incl. BSD -nice)
 * 10        Lowered priorities (aged pri's)
 *                A
 *                +
 *            (11 levels)
 *                +
 *                V
 * 0        Lowered priorities (aged pri's / idle)
 *************************************************************************
 */
It can be seen that the threads of user state applications cannot be higher than the operating system and kernel. Moreover, there are also differences in the priority allocation of threads among user applications, such as the priority of applications in the foreground is higher than that in the background. The highest priority of applications on iOS is SpringBoard; in addition, the priority of threads is not constant. Mach dynamically adjusts thread priority based on thread utilization and overall system load. If the CPU is consumed too much, the priority of the thread will be reduced. If the thread is starved too much, the priority of the thread will be increased. However, no matter how it changes, the program cannot exceed the priority range of its thread.
It can be seen that the system will turn on Max according to the kernel startup parameters and device performance_ jetsam_ Threads (1 in general, 3 in special) jetsam threads, and the priority of these threads is 95, that is, MAXPRI_KERNEL (note that 95 here is the thread priority, and XNU's thread priority range is 0-127. The macro definition above is the process priority, with the range: - 2-19).
Next, analyze the memory status_ Thread function, mainly responsible for the initialization of thread startup
static void
memorystatus_thread(void *param __unused, wait_result_t wr __unused)
{
  //...
  while (memorystatus_action_needed()) {
        boolean_t killed;
        int32_t priority;
        uint32_t cause;
        uint64_t jetsam_reason_code = JETSAM_REASON_INVALID;
        os_reason_t jetsam_reason = OS_REASON_NULL;

        cause = kill_under_pressure_cause;
        switch (cause) {
            case kMemorystatusKilledFCThrashing:
                jetsam_reason_code = JETSAM_REASON_MEMORY_FCTHRASHING;
                break;
            case kMemorystatusKilledVMCompressorThrashing:
                jetsam_reason_code = JETSAM_REASON_MEMORY_VMCOMPRESSOR_THRASHING;
                break;
            case kMemorystatusKilledVMCompressorSpaceShortage:
                jetsam_reason_code = JETSAM_REASON_MEMORY_VMCOMPRESSOR_SPACE_SHORTAGE;
                break;
            case kMemorystatusKilledZoneMapExhaustion:
                jetsam_reason_code = JETSAM_REASON_ZONE_MAP_EXHAUSTION;
                break;
            case kMemorystatusKilledVMPageShortage:
                /* falls through */
            default:
                jetsam_reason_code = JETSAM_REASON_MEMORY_VMPAGESHORTAGE;
                cause = kMemorystatusKilledVMPageShortage;
                break;
        }

        /* Highwater */
        boolean_t is_critical = TRUE;
        if (memorystatus_act_on_hiwat_processes(&errors, &hwm_kill, &post_snapshot, &is_critical)) {
            if (is_critical == FALSE) {
                /*
                 * For now, don't kill any other processes.
                 */
                break;
            } else {
                goto done;
            }
        }

        jetsam_reason = os_reason_create(OS_REASON_JETSAM, jetsam_reason_code);
        if (jetsam_reason == OS_REASON_NULL) {
            printf("memorystatus_thread: failed to allocate jetsam reason\n");
        }

        if (memorystatus_act_aggressive(cause, jetsam_reason, &jld_idle_kills, &corpse_list_purged, &post_snapshot)) {
            goto done;
        }

        /*
         * memorystatus_kill_top_process() drops a reference,
         * so take another one so we can continue to use this exit reason
         * even after it returns
         */
        os_reason_ref(jetsam_reason);

        /* LRU */
        killed = memorystatus_kill_top_process(TRUE, sort_flag, cause, jetsam_reason, &priority, &errors);
        sort_flag = FALSE;

        if (killed) {
            if (memorystatus_post_snapshot(priority, cause) == TRUE) {

                    post_snapshot = TRUE;
            }

            /* Jetsam Loop Detection */
            if (memorystatus_jld_enabled == TRUE) {
                if ((priority == JETSAM_PRIORITY_IDLE) || (priority == system_procs_aging_band) || (priority == applications_aging_band)) {
                    jld_idle_kills++;
                } else {
                    /*
                     * We've reached into bands beyond idle deferred.
                     * We make no attempt to monitor them
                     */
                }
            }

            if ((priority >= JETSAM_PRIORITY_UI_SUPPORT) && (total_corpses_count() > 0) && (corpse_list_purged == FALSE)) {
                /*
                 * If we have jetsammed a process in or above JETSAM_PRIORITY_UI_SUPPORT
                 * then we attempt to relieve pressure by purging corpse memory.
                 */
                task_purge_all_corpses();
                corpse_list_purged = TRUE;
            }
            goto done;
        }

        if (memorystatus_avail_pages_below_critical()) {
            /*
             * Still under pressure and unable to kill a process - purge corpse memory
             */
            if (total_corpses_count() > 0) {
                task_purge_all_corpses();
                corpse_list_purged = TRUE;
            }

            if (memorystatus_avail_pages_below_critical()) {
                /*
                 * Still under pressure and unable to kill a process - panic
                 */
                panic("memorystatus_jetsam_thread: no victim! available pages:%llu\n", (uint64_t)memorystatus_available_pages);
            }
        }

done:

}
You can see that it opens a loop, memorystatus_action_needed() as a loop condition to continuously free memory.
static boolean_t
memorystatus_action_needed(void)
{
#if CONFIG_EMBEDDED
    return (is_reason_thrashing(kill_under_pressure_cause) ||
            is_reason_zone_map_exhaustion(kill_under_pressure_cause) ||
           memorystatus_available_pages <= memorystatus_available_pages_pressure);
#else /* CONFIG_EMBEDDED */
    return (is_reason_thrashing(kill_under_pressure_cause) ||
            is_reason_zone_map_exhaustion(kill_under_pressure_cause));
#endif /* CONFIG_EMBEDDED */
}
It's via VM_ The memory pressure sent by pagepout is used to judge whether the current memory resource is tight. Several situations: frequent page exchange in and out is_reason_thrashing, Mach Zone runs out of is_ reason_ zone_ map_ Exhausion, and available pages are lower than memory status_available_pages is the threshold.
Continue with memorystatus_thread, when memory is tight, will trigger high water type OOM first, that is to say, OOM will occur if a process exceeds its maximum limit of using memory in the process of using high water mark. In MEMORYSTATUS_ act_ On_ hiwat_ In processes(), through memorystatus_kill_hiwat_proc() in priority array memstat_ Find the process with the lowest priority in bucket, if the memory of the process is less than the threshold (Footprint_ In_ bytes <= memlimit_ In_ Bytes) will continue to look for processes with lower secondary priority until processes that occupy more than the threshold memory are found and killed.
Generally speaking, it's hard for a single App to touch the high water mark. If it can't finish any process, it will eventually reach the memorystatus_act_aggressive, which is where most OOM s happen.
static boolean_t
memorystatus_act_aggressive(uint32_t cause, os_reason_t jetsam_reason, int *jld_idle_kills, boolean_t *corpse_list_purged, boolean_t *post_snapshot)
{
    // ...
  if ( (jld_bucket_count == 0) ||
             (jld_now_msecs > (jld_timestamp_msecs + memorystatus_jld_eval_period_msecs))) {

            /*
             * Refresh evaluation parameters
             */
            jld_timestamp_msecs     = jld_now_msecs;
            jld_idle_kill_candidates = jld_bucket_count;
            *jld_idle_kills         = 0;
            jld_eval_aggressive_count = 0;
            jld_priority_band_max    = JETSAM_PRIORITY_UI_SUPPORT;
        }
  //...
}
From the above code, it can be seen that whether to actually execute kill or not is determined according to a certain period of time, provided that JLD_ now_ msecs > (jld_ timestamp_ msecs + memorystatus_jld_eval_period_msecs. That is, in MEMORYSTATUS_ jld_ eval_ period_ Kill in the condition occurs after MSECS.
/* Jetsam Loop Detection */
if (max_mem <= (512 * 1024 * 1024)) {
    /* 512 MB devices */
memorystatus_jld_eval_period_msecs = 8000;    /* 8000 msecs == 8 second window */
} else {
    /* 1GB and larger devices */
memorystatus_jld_eval_period_msecs = 6000;    /* 6000 msecs == 6 second window */
}
Among them, memorystatus_jld_eval_period_msecs takes a minimum value of 6 seconds. So we can do something in six seconds.
3.2 developers' income
stackoverflow There is a piece of data on which the OOM critical values of various devices are sorted out
| device | crash amount:MB | total amount:MB | percentage of total |
|---|---|---|---|
| iPad1 | 127 | 256 | 49% |
| iPad2 | 275 | 512 | 53% |
| iPad3 | 645 | 1024 | 62% |
| iPad4(iOS 8.1) | 585 | 1024 | 57% |
| Pad Mini 1st Generation | 297 | 512 | 58% |
| iPad Mini retina(iOS 7.1) | 696 | 1024 | 68% |
| iPad Air | 697 | 1024 | 68% |
| iPad Air 2(iOS 10.2.1) | 1383 | 2048 | 68% |
| iPad Pro 9.7"(iOS 10.0.2 (14A456)) | 1395 | 1971 | 71% |
| iPad Pro 10.5"(iOS 11 beta4) | 3057 | 4000 | 76% |
| iPad Pro 12.9" (2015)(iOS 11.2.1) | 3058 | 3999 | 76% |
| iPad 10.2(iOS 13.2.3) | 1844 | 2998 | 62% |
| iPod touch 4th gen(iOS 6.1.1) | 130 | 256 | 51% |
| iPod touch 5th gen | 286 | 512 | 56% |
| iPhone4 | 325 | 512 | 63% |
| iPhone4s | 286 | 512 | 56% |
| iPhone5 | 645 | 1024 | 62% |
| iPhone5s | 646 | 1024 | 63% |
| iPhone6(iOS 8.x) | 645 | 1024 | 62% |
| iPhone6 Plus(iOS 8.x) | 645 | 1024 | 62% |
| iPhone6s(iOS 9.2) | 1396 | 2048 | 68% |
| iPhone6s Plus(iOS 10.2.1) | 1396 | 2048 | 68% |
| iPhoneSE(iOS 9.3) | 1395 | 2048 | 68% |
| iPhone7(iOS 10.2) | 1395 | 2048 | 68% |
| iPhone7 Plus(iOS 10.2.1) | 2040 | 3072 | 66% |
| iPhone8(iOS 12.1) | 1364 | 1990 | 70% |
| iPhoneX(iOS 11.2.1) | 1392 | 2785 | 50% |
| iPhoneXS(iOS 12.1) | 2040 | 3754 | 54% |
| iPhoneXS Max(iOS 12.1) | 2039 | 3735 | 55% |
| iPhoneXR(iOS 12.1) | 1792 | 2813 | 63% |
| iPhone11(iOS 13.1.3) | 2068 | 3844 | 54% |
| iPhone11 Pro Max(iOS 13.2.3) | 2067 | 3740 | 55% |
3.3 trigger the high water mark of the current App
We can write timers, constantly apply for memory, and then use physics_ Footprint printing currently occupies memory. In principle, constantly applying for memory can trigger the Jetsam mechanism to kill the App. Then the memory occupation of the last printing is the upper limit of the current device's memory.
timer = [NSTimer scheduledTimerWithTimeInterval:0.01 target:self selector:@selector(allocateMemory) userInfo:nil repeats:YES];

- (void)allocateMemory {
    UIImageView *imageView = [[UIImageView alloc] initWithFrame:CGRectMake(0, 0, 100, 100)];
    UIImage *image = [UIImage imageNamed:@"AppIcon"];
    imageView.image = image;
    [array addObject:imageView];

    memoryLimitSizeMB = [self usedSizeOfMemory];
    if (memoryWarningSizeMB && memoryLimitSizeMB) {
        NSLog(@"----- memory warnning:%dMB, memory limit:%dMB", memoryWarningSizeMB, memoryLimitSizeMB);
    }
}

- (int)usedSizeOfMemory {
    task_vm_info_data_t taskInfo;
    mach_msg_type_number_t infoCount = TASK_VM_INFO_COUNT;
    kern_return_t kernReturn = task_info(mach_task_self(), TASK_VM_INFO, (task_info_t)&taskInfo, &infoCount);

    if (kernReturn != KERN_SUCCESS) {
        return 0;
    }
    return (int)(taskInfo.phys_footprint/1024.0/1024.0);
}
3.4 acquisition method applicable to IOS 13 system
iOS13 start < OS / proc. H > medium size_t os_proc_available_memory(void); you can view the currently available memory.
Return Value
The number of bytes that the app may allocate before it hits its memory limit. If the calling process isn't an app, or if the process has already exceeded its memory limit, this function returns 0.
Discussion
Call this function to determine the amount of memory available to your app. The returned value corresponds to the current memory limit minus the memory footprint of your app at the time of the function call. Your app's memory footprint consists of the data that you allocated in RAM, and that must stay in RAM (or the equivalent) at all times. Memory limits can change during the app life cycle and don't necessarily correspond to the amount of physical memory available on the device.
Use the returned value as advisory information only and don't cache it. The precise value changes when your app does any work that affects memory, which can happen frequently.
Although this function lets you determine the amount of memory your app may safely consume, don't use it to maximize your app's memory usage. Significant memory use, even when under the current memory limit, affects system performance. For example, when your app consumes all of its available memory, the system may need to terminate other apps and system processes to accommodate your app's requests. Instead, always consume the smallest amount of memory you need to be responsive to the user's needs.
If you need more detailed information about the available memory resources, you can call task_info. However, be aware that task_info is an expensive call, whereas this function is much more efficient.
if (@available(iOS 13.0, *)) {
    return os_proc_available_memory() / 1024.0 / 1024.0;
}
The API of App memory information can be found in Mach layer_ task_ basic_ The info structure stores the memory usage information of Mach task, where phys_footprint is the physical memory size used by the application_ Size is the virtual memory size.
#define MACH_TASK_BASIC_INFO     20         /* always 64-bit basic info */
struct mach_task_basic_info {
    mach_vm_size_t  virtual_size;       /* virtual memory size (bytes) */
    mach_vm_size_t  resident_size;      /* resident memory size (bytes) */
    mach_vm_size_t  resident_size_max;  /* maximum resident memory size (bytes) */
    time_value_t    user_time;          /* total user run time for
                                            terminated threads */
    time_value_t    system_time;        /* total system run time for
                                            terminated threads */
    policy_t        policy;             /* default policy for new threads */
    integer_t       suspend_count;      /* suspend count for task */
};
So get the code as
task_vm_info_data_t vmInfo;
mach_msg_type_number_t count = TASK_VM_INFO_COUNT;
kern_return_t kr = task_info(mach_task_self(), TASK_VM_INFO, (task_info_t)&vmInfo, &count);

if (kr != KERN_SUCCESS) {
    return ;
}
CGFloat memoryUsed = (CGFloat)(vmInfo.phys_footprint/1024.0/1024.0);
Maybe some people are curious that it shouldn't be resident_ Does the size field get the memory usage? Found resident at the beginning of the test_ There is a big gap between size and Xcode measurement results. Using physics instead_ Footprint is close to the result of Xcode. And from WebKit source code It is confirmed in.
So on IOS 13, we can use OS_ proc_ available_ The available memory is obtained from memory, and the current available memory is obtained through phys_footprint gets the memory occupied by the current App. The sum of the two is the upper memory limit of the current device. If the sum exceeds, the Jetsam mechanism will be triggered.
- (CGFloat)limitSizeOfMemory {
    if (@available(iOS 13.0, *)) {
        task_vm_info_data_t taskInfo;
        mach_msg_type_number_t infoCount = TASK_VM_INFO_COUNT;
        kern_return_t kernReturn = task_info(mach_task_self(), TASK_VM_INFO, (task_info_t)&taskInfo, &infoCount);

        if (kernReturn != KERN_SUCCESS) {
            return 0;
        }
        return (CGFloat)((taskInfo.phys_footprint + os_proc_available_memory()) / (1024.0 * 1024.0);
    }
    return 0;
}
Currently available memory: 1435.936752MB; currently occupied memory of App: 14.5MB, critical value: 1435.936752MB + 14.5MB= 1450.436MB, the same as the memory critical value obtained in 3.1 method: "iPhone 6s plus/13.3.1 phone OOM critical value is: (16384*92806)/(1024*1024)=1450.09375M".
3.5 get the memory limit value through XNU
In XNU, there are functions and macros specifically used to get the upper memory limit value, which can be accessed through MEMORYSTATUS_ priority_ The entry structure gets the priority and memory limit values of all processes.
typedef struct memorystatus_priority_entry {
  pid_t pid;
  int32_t priority;
  uint64_t user_data;
  int32_t limit;
  uint32_t state;
} memorystatus_priority_entry_t;
Among them, priority represents the priority of the process, and limit represents the memory limit of the process. But this way requires root permission. I haven't tried it because there is no jailbreak device.
Relevant codes can be found in kern_memorystatus.h file. Function int MEMORYSTATUS is required_ control(uint32_ t command, int32_ t pid, uint32_ t flags, void *buffer, size_ t buffersize);
/* Commands */
#define MEMORYSTATUS_CMD_GET_PRIORITY_LIST            1
#define MEMORYSTATUS_CMD_SET_PRIORITY_PROPERTIES      2
#define MEMORYSTATUS_CMD_GET_JETSAM_SNAPSHOT          3
#define MEMORYSTATUS_CMD_GET_PRESSURE_STATUS          4
#define MEMORYSTATUS_CMD_SET_JETSAM_HIGH_WATER_MARK   5    /* Set active memory limit = inactive memory limit, both non-fatal    */
#define MEMORYSTATUS_CMD_SET_JETSAM_TASK_LIMIT          6    /* Set active memory limit = inactive memory limit, both fatal    */
#define MEMORYSTATUS_CMD_SET_MEMLIMIT_PROPERTIES      7    /* Set memory limits plus attributes independently            */
#define MEMORYSTATUS_CMD_GET_MEMLIMIT_PROPERTIES      8    /* Get memory limits plus attributes                    */
#define MEMORYSTATUS_CMD_PRIVILEGED_LISTENER_ENABLE   9    /* Set the task's status as a privileged listener w.r.t memory notifications  */
#define MEMORYSTATUS_CMD_PRIVILEGED_LISTENER_DISABLE  10   /* Reset the task's status as a privileged listener w.r.t memory notifications  */
#define MEMORYSTATUS_CMD_AGGRESSIVE_JETSAM_LENIENT_MODE_ENABLE  11   /* Enable the 'lenient' mode for aggressive jetsam. See comments in kern_memorystatus.c near the top. */
#define MEMORYSTATUS_CMD_AGGRESSIVE_JETSAM_LENIENT_MODE_DISABLE 12   /* Disable the 'lenient' mode for aggressive jetsam. */
#define MEMORYSTATUS_CMD_GET_MEMLIMIT_EXCESS          13   /* Compute how much a process's phys_footprint exceeds inactive memory limit */
#define MEMORYSTATUS_CMD_ELEVATED_INACTIVEJETSAMPRIORITY_ENABLE     14 /* Set the inactive jetsam band for a process to JETSAM_PRIORITY_ELEVATED_INACTIVE */
#define MEMORYSTATUS_CMD_ELEVATED_INACTIVEJETSAMPRIORITY_DISABLE     15 /* Reset the inactive jetsam band for a process to the default band (0)*/
#define MEMORYSTATUS_CMD_SET_PROCESS_IS_MANAGED       16   /* (Re-)Set state on a process that marks it as (un-)managed by a system entity e.g. assertiond */
#define MEMORYSTATUS_CMD_GET_PROCESS_IS_MANAGED       17   /* Return the 'managed' status of a process */
#define MEMORYSTATUS_CMD_SET_PROCESS_IS_FREEZABLE     18   /* Is the process eligible for freezing? Apps and extensions can pass in FALSE to opt out of freezing, i.e.,
Pseudocode
struct memorystatus_priority_entry memStatus[NUM_ENTRIES];
size_t count = sizeof(struct memorystatus_priority_entry) * NUM_ENTRIES;
int kernResult = memorystatus_control(MEMORYSTATUS_CMD_GET_PRIORITY_LIST, 0, 0, memStatus, count);
if (rc < 0) {
  NSLog(@"memorystatus_control");
    return ;
}

int entry = 0;
for (; rc > 0; rc -= sizeof(struct memorystatus_priority_entry)){
  printf ("PID: %5d\tPriority:%2d\tUser Data: %llx\tLimit:%2d\tState:%s\n",
          memstatus[entry].pid,
          memstatus[entry].priority,
          memstatus[entry].user_data,
          memstatus[entry].limit,
          state_to_text(memstatus[entry].state));
  entry++;
}
for loop prints pid, Priority, User Data, Limit, State information of each process (that is, App). Find out the process with Priority of 10 from the log, that is, the App we run in the foreground. Why 10? Because define jetsam_ Priority_ Foreground 10 our purpose is to get the upper memory Limit of the foreground App.
4. How to determine the occurrence of OOM
Is the app bound to receive a low memory warning before OOM causes crash?
Two groups of comparative experiments were carried out:
// Experiment 1
NSMutableArray *array = [NSMutableArray array];
for (NSInteger index = 0; index < 10000000; index++) {
  NSString *filePath = [[NSBundle mainBundle] pathForResource:@"Info" ofType:@"plist"];
  NSData *data = [NSData dataWithContentsOfFile:filePath];
  [array addObject:data];
}
// Experiment 2
// ViewController.m
- (void)viewDidLoad {
    [super viewDidLoad];
    dispatch_async(dispatch_get_global_queue(0, 0), ^{
        NSMutableArray *array = [NSMutableArray array];
        for (NSInteger index = 0; index < 10000000; index++) {
            NSString *filePath = [[NSBundle mainBundle] pathForResource:@"Info" ofType:@"plist"];
            NSData *data = [NSData dataWithContentsOfFile:filePath];
            [array addObject:data];
        }
    });
}
- (void)didReceiveMemoryWarning
{
    NSLog(@"2");
}

// AppDelegate.m
- (void)applicationDidReceiveMemoryWarning:(UIApplication *)application
{
    NSLog(@"1");
}
Phenomenon:
- In viewDidLoad, that is, the main thread consumes too much memory. The system will not issue a low memory warning and Crash directly. The main thread is busy because the memory is growing too fast.
- In the case of multithreading, App will receive a low memory warning due to the rapid memory growth. applicationDidReceiveMemoryWarning in AppDelegate is executed first, followed by the current VC's didReceiveMemoryWarning.
Conclusion:
Receiving a low memory warning does not necessarily crash, because there is a 6-second system judgment time, and if the memory drops within 6 seconds, it will not crash. The occurrence of OOM does not necessarily result in a low memory warning.
5. Memory information collection
To locate the problem accurately, you need to dump all objects and their memory information. When the memory is close to the upper limit of the system memory, collect and record the required information, upload to the server, analyze and repair with a certain data reporting mechanism.
You also need to know in which function each object is created to restore the scene of crime.
The source code (libmalloc/malloc), memory allocation functions malloc and calloc use nano by default_ zone,nano_zone is the memory allocation less than 256B, and larger than 256B uses scalable_zone to allocate.
Mainly for large memory allocation monitoring. The malloc function uses malloc_ zone_ Malloc. It's malloc_zone_calloc.
Using scalable_ All functions that allocate memory in zone will call malloc_ The logger function, because the system specially counts and manages the memory allocation in order to have a place. This design also meets the "closing principle".
void *
malloc(size_t size)
{
    void *retval;
    retval = malloc_zone_malloc(default_zone, size);
    if (retval == NULL) {
        errno = ENOMEM;
    }
    return retval;
}

void *
calloc(size_t num_items, size_t size)
{
    void *retval;
    retval = malloc_zone_calloc(default_zone, num_items, size);
    if (retval == NULL) {
        errno = ENOMEM;
    }
    return retval;
}
Let's first look at the default_ What is zone? The code is as follows
typedef struct {
    malloc_zone_t malloc_zone;
    uint8_t pad[PAGE_MAX_SIZE - sizeof(malloc_zone_t)];
} virtual_default_zone_t;

static virtual_default_zone_t virtual_default_zone
__attribute__((section("__DATA,__v_zone")))
__attribute__((aligned(PAGE_MAX_SIZE))) = {
    NULL,
    NULL,
    default_zone_size,
    default_zone_malloc,
    default_zone_calloc,
    default_zone_valloc,
    default_zone_free,
    default_zone_realloc,
    default_zone_destroy,
    DEFAULT_MALLOC_ZONE_STRING,
    default_zone_batch_malloc,
    default_zone_batch_free,
    &default_zone_introspect,
    10,
    default_zone_memalign,
    default_zone_free_definite_size,
    default_zone_pressure_relief,
    default_zone_malloc_claimed_address,
};

static malloc_zone_t *default_zone = &virtual_default_zone.malloc_zone;

static void *
default_zone_malloc(malloc_zone_t *zone, size_t size)
{
    zone = runtime_default_zone();

    return zone->malloc(zone, size);
}


MALLOC_ALWAYS_INLINE
static inline malloc_zone_t *
runtime_default_zone() {
    return (lite_zone) ? lite_zone : inline_malloc_default_zone();
}
You can see the default_zone is initialized in this way
static inline malloc_zone_t *
inline_malloc_default_zone(void)
{
    _malloc_initialize_once();
    // malloc_report(ASL_LEVEL_INFO, "In inline_malloc_default_zone with %d %d\n", malloc_num_zones, malloc_has_debug_zone);
    return malloc_zones[0];
}
The subsequent calls are as follows
A kind of malloc_ initialize -> create_ scalable_ zone -> create_ scalable_ Szone, we finally created szone_ The object of type T, through type conversion, gets our default_zone.
malloc_zone_t *
create_scalable_zone(size_t initial_size, unsigned debug_flags) {
    return (malloc_zone_t *) create_scalable_szone(initial_size, debug_flags);
}
void *malloc_zone_malloc(malloc_zone_t *zone, size_t size)
{
  MALLOC_TRACE(TRACE_malloc | DBG_FUNC_START, (uintptr_t)zone, size, 0, 0);
  void *ptr;
  if (malloc_check_start && (malloc_check_counter++ >= malloc_check_start)) {
    internal_check();
  }
  if (size > MALLOC_ABSOLUTE_MAX_SIZE) {
    return NULL;
  }
  ptr = zone->malloc(zone, size);
  // Start using malloc after the zone allocates memory_ Logger for recording
  if (malloc_logger) {
    malloc_logger(MALLOC_LOG_TYPE_ALLOCATE | MALLOC_LOG_TYPE_HAS_ZONE, (uintptr_t)zone, (uintptr_t)size, 0, (uintptr_t)ptr, 0);
  }
  MALLOC_TRACE(TRACE_malloc | DBG_FUNC_END, (uintptr_t)zone, size, (uintptr_t)ptr, 0);
  return ptr;
}
Its allocation implementation is zone - > malloc. According to the previous analysis, it is zone_ The corresponding malloc implementation in the T structure object.
After creating the szone, a series of initialization operations are done as follows.
// Initialize the security token.
szone->cookie = (uintptr_t)malloc_entropy[0];

szone->basic_zone.version = 12;
szone->basic_zone.size = (void *)szone_size;
szone->basic_zone.malloc = (void *)szone_malloc;
szone->basic_zone.calloc = (void *)szone_calloc;
szone->basic_zone.valloc = (void *)szone_valloc;
szone->basic_zone.free = (void *)szone_free;
szone->basic_zone.realloc = (void *)szone_realloc;
szone->basic_zone.destroy = (void *)szone_destroy;
szone->basic_zone.batch_malloc = (void *)szone_batch_malloc;
szone->basic_zone.batch_free = (void *)szone_batch_free;
szone->basic_zone.introspect = (struct malloc_introspection_t *)&szone_introspect;
szone->basic_zone.memalign = (void *)szone_memalign;
szone->basic_zone.free_definite_size = (void *)szone_free_definite_size;
szone->basic_zone.pressure_relief = (void *)szone_pressure_relief;
szone->basic_zone.claimed_address = (void *)szone_claimed_address;
Other use of scalable_ The function of zone to allocate memory is similar, so the allocation of large memory, no matter how the external function is encapsulated, will eventually call malloc_logger function. So we can use fishhook to hook this function, and then record the memory allocation, combined with a certain data reporting mechanism, upload to the server, analyze and repair.
// For logging VM allocation and deallocation, arg1 here
// is the mach_port_name_t of the target task in which the
// alloc or dealloc is occurring. For example, for mmap()
// that would be mach_task_self(), but for a cross-task-capable
// call such as mach_vm_map(), it is the target task.

typedef void (malloc_logger_t)(uint32_t type, uintptr_t arg1, uintptr_t arg2, uintptr_t arg3, uintptr_t result, uint32_t num_hot_frames_to_skip);

extern malloc_logger_t *__syscall_logger;
When malloc_logger and__ syscall_ When the logger function pointer is not empty, malloc/free, vm_allocate/vm_deallocate and other memory allocation / release notify the upper layer through these two pointers, which is also the implementation principle of memory debugging tool malloc stack. With these two function pointers, we can easily record the memory allocation information (including allocation size and allocation stack) of the current living object. The allocation stack can be captured with the backtrace function, but the captured address is the virtual memory address, and the symbol cannot be parsed from the symbol table dsym. So also record the offset slide when each image is loaded, so the symbol table address = stack address - slide.
Small tips:
ASLR(Address space layout Randomization): commonly known as address space random loading, address space configuration randomization and Address space layout randomization, it is a computer security technology to prevent memory corruption vulnerability from being exploited. By randomly placing the address space of the key data area of the process, the attacker can reliably jump to a specific location of memory to operate functions. Modern operating systems generally have this mechanism.
Function address add: the real implementation address of the function;
Function virtual address: vm_add;
ASLR: the random offset of the virtual address of the slide function loaded into the process memory. The slide of each mach-o is different. vm_add + slide = add. That is: * (base +offset)= imp.
Tencent has also opened its own OOM positioning scheme- OOMDetector , with the ready-made wheel, it's OK to use it well, so the idea of memory monitoring is to find the upper limit of memory given by the system to the App, and then when it's close to the upper limit of memory, dump Memory, assemble the basic data information into a qualified report data, pass a certain data reporting strategy to the server, the server consumes data, analyzes and generates reports, and the client engineer analyzes the problems according to the reports. The data of different projects are notified to the owner and developer of the project in the form of email, SMS, enterprise wechat, etc. (if the situation is serious, the developer will be called directly and the supervisor will be followed up with the result of each step.).
After problem analysis and processing, either release a new version or hot fix.
6. What can we do for memory in the development phase
- Picture zoom
WWDC 2018 Session 416 - iOS Memory Deep Dive. When processing image zooming, using UIImage directly will read the file during decoding and occupy a part of memory. In addition, generating an intermediate Bitmap bitmap will consume a lot of memory. However, ImageIO does not have the above two disadvantages and only takes up the memory of the final image size
Two groups of comparative experiments have been done: display a picture to App
You can see that using ImageIO consumes less memory than using UIImage to scale directly.
- Reasonable use of autoreleasepool
We know that the autoreleasepool object is released at the end of the RunLoop. Under ARC, if we are constantly applying for memory, such as various loops, then we need to manually add autoreleasepool to avoid the memory boom in a short time.
Comparative experiment
Experiment 1 consumed 739.6M of memory and Experiment 2 587M of memory.
- UIGraphicsBeginImageContext and UIGraphicsEndImageContext must appear in pairs, otherwise it will cause context leakage. In addition, XCode analysis can also scan out such problems.
- Whether you open a web page or execute js, you should use WKWebView. UIWebView will occupy a large amount of memory, which will increase the probability of OOM of App. WKWebView is a multi process component. Network Loading and UI Rendering are executed in other processes, with lower memory cost than UIWebView.
- In the SDK or App, if the scenario is cache related, try to use NSCache instead of NSMutableDictionary. It is a special cache processing class provided by the system. The memory allocated by NSCache is Purgeable Memory, which can be automatically released by the system. The combination of NSCache and nspurabledata allows the system to reclaim memory according to the situation or remove objects during memory cleaning.
Other development habits are not described one by one. Good development habits and code awareness need to be cultivated at ordinary times.
5, App network monitoring
Mobile network environment has always been very complex. WIFI, 2G, 3G, 4G, 5G, etc. users may switch between these types in the process of using App. This is also a difference between mobile network and traditional network, which is called "Connection Migration". In addition, there are some problems such as slow DNS resolution, high failure rate and hijacking of operators. Users' experience is poor when using App for some reasons. In order to improve the network situation, there must be clear monitoring means.
1. App network request process
When an App sends a network request, it usually goes through the following key steps:
- DNS resolution
Domain Name system, a network Domain Name system, is essentially a distributed database that maps domain names and IP addresses to each other, making it easier for people to access the Internet. First, the local DNS cache will be queried, and if the search fails, the DNS server will be queried, which may go through a lot of nodes, involving the process of recursive query and iterative query. Operators may not work: one situation is the phenomenon of operators hijacking, which shows that when you visit a web page in the App, you will see ads that are not related to the content; the other possibility is to leave your request to a very far base station for DNS resolution, which results in a long DNS resolution time and low efficiency of the App network. Generally, HTTP DNS is used to solve DNS problems.
- TCP 3 handshakes
You can see why there are three handshakes instead of two or four in the process of TCP handshake article.
- TLS handshake
For HTTPS requests, TLS handshake is also needed, which is the process of key negotiation.
- Send request
After the connection is established, you can send the request. At this time, you can record the request start time
- Waiting for a response
Wait for the server to return a response. This time mainly depends on the resource size, and is also the most time-consuming stage in the network request process.
- Return response
The server returns a response to the client, and judges whether the request is successful, whether the request is cached, and whether it needs to be redirected according to the status code in the HTTP header information.
2. Monitoring principle
| name | explain |
|---|---|
| NSURLConnection | It has been abandoned. Simple to use |
| NSURLSession | IOS 7.0, more powerful |
| CFNetwork | Bottom layer of NSURL, pure C implementation |
The hierarchical relationship of iOS network framework is as follows:
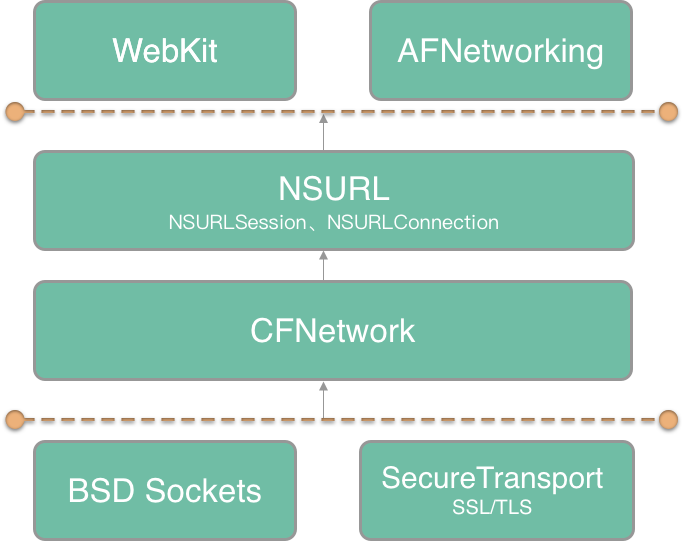
The current situation of iOS network is composed of four layers: the bottom BSD Sockets and SecureTransport; the bottom CFNetwork, NSURLSession, NSURLConnection and WebView are implemented with Objective-C, and CFNetwork is called; the application layer framework AFNetworking is implemented based on NSURLSession and NSURLConnection.
At present, there are two kinds of network monitoring in the industry: one is through NSURLProtocol monitoring, the other is through Hook monitoring. Here are several ways to monitor network requests, each with its own advantages and disadvantages.
2.1 scheme I: NSURLProtocol monitors App network requests
As the upper interface, NSURLProtocol is easy to use, but it belongs to URL Loading System. The support of application protocol is limited. It supports several application layer protocols, such as FTP, HTTP, HTTPS, etc. but it cannot be monitored for other protocols, which has certain limitations. If you monitor the underlying network library CFNetwork, there is no such limitation.
The specific methods for NSURLProtocol are as follows: This article As mentioned in, inherit the abstract class and implement the corresponding methods, customize to initiate network requests to achieve the purpose of monitoring.
After iOS 10, a new proxy method has been added to the asurlsessiontaskdelegate:
/*
 * Sent when complete statistics information has been collected for the task.
 */
- (void)URLSession:(NSURLSession *)session task:(NSURLSessionTask *)task didFinishCollectingMetrics:(NSURLSessionTaskMetrics *)metrics API_AVAILABLE(macosx(10.12), ios(10.0), watchos(3.0), tvos(10.0));
Indicators of network conditions can be obtained from nsurlsessiontasmetrics. The parameters are as follows
@interface NSURLSessionTaskMetrics : NSObject

/*
 * transactionMetrics array contains the metrics collected for every request/response transaction created during the task execution.
 */
@property (copy, readonly) NSArray<NSURLSessionTaskTransactionMetrics *> *transactionMetrics;

/*
 * Interval from the task creation time to the task completion time.
 * Task creation time is the time when the task was instantiated.
 * Task completion time is the time when the task is about to change its internal state to completed.
 */
@property (copy, readonly) NSDateInterval *taskInterval;

/*
 * redirectCount is the number of redirects that were recorded.
 */
@property (assign, readonly) NSUInteger redirectCount;

- (instancetype)init API_DEPRECATED("Not supported", macos(10.12,10.15), ios(10.0,13.0), watchos(3.0,6.0), tvos(10.0,13.0));
+ (instancetype)new API_DEPRECATED("Not supported", macos(10.12,10.15), ios(10.0,13.0), watchos(3.0,6.0), tvos(10.0,13.0));

@end
Among them: taskInterval refers to the total time from the task creation to the completion of the call, the task creation time refers to the time when the task is instantiated, and the task completion time refers to the time when the internal state of the task will change to completion; redirectCount refers to the number of redirects; transactionMetrics The array contains the indicators collected in each request / response transaction during task execution. The parameters are as follows:
/*
 * This class defines the performance metrics collected for a request/response transaction during the task execution.
 */
API_AVAILABLE(macosx(10.12), ios(10.0), watchos(3.0), tvos(10.0))
@interface NSURLSessionTaskTransactionMetrics : NSObject

/*
 * Represents the transaction request. Request transaction
 */
@property (copy, readonly) NSURLRequest *request;

/*
 * Represents the transaction response. Can be nil if error occurred and no response was generated. Response transaction
 */
@property (nullable, copy, readonly) NSURLResponse *response;

/*
 * For all NSDate metrics below, if that aspect of the task could not be completed, then the corresponding "EndDate" metric will be nil.
 * For example, if a name lookup was started but the name lookup timed out, failed, or the client canceled the task before the name could be resolved -- then while domainLookupStartDate may be set, domainLookupEndDate will be nil along with all later metrics.
 */

/*
 * The time when the client started the request, whether from the server or from the local cache
 * fetchStartDate returns the time when the user agent started fetching the resource, whether or not the resource was retrieved from the server or local resources.
 *
 * The following metrics will be set to nil, if a persistent connection was used or the resource was retrieved from local resources:
 *
 *   domainLookupStartDate
 *   domainLookupEndDate
 *   connectStartDate
 *   connectEndDate
 *   secureConnectionStartDate
 *   secureConnectionEndDate
 */
@property (nullable, copy, readonly) NSDate *fetchStartDate;

/*
 * domainLookupStartDate returns the time immediately before the user agent started the name lookup for the resource. DNS Time to start parsing
 */
@property (nullable, copy, readonly) NSDate *domainLookupStartDate;

/*
 * domainLookupEndDate returns the time after the name lookup was completed. DNS Time resolution completed
 */
@property (nullable, copy, readonly) NSDate *domainLookupEndDate;

/*
 * connectStartDate is the time immediately before the user agent started establishing the connection to the server.
 *
 * For example, this would correspond to the time immediately before the user agent started trying to establish the TCP connection. The time when the client and the server start to establish a TCP connection
 */
@property (nullable, copy, readonly) NSDate *connectStartDate;

/*
 * If an encrypted connection was used, secureConnectionStartDate is the time immediately before the user agent started the security handshake to secure the current connection. HTTPS TLS handshake start time for
 *
 * For example, this would correspond to the time immediately before the user agent started the TLS handshake.
 *
 * If an encrypted connection was not used, this attribute is set to nil.
 */
@property (nullable, copy, readonly) NSDate *secureConnectionStartDate;

/*
 * If an encrypted connection was used, secureConnectionEndDate is the time immediately after the security handshake completed. HTTPS TLS handshake end time for
 *
 * If an encrypted connection was not used, this attribute is set to nil.
 */
@property (nullable, copy, readonly) NSDate *secureConnectionEndDate;

/*
 * connectEndDate is the time immediately after the user agent finished establishing the connection to the server, including completion of security-related and other handshakes. Completion time of TCP connection between client and server, including TLS handshake time
 */
@property (nullable, copy, readonly) NSDate *connectEndDate;

/*
 * requestStartDate is the time immediately before the user agent started requesting the source, regardless of whether the resource was retrieved from the server or local resources.
 The start time of the client request can be understood as the first byte time of the header of the HTTP request
 *
 * For example, this would correspond to the time immediately before the user agent sent an HTTP GET request.
 */
@property (nullable, copy, readonly) NSDate *requestStartDate;

/*
 * requestEndDate is the time immediately after the user agent finished requesting the source, regardless of whether the resource was retrieved from the server or local resources.
 The end time of the client request can be understood as the time when the last byte of the HTTP request is transmitted
 *
 * For example, this would correspond to the time immediately after the user agent finished sending the last byte of the request.
 */
@property (nullable, copy, readonly) NSDate *requestEndDate;

/*
 * responseStartDate is the time immediately after the user agent received the first byte of the response from the server or from local resources.
 The time when the client receives the first byte of the response from the server
 *
 * For example, this would correspond to the time immediately after the user agent received the first byte of an HTTP response.
 */
@property (nullable, copy, readonly) NSDate *responseStartDate;

/*
 * responseEndDate is the time immediately after the user agent received the last byte of the resource. The time when the client receives the last request from the server
 */
@property (nullable, copy, readonly) NSDate *responseEndDate;

/*
 * The network protocol used to fetch the resource, as identified by the ALPN Protocol ID Identification Sequence [RFC7301].
 * E.g., h2, http/1.1, spdy/3.1.
 Network protocol name, such as http/1.1, spdy/3.1
 *
 * When a proxy is configured AND a tunnel connection is established, then this attribute returns the value for the tunneled protocol.
 *
 * For example:
 * If no proxy were used, and HTTP/2 was negotiated, then h2 would be returned.
 * If HTTP/1.1 were used to the proxy, and the tunneled connection was HTTP/2, then h2 would be returned.
 * If HTTP/1.1 were used to the proxy, and there were no tunnel, then http/1.1 would be returned.
 *
 */
@property (nullable, copy, readonly) NSString *networkProtocolName;

/*
 * This property is set to YES if a proxy connection was used to fetch the resource.
    Whether the connection uses a proxy
 */
@property (assign, readonly, getter=isProxyConnection) BOOL proxyConnection;

/*
 * This property is set to YES if a persistent connection was used to fetch the resource.
 Whether existing connections are reused
 */
@property (assign, readonly, getter=isReusedConnection) BOOL reusedConnection;

/*
 * Indicates whether the resource was loaded, pushed or retrieved from the local cache.
 Get resource sources
 */
@property (assign, readonly) NSURLSessionTaskMetricsResourceFetchType resourceFetchType;

/*
 * countOfRequestHeaderBytesSent is the number of bytes transferred for request header.
 Bytes of request header
 */
@property (readonly) int64_t countOfRequestHeaderBytesSent API_AVAILABLE(macos(10.15), ios(13.0), watchos(6.0), tvos(13.0));

/*
 * countOfRequestBodyBytesSent is the number of bytes transferred for request body.
 Bytes of request body
 * It includes protocol-specific framing, transfer encoding, and content encoding.
 */
@property (readonly) int64_t countOfRequestBodyBytesSent API_AVAILABLE(macos(10.15), ios(13.0), watchos(6.0), tvos(13.0));

/*
 * countOfRequestBodyBytesBeforeEncoding is the size of upload body data, file, or stream.
 Size of upload body data, file and stream
 */
@property (readonly) int64_t countOfRequestBodyBytesBeforeEncoding API_AVAILABLE(macos(10.15), ios(13.0), watchos(6.0), tvos(13.0));

/*
 * countOfResponseHeaderBytesReceived is the number of bytes transferred for response header.
 Bytes of response header
 */
@property (readonly) int64_t countOfResponseHeaderBytesReceived API_AVAILABLE(macos(10.15), ios(13.0), watchos(6.0), tvos(13.0));

/*
 * countOfResponseBodyBytesReceived is the number of bytes transferred for response body.
 Bytes of response body
 * It includes protocol-specific framing, transfer encoding, and content encoding.
 */
@property (readonly) int64_t countOfResponseBodyBytesReceived API_AVAILABLE(macos(10.15), ios(13.0), watchos(6.0), tvos(13.0));

/*
 * countOfResponseBodyBytesAfterDecoding is the size of data delivered to your delegate or completion handler.
The data size of the callback given to the proxy method or after completion

 */
@property (readonly) int64_t countOfResponseBodyBytesAfterDecoding API_AVAILABLE(macos(10.15), ios(13.0), watchos(6.0), tvos(13.0));

/*
 * localAddress is the IP address string of the local interface for the connection.
  IP address of the local interface under the current connection
 *
 * For multipath protocols, this is the local address of the initial flow.
 *
 * If a connection was not used, this attribute is set to nil.
 */
@property (nullable, copy, readonly) NSString *localAddress API_AVAILABLE(macos(10.15), ios(13.0), watchos(6.0), tvos(13.0));

/*
 * localPort is the port number of the local interface for the connection.
 Local port number under current connection

 *
 * For multipath protocols, this is the local port of the initial flow.
 *
 * If a connection was not used, this attribute is set to nil.
 */
@property (nullable, copy, readonly) NSNumber *localPort API_AVAILABLE(macos(10.15), ios(13.0), watchos(6.0), tvos(13.0));

/*
 * remoteAddress is the IP address string of the remote interface for the connection.
 Remote IP address under current connection
 *
 * For multipath protocols, this is the remote address of the initial flow.
 *
 * If a connection was not used, this attribute is set to nil.
 */
@property (nullable, copy, readonly) NSString *remoteAddress API_AVAILABLE(macos(10.15), ios(13.0), watchos(6.0), tvos(13.0));

/*
 * remotePort is the port number of the remote interface for the connection.
  Remote port number under current connection
 *
 * For multipath protocols, this is the remote port of the initial flow.
 *
 * If a connection was not used, this attribute is set to nil.
 */
@property (nullable, copy, readonly) NSNumber *remotePort API_AVAILABLE(macos(10.15), ios(13.0), watchos(6.0), tvos(13.0));

/*
 * negotiatedTLSProtocolVersion is the TLS protocol version negotiated for the connection.
  TLS protocol version number for connection negotiation
 * It is a 2-byte sequence in host byte order.
 *
 * Please refer to tls_protocol_version_t enum in Security/SecProtocolTypes.h
 *
 * If an encrypted connection was not used, this attribute is set to nil.
 */
@property (nullable, copy, readonly) NSNumber *negotiatedTLSProtocolVersion API_AVAILABLE(macos(10.15), ios(13.0), watchos(6.0), tvos(13.0));

/*
 * negotiatedTLSCipherSuite is the TLS cipher suite negotiated for the connection.
 TLS cipher suite for connection negotiation
 * It is a 2-byte sequence in host byte order.
 *
 * Please refer to tls_ciphersuite_t enum in Security/SecProtocolTypes.h
 *
 * If an encrypted connection was not used, this attribute is set to nil.
 */
@property (nullable, copy, readonly) NSNumber *negotiatedTLSCipherSuite API_AVAILABLE(macos(10.15), ios(13.0), watchos(6.0), tvos(13.0));

/*
 * Whether the connection is established over a cellular interface.
 Is the connection established through cellular network
 */
@property (readonly, getter=isCellular) BOOL cellular API_AVAILABLE(macos(10.15), ios(13.0), watchos(6.0), tvos(13.0));

/*
 * Whether the connection is established over an expensive interface.
 Is the connection established through an expensive interface
 */
@property (readonly, getter=isExpensive) BOOL expensive API_AVAILABLE(macos(10.15), ios(13.0), watchos(6.0), tvos(13.0));

/*
 * Whether the connection is established over a constrained interface.
 Is the connection established through a restricted interface
 */
@property (readonly, getter=isConstrained) BOOL constrained API_AVAILABLE(macos(10.15), ios(13.0), watchos(6.0), tvos(13.0));

/*
 * Whether a multipath protocol is successfully negotiated for the connection.
 Whether the multipath protocol was negotiated successfully for connection
 */
@property (readonly, getter=isMultipath) BOOL multipath API_AVAILABLE(macos(10.15), ios(13.0), watchos(6.0), tvos(13.0));


- (instancetype)init API_DEPRECATED("Not supported", macos(10.12,10.15), ios(10.0,13.0), watchos(3.0,6.0), tvos(10.0,13.0));
+ (instancetype)new API_DEPRECATED("Not supported", macos(10.12,10.15), ios(10.0,13.0), watchos(3.0,6.0), tvos(10.0,13.0));

@end
Simple code for network monitoring
// Basic monitoring information
@interface  NetworkMonitorBaseDataModel : NSObject
// Requested URL address
@property (nonatomic, strong) NSString *requestUrl;
//Request header
@property (nonatomic, strong) NSArray *requestHeaders;
//Response header
@property (nonatomic, strong) NSArray *responseHeaders;
//Request parameters for GET method
@property (nonatomic, strong) NSString *getRequestParams;
//HTTP methods, such as POST
@property (nonatomic, strong) NSString *httpMethod;
//Protocol name, such as http1.0 / http1.1 / http2.0
@property (nonatomic, strong) NSString *httpProtocol;
//Use agent or not
@property (nonatomic, assign) BOOL useProxy;
//IP address after DNS resolution
@property (nonatomic, strong) NSString *ip;
@end

// Monitoring information model
@interface  NetworkMonitorDataModel : NetworkMonitorBaseDataModel
//Time when the client initiated the request
@property (nonatomic, assign) UInt64 requestDate;
//Waiting time from client start request to start dns resolution, in ms
@property (nonatomic, assign) int waitDNSTime;
//DNS resolution time consuming
@property (nonatomic, assign) int dnsLookupTime;
//tcp three time handshake, in ms
@property (nonatomic, assign) int tcpTime;
//ssl handshake time consuming
@property (nonatomic, assign) int sslTime;
//The time consumption of a complete request, in ms
@property (nonatomic, assign) int requestTime;
//http response code
@property (nonatomic, assign) NSUInteger httpCode;
//Bytes sent
@property (nonatomic, assign) UInt64 sendBytes;
//Bytes received
@property (nonatomic, assign) UInt64 receiveBytes;


// Error message model
@interface  NetworkMonitorErrorModel : NetworkMonitorBaseDataModel
//Error code
@property (nonatomic, assign) NSInteger errorCode;
//Number of errors
@property (nonatomic, assign) NSUInteger errCount;
//Exception name
@property (nonatomic, strong) NSString *exceptionName;
//Exception details
@property (nonatomic, strong) NSString *exceptionDetail;
//Exception stack
@property (nonatomic, strong) NSString *stackTrace;
@end


// Inherit from the abstract class of NSURLProtocol, implement the response method and proxy the network request
@interface CustomURLProtocol () <NSURLSessionTaskDelegate>

@property (nonatomic, strong) NSURLSessionDataTask *dataTask;
@property (nonatomic, strong) NSOperationQueue *sessionDelegateQueue;
@property (nonatomic, strong) NetworkMonitorDataModel *dataModel;
@property (nonatomic, strong) NetworkMonitorErrorModel *errModel;

@end

//Request network using NSURLSessionDataTask
- (void)startLoading {
    NSURLSessionConfiguration *configuration = [NSURLSessionConfiguration defaultSessionConfiguration];
      NSURLSession *session = [NSURLSession sessionWithConfiguration:configuration
                                                          delegate:self
                                                     delegateQueue:nil];
    NSURLSession *session = [NSURLSession sessionWithConfiguration:configuration delegate:self delegateQueue:nil];
      self.sessionDelegateQueue = [[NSOperationQueue alloc] init];
    self.sessionDelegateQueue.maxConcurrentOperationCount = 1;
    self.sessionDelegateQueue.name = @"com.networkMonitor.session.queue";
    self.dataTask = [session dataTaskWithRequest:self.request];
    [self.dataTask resume];
}

#pragma mark - NSURLSessionTaskDelegate
- (void)URLSession:(NSURLSession *)session task:(NSURLSessionTask *)task didCompleteWithError:(NSError *)error {
    if (error) {
        [self.client URLProtocol:self didFailWithError:error];
    } else {
        [self.client URLProtocolDidFinishLoading:self];
    }
    if (error) {
        NSURLRequest *request = task.currentRequest;
        if (request) {
            self.errModel.requestUrl  = request.URL.absoluteString;
            self.errModel.httpMethod = request.HTTPMethod;
            self.errModel.requestParams = request.URL.query;
        }
        self.errModel.errorCode = error.code;
        self.errModel.exceptionName = error.domain;
        self.errModel.exceptionDetail = error.description;
      // Upload the Network data to the data reporting component, which will create a powerful, flexible and configurable data reporting component( https://github.com/FantasticLBP/knowledge-kit/blob/master/Chapter1%20-%20iOS/1.80.md )Talk about
    }
    self.dataTask = nil;
}


- (void)URLSession:(NSURLSession *)session task:(NSURLSessionTask *)task didFinishCollectingMetrics:(NSURLSessionTaskMetrics *)metrics {
       if (@available(iOS 10.0, *) && [metrics.transactionMetrics count] > 0) {
        [metrics.transactionMetrics enumerateObjectsUsingBlock:^(NSURLSessionTaskTransactionMetrics *_Nonnull obj, NSUInteger idx, BOOL *_Nonnull stop) {
            if (obj.resourceFetchType == NSURLSessionTaskMetricsResourceFetchTypeNetworkLoad) {
                if (obj.fetchStartDate) {
                    self.dataModel.requestDate = [obj.fetchStartDate timeIntervalSince1970] * 1000;
                }
                if (obj.domainLookupStartDate && obj.domainLookupEndDate) {
                    self.dataModel. waitDNSTime = ceil([obj.domainLookupStartDate timeIntervalSinceDate:obj.fetchStartDate] * 1000);
                    self.dataModel. dnsLookupTime = ceil([obj.domainLookupEndDate timeIntervalSinceDate:obj.domainLookupStartDate] * 1000);
                }
                if (obj.connectStartDate) {
                    if (obj.secureConnectionStartDate) {
                        self.dataModel. waitDNSTime = ceil([obj.secureConnectionStartDate timeIntervalSinceDate:obj.connectStartDate] * 1000);
                    } else if (obj.connectEndDate) {
                        self.dataModel.tcpTime = ceil([obj.connectEndDate timeIntervalSinceDate:obj.connectStartDate] * 1000);
                    }
                }
                if (obj.secureConnectionEndDate && obj.secureConnectionStartDate) {
                    self.dataModel.sslTime = ceil([obj.secureConnectionEndDate timeIntervalSinceDate:obj.secureConnectionStartDate] * 1000);
                }

                if (obj.fetchStartDate && obj.responseEndDate) {
                    self.dataModel.requestTime = ceil([obj.responseEndDate timeIntervalSinceDate:obj.fetchStartDate] * 1000);
                }

                self.dataModel.httpProtocol = obj.networkProtocolName;

                NSHTTPURLResponse *response = (NSHTTPURLResponse *)obj.response;
                if ([response isKindOfClass:NSHTTPURLResponse.class]) {
                    self.dataModel.receiveBytes = response.expectedContentLength;
                }

                if ([obj respondsToSelector:@selector(_remoteAddressAndPort)]) {
                    self.dataModel.ip = [obj valueForKey:@"_remoteAddressAndPort"];
                }

                if ([obj respondsToSelector:@selector(_requestHeaderBytesSent)]) {
                    self.dataModel.sendBytes = [[obj valueForKey:@"_requestHeaderBytesSent"] unsignedIntegerValue];
                }
                if ([obj respondsToSelector:@selector(_responseHeaderBytesReceived)]) {
                    self.dataModel.receiveBytes = [[obj valueForKey:@"_responseHeaderBytesReceived"] unsignedIntegerValue];
                }

               self.dataModel.requestUrl = [obj.request.URL absoluteString];
                self.dataModel.httpMethod = obj.request.HTTPMethod;
                self.dataModel.useProxy = obj.isProxyConnection;
            }
        }];
                // Upload the Network data to the data reporting component, which will create a powerful, flexible and configurable data reporting component( https://github.com/FantasticLBP/knowledge-kit/blob/master/Chapter1%20-%20iOS/1.80.md )Talk about
    }
}
2.2 scheme 2: Dark Magic chapter of NSURLProtocol monitoring App network request
Above the article 2.1 It is analyzed that due to the compatibility problem of nsurlsessiontaskmetric, it seems that it is not perfect for network monitoring, but I saw an article when I searched the data later article . When analyzing WebView's network monitoring, the article found the following code when analyzing the source code of Webkit
#if !HAVE(TIMINGDATAOPTIONS)
void setCollectsTimingData()
{
    static dispatch_once_t onceToken;
    dispatch_once(&onceToken, ^{
        [NSURLConnection _setCollectsTimingData:YES];
        ...
    });
}
#endif
That is to say, NSURLConnection itself has a set of timing data collection API, but it is not exposed to developers, and apple is using it. Found NSURLConnection's in runtime header_ setCollects TimingData: ,_ Timing data API (IOS 8 can be used later).
NSURLSession used before IOS 9_ setCollectsTimingData: you can use TimingData.
be careful:
- Because it is a private API, pay attention to confusion when using it. For example [@ "_ setC" stringByAppendingString:@"ollectsT"] stringByAppendingString:@"imingData:"].
- Private API s are not recommended. Generally speaking, APM belongs to the public team. Think about it. Although your SDK achieves the goal of network monitoring, if it causes problems to the App of the business line, it won't pay. Generally, this kind of opportunism is not 100% certain that things can be used in the toy stage.
@interface _NSURLConnectionProxy : DelegateProxy

@end

@implementation _NSURLConnectionProxy

- (BOOL)respondsToSelector:(SEL)aSelector
{
    if ([NSStringFromSelector(aSelector) isEqualToString:@"connectionDidFinishLoading:"]) {
        return YES;
    }
    return [self.target respondsToSelector:aSelector];
}

- (void)forwardInvocation:(NSInvocation *)invocation
{
    [super forwardInvocation:invocation];
    if ([NSStringFromSelector(invocation.selector) isEqualToString:@"connectionDidFinishLoading:"]) {
        __unsafe_unretained NSURLConnection *conn;
        [invocation getArgument:&conn atIndex:2];
        SEL selector = NSSelectorFromString([@"_timin" stringByAppendingString:@"gData"]);
        NSDictionary *timingData = [conn performSelector:selector];
        [[NTDataKeeper shareInstance] trackTimingData:timingData request:conn.currentRequest];
    }
}

@end

@implementation NSURLConnection(tracker)

+ (void)load
{
    static dispatch_once_t onceToken;
    dispatch_once(&onceToken, ^{
        Class class = [self class];

        SEL originalSelector = @selector(initWithRequest:delegate:);
        SEL swizzledSelector = @selector(swizzledInitWithRequest:delegate:);

        Method originalMethod = class_getInstanceMethod(class, originalSelector);
        Method swizzledMethod = class_getInstanceMethod(class, swizzledSelector);
        method_exchangeImplementations(originalMethod, swizzledMethod);

        NSString *selectorName = [[@"_setC" stringByAppendingString:@"ollectsT"] stringByAppendingString:@"imingData:"];
        SEL selector = NSSelectorFromString(selectorName);
        [NSURLConnection performSelector:selector withObject:@(YES)];
    });
}

- (instancetype)swizzledInitWithRequest:(NSURLRequest *)request delegate:(id<NSURLConnectionDelegate>)delegate
{
    if (delegate) {
        _NSURLConnectionProxy *proxy = [[_NSURLConnectionProxy alloc] initWithTarget:delegate];
        objc_setAssociatedObject(delegate ,@"_NSURLConnectionProxy" ,proxy, OBJC_ASSOCIATION_RETAIN_NONATOMIC);
        return [self swizzledInitWithRequest:request delegate:(id<NSURLConnectionDelegate>)proxy];
    }else{
        return [self swizzledInitWithRequest:request delegate:delegate];
    }
}

@end
2.3 scheme three: Hook
There are two kinds of hook technologies in iOS, one is NSProxy, the other is method swizzling (isa swizzling)
2.3.1 method I
It's impossible to manually enter the business code by writing the SDK (you don't have the right to submit to the online code 😂) , so whether it is APM or traceless buried point, it is through Hook.
Aspect oriented programming (AOP) is a kind of programming paradigm in computer science, which further separates crosscutting concerns from business subjects to improve the modularity of program code. Add functions to the program dynamically without modifying the source code. Its core idea is to separate the business logic (core concerns, main functions of the system) from the common functions (crosscutting concerns, such as the log system), reduce the complexity, and maintain the modularity, maintainability and reusability of the system. It is often used in log system, performance statistics, security control, transaction processing, exception handling and other scenarios.
AOP implementation in iOS is based on the Runtime mechanism. At present, there are three ways: Method Swizzling, NSProxy, FishHook (mainly used for hook c code).
Above the article 2.1 This paper discusses the scenarios that meet most of the requirements. NSURLProtocol monitors the network requests of NSURLConnection and NSURLSession. After its agent, it can initiate network requests and get such information as request start time, request end time and header information. However, it cannot get very detailed network performance data, such as DNS start resolution time and DNS start resolution time How long does it take to parse, when reponse starts to return, how long it returns, etc. After IOS 10, nsurlsessiontask delegate added a proxy method - (void) urlsession: (NSURLSession *) session task: (nsurlsessiontask *) task diffinishcollectingmetrics: (nsurlsessiontasmetrics *) metrics API_ Available (MAC OS X (10.12), IOS (10.0), watchos (3.0), tvos (10.0)); we can get accurate network data. But it's compatible. Above the article 2.2 This paper discusses the information obtained from the source code of Webkit through the private method_ setCollectsTimingData: ,_ TimingData can be obtained from TimingData.
However, if it is necessary to monitor all the network requests, it will not meet the requirements. After consulting the data, it is found that alibaichuan has an APM solution, so there is a solution 3. For network monitoring, the following processing needs to be done
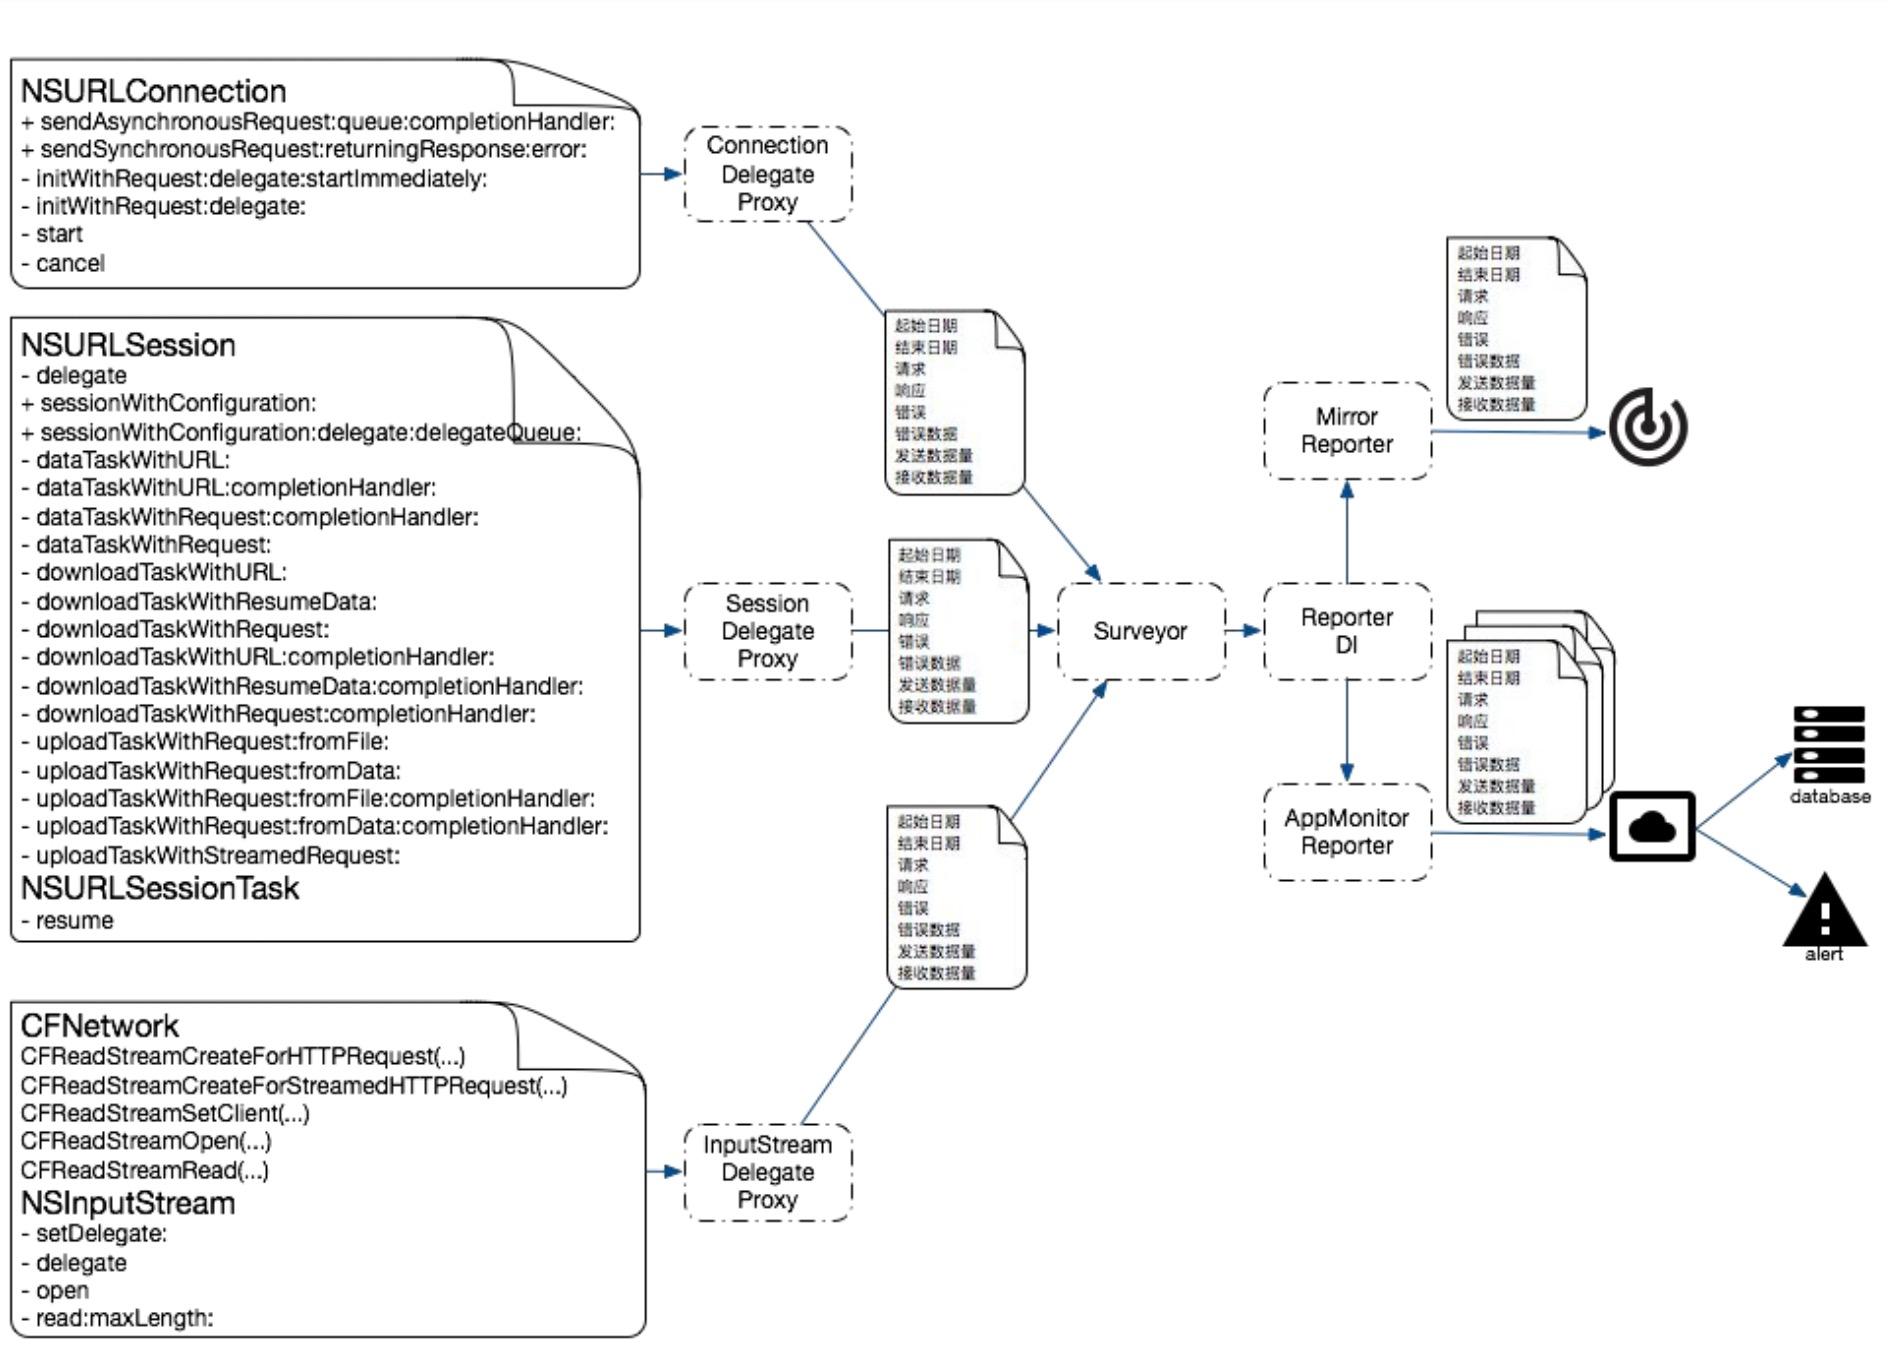
It may be strange to CFNetwork. You can see the hierarchy and simple usage of CFNetwork
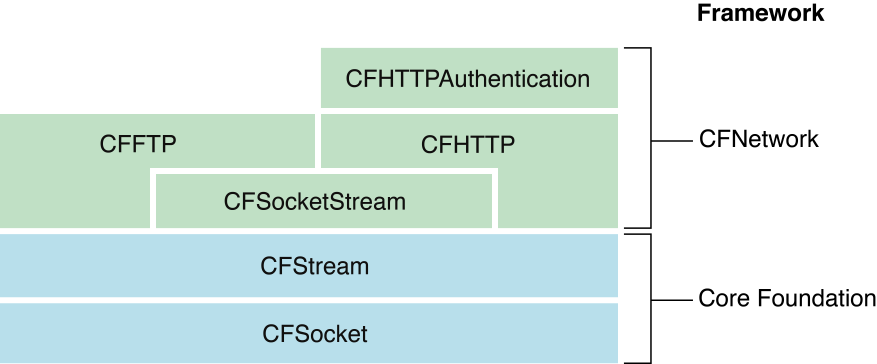
CFNetwork is based on CFSocket and CFStream.
CFSocket: socket is the bottom foundation of network communication. It can let two socket ports send data to each other. BSD socket is the most commonly used socket abstraction in iOS. CFSocket is the OC package of BSD socket, which realizes almost all BSD functions and adds RunLoop.
CFStream: provides a device independent method for reading and writing data. It can be used to establish a stream for the data of memory, file and network (using socket). Using stream, all data can not be written to memory. CFStream provides API s to abstract two types of CFType objects: CFReadStream and CFWriteStream. It is also the foundation of CFHTTP and CFFTP.
Simple Demo
- (void)testCFNetwork
{
    CFURLRef urlRef = CFURLCreateWithString(kCFAllocatorDefault, CFSTR("https://httpbin.org/get"), NULL);
    CFHTTPMessageRef httpMessageRef = CFHTTPMessageCreateRequest(kCFAllocatorDefault, CFSTR("GET"), urlRef, kCFHTTPVersion1_1);
    CFRelease(urlRef);

    CFReadStreamRef readStream = CFReadStreamCreateForHTTPRequest(kCFAllocatorDefault, httpMessageRef);
    CFRelease(httpMessageRef);

    CFReadStreamScheduleWithRunLoop(readStream, CFRunLoopGetCurrent(), kCFRunLoopCommonModes);

    CFOptionFlags eventFlags = (kCFStreamEventHasBytesAvailable | kCFStreamEventErrorOccurred | kCFStreamEventEndEncountered);
    CFStreamClientContext context = {
        0,
        NULL,
        NULL,
        NULL,
       NULL
    } ;
    // Assigns a client to a stream, which receives callbacks when certain events occur.
    CFReadStreamSetClient(readStream, eventFlags, CFNetworkRequestCallback, &context);
    // Opens a stream for reading.
    CFReadStreamOpen(readStream);
}
// callback
void CFNetworkRequestCallback (CFReadStreamRef _Null_unspecified stream, CFStreamEventType type, void * _Null_unspecified clientCallBackInfo) {
    CFMutableDataRef responseBytes = CFDataCreateMutable(kCFAllocatorDefault, 0);
    CFIndex numberOfBytesRead = 0;
    do {
        UInt8 buffer[2014];
        numberOfBytesRead = CFReadStreamRead(stream, buffer, sizeof(buffer));
        if (numberOfBytesRead > 0) {
            CFDataAppendBytes(responseBytes, buffer, numberOfBytesRead);
        }
    } while (numberOfBytesRead > 0);


    CFHTTPMessageRef response = (CFHTTPMessageRef)CFReadStreamCopyProperty(stream, kCFStreamPropertyHTTPResponseHeader);
    if (responseBytes) {
        if (response) {
            CFHTTPMessageSetBody(response, responseBytes);
        }
        CFRelease(responseBytes);
    }

    // close and cleanup
    CFReadStreamClose(stream);
    CFReadStreamUnscheduleFromRunLoop(stream, CFRunLoopGetCurrent(), kCFRunLoopCommonModes);
    CFRelease(stream);

    // print response
    if (response) {
        CFDataRef reponseBodyData = CFHTTPMessageCopyBody(response);
        CFRelease(response);

        printResponseData(reponseBodyData);
        CFRelease(reponseBodyData);
    }
}

void printResponseData (CFDataRef responseData) {
    CFIndex dataLength = CFDataGetLength(responseData);
    UInt8 *bytes = (UInt8 *)malloc(dataLength);
    CFDataGetBytes(responseData, CFRangeMake(0, CFDataGetLength(responseData)), bytes);
    CFStringRef responseString = CFStringCreateWithBytes(kCFAllocatorDefault, bytes, dataLength, kCFStringEncodingUTF8, TRUE);
    CFShow(responseString);
    CFRelease(responseString);
    free(bytes);
}
// console
{
  "args": {},
  "headers": {
    "Host": "httpbin.org",
    "User-Agent": "Test/1 CFNetwork/1125.2 Darwin/19.3.0",
    "X-Amzn-Trace-Id": "Root=1-5e8980d0-581f3f44724c7140614c2564"
  },
  "origin": "183.159.122.102",
  "url": "https://httpbin.org/get"
}
We know that the use of NSURLSession, NSURLConnection and CFNetwork needs to call a bunch of methods to set and then need to set the proxy object to implement the proxy method. Therefore, the first idea of monitoring this situation is to use runtime hook to drop the method level. But there is no way to hook the proxy method for the set proxy object, because we do not know which class the proxy object is. So we can use hook to set the proxy object, replace the proxy object with a class we designed, and then let this class implement the proxy methods related to NSURLConnection, NSURLSession and CFNetwork. Then call the method implementation of the original proxy object inside these methods. So our requirements can be met. We can get monitoring data in corresponding methods, such as request start time, end time, status code, content size, etc.
NSURLSession and NSURLConnection hook are as follows.
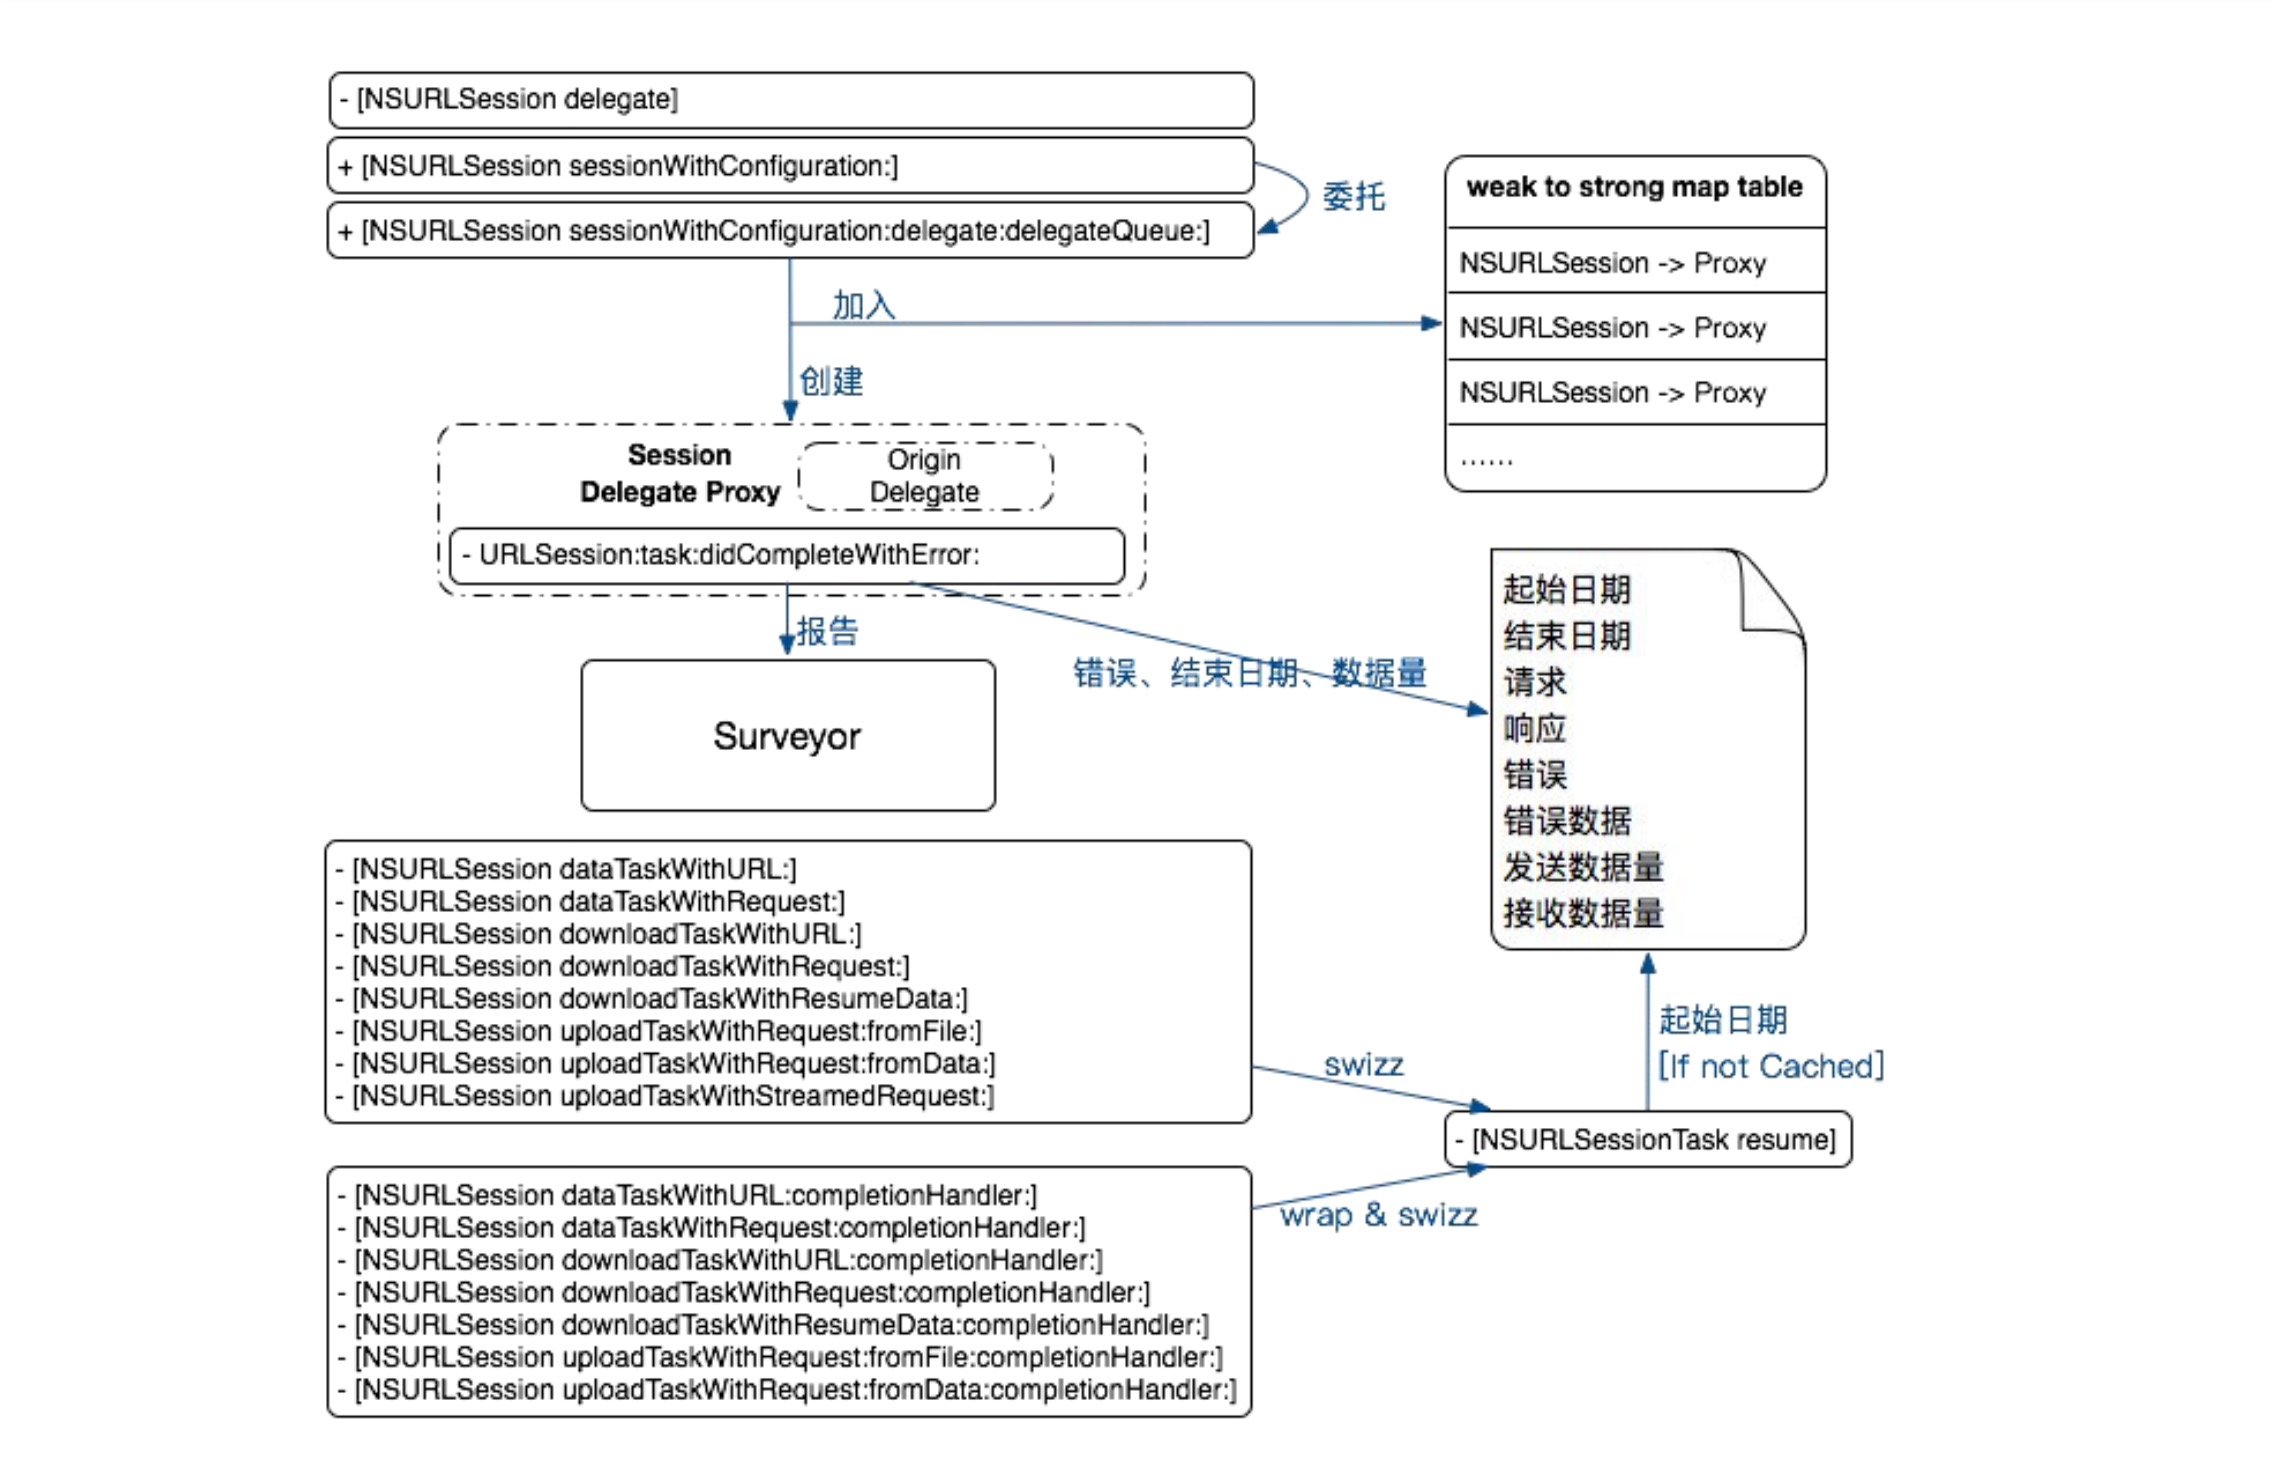
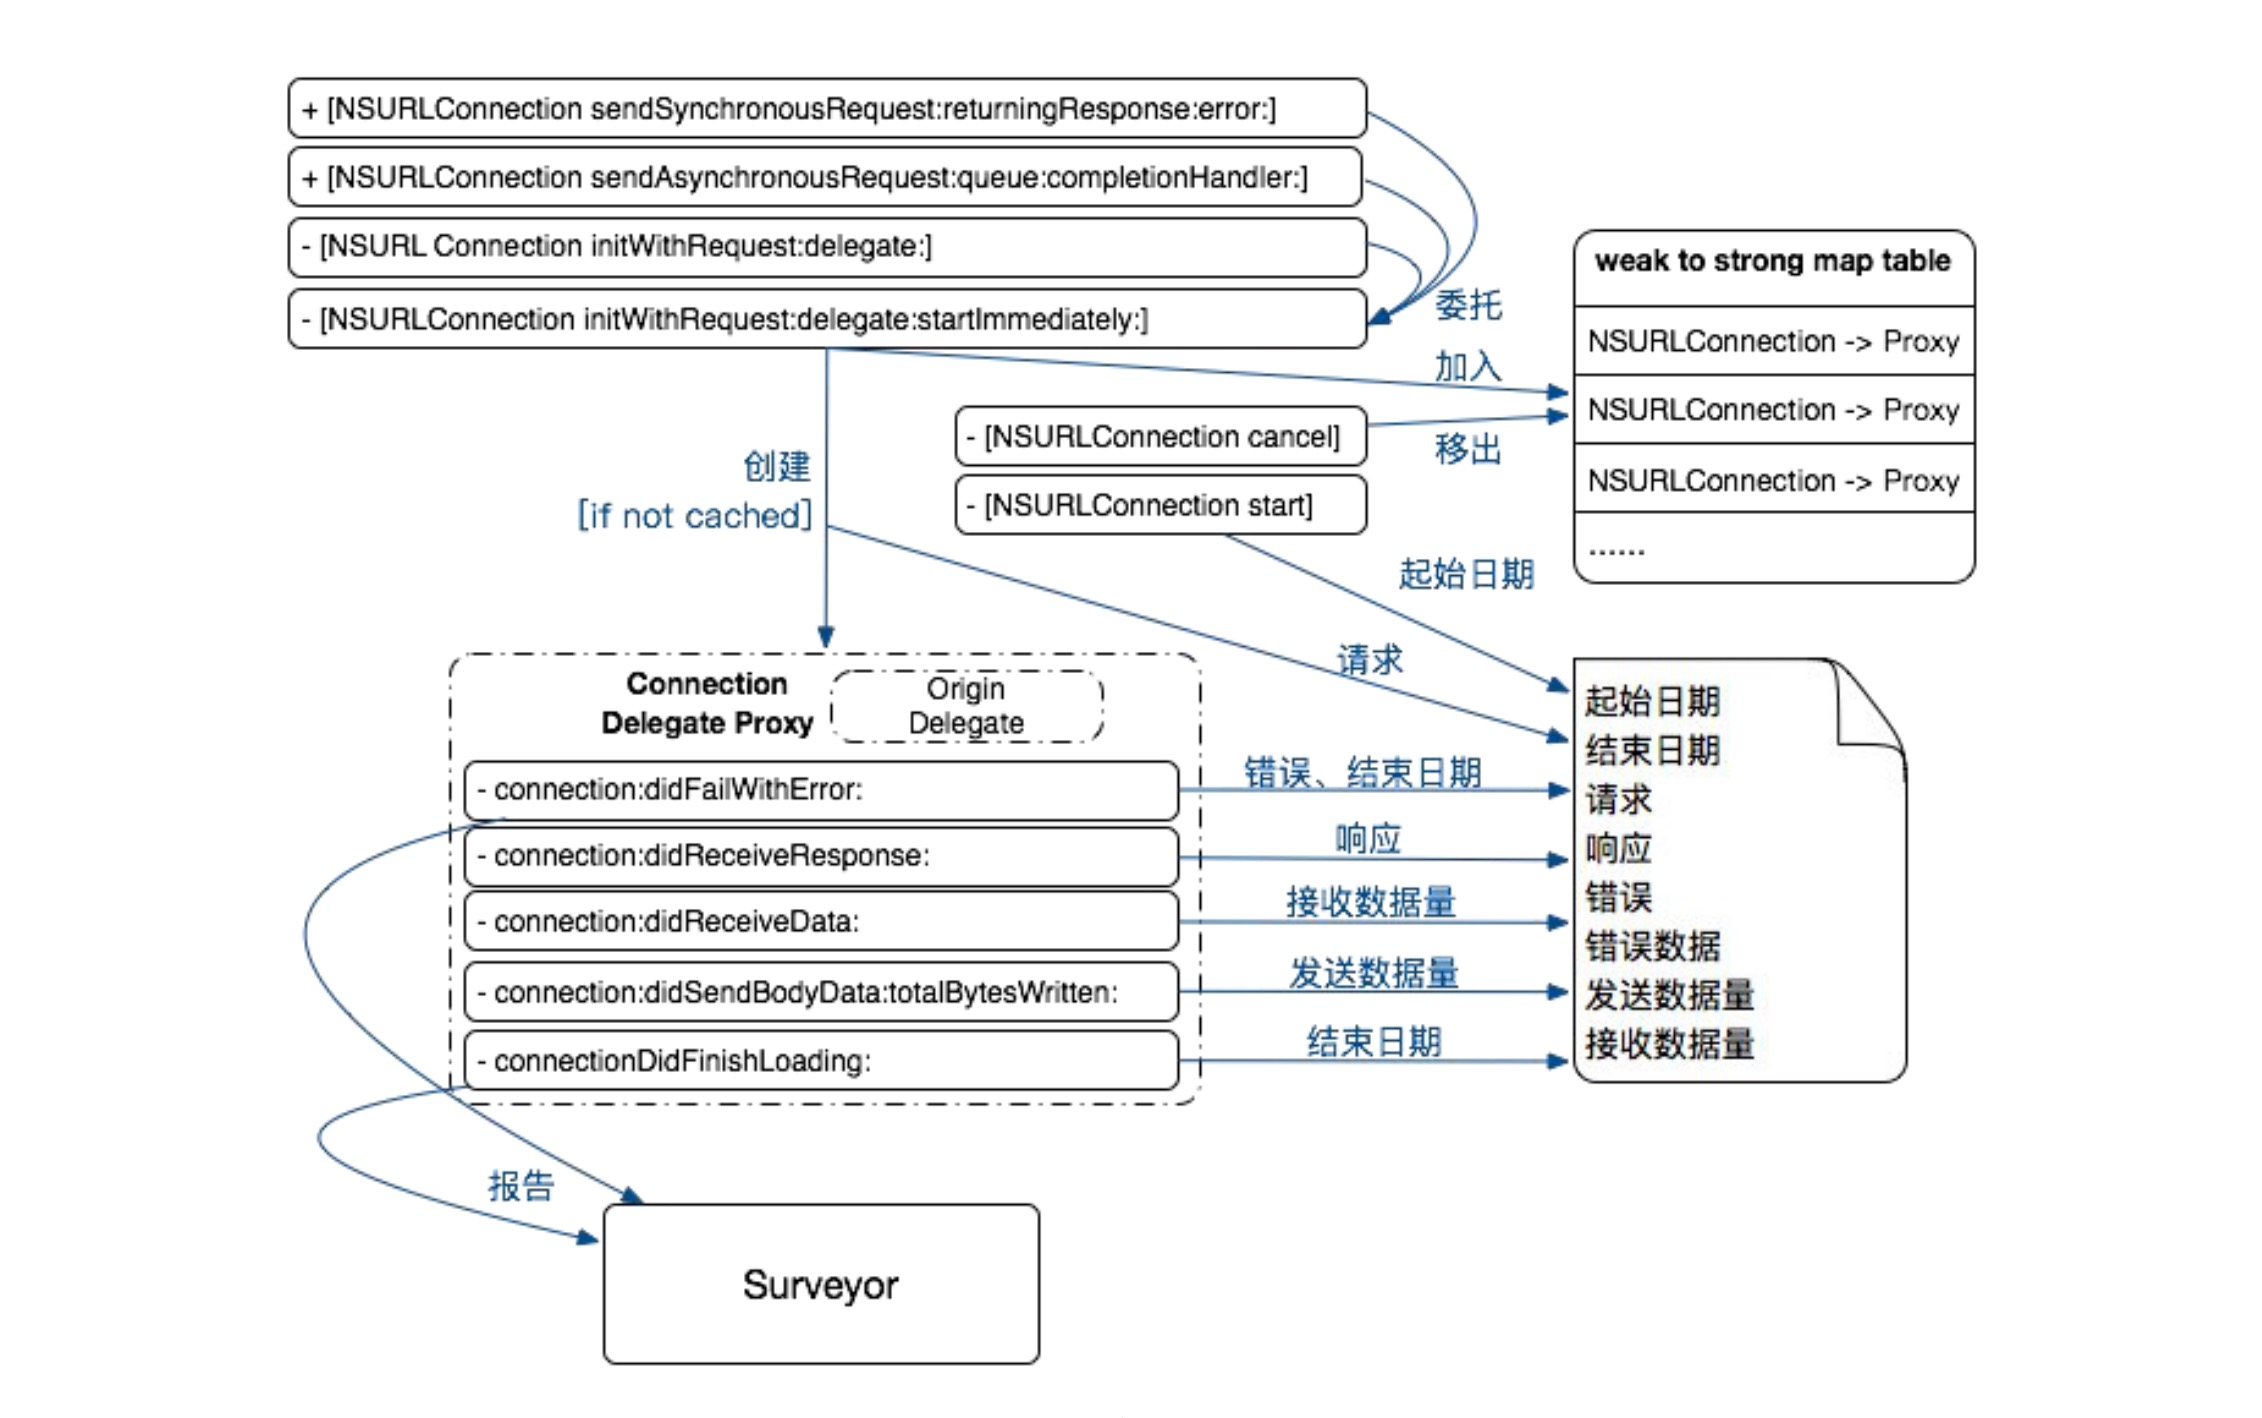
There are APM solutions for CFNetwork in the industry, which are summarized as follows:
CFNetwork is implemented in c language. To hook c code, Dynamic Loader Hook library is needed- fishhook.
Dynamic Loader (dynamic LD) binds symbols by updating pointers stored in Mach-O files. It can be borrowed to modify the function pointer of C function call at Runtime. Implementation principle of fishhook: traversal__ In DATA segment__ nl_symbol_ptr ,__ La_ symbol_ The symbols in the two section s of PTR, through the cooperation of Indirect Symbol Table, Symbol Table and String Table, find their own functions to replace, and achieve the purpose of hook.
/* Returns the number of bytes read, or -1 if an error occurs preventing any
bytes from being read, or 0 if the stream's end was encountered.
It is an error to try and read from a stream that hasn't been opened first.
This call will block until at least one byte is available; it will NOT block
until the entire buffer can be filled. To avoid blocking, either poll using
CFReadStreamHasBytesAvailable() or use the run loop and listen for the
kCFStreamEventHasBytesAvailable event for notification of data available. */
CF_EXPORT
CFIndex CFReadStreamRead(CFReadStreamRef _Null_unspecified stream, UInt8 * _Null_unspecified buffer, CFIndex bufferLength);
CFNetwork uses CFReadStreamRef to pass data and callback functions to receive the response from the server. When the callback function receives
The specific steps and key codes are as follows, with an example of asurlconnection
- Because there are many places to look, write a method swizzling tool class
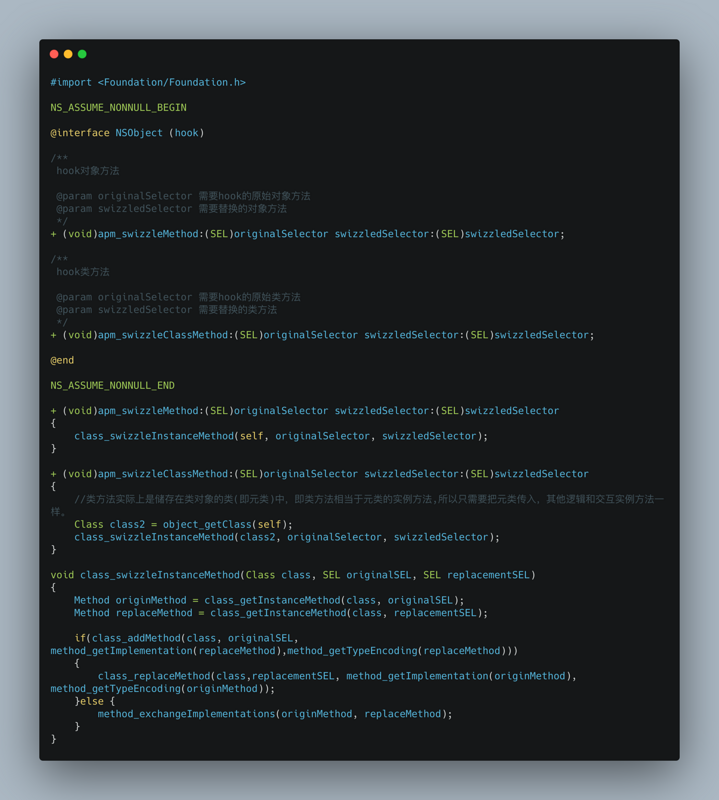
- Create a class inherited from the NSProxy abstract class, and implement the corresponding methods.
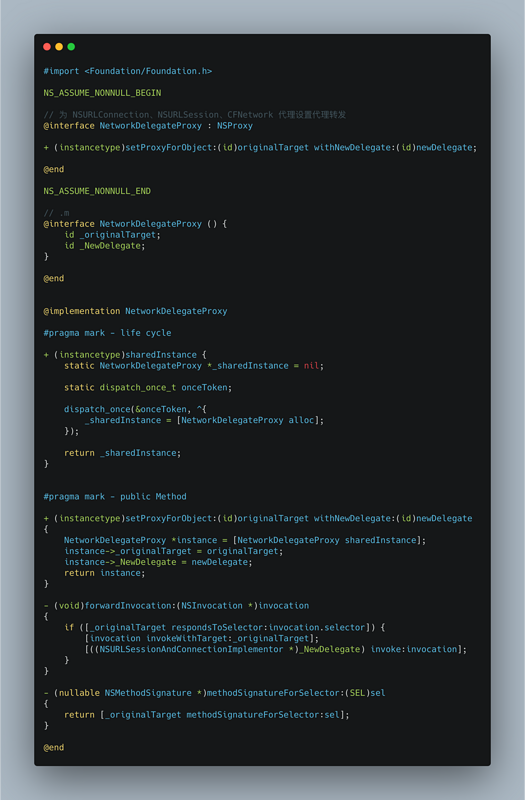
- Create an object to implement the NSURLConnection, NSURLSession, and NSIuputStream proxy methods
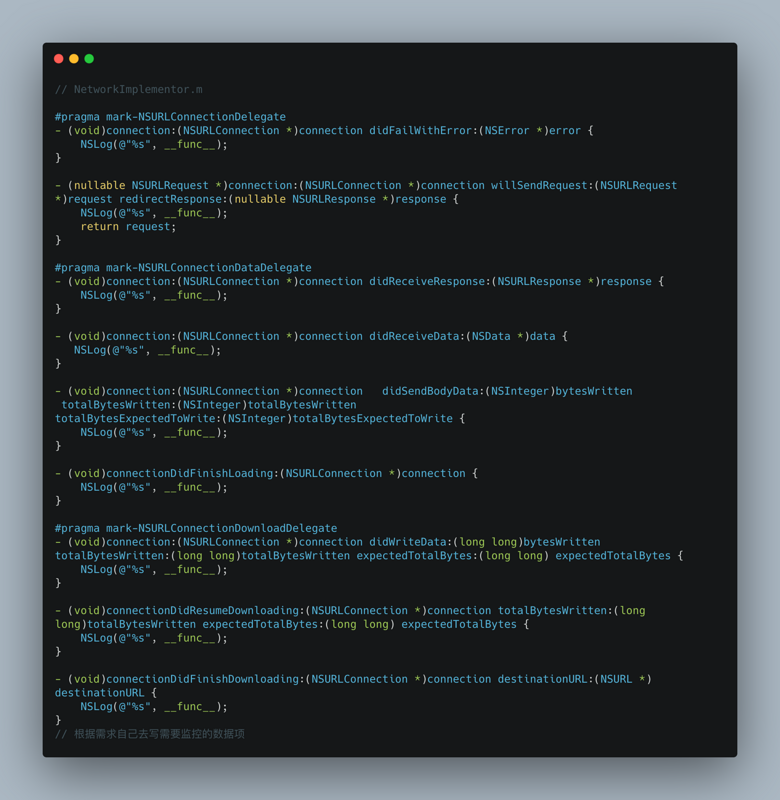
- Add Category to asurlconnection, and specifically set hook proxy object and hook asurlconnection object method
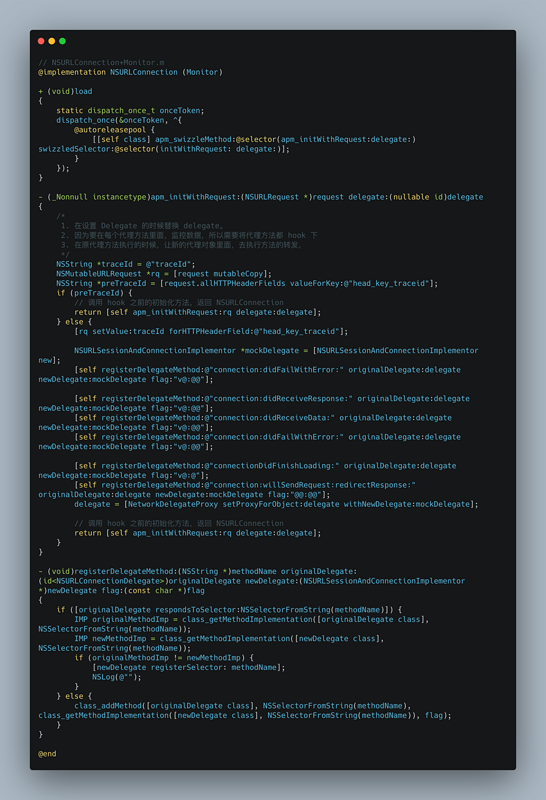
In this way, the network information can be monitored, and then the data will be handed over to the data reporting SDK to report the data according to the data reporting strategy issued.
2.3.2 method 2
In fact, there is another way to meet the above requirements, that is, isa swizzling.
By the way, after the above hook for NSURLConnection, NSURLSession, and NSInputStream proxy objects, NSProxy is used to forward the proxy object methods. There is another way to achieve this, that is, isa swizzling.
- Method swizzling principle
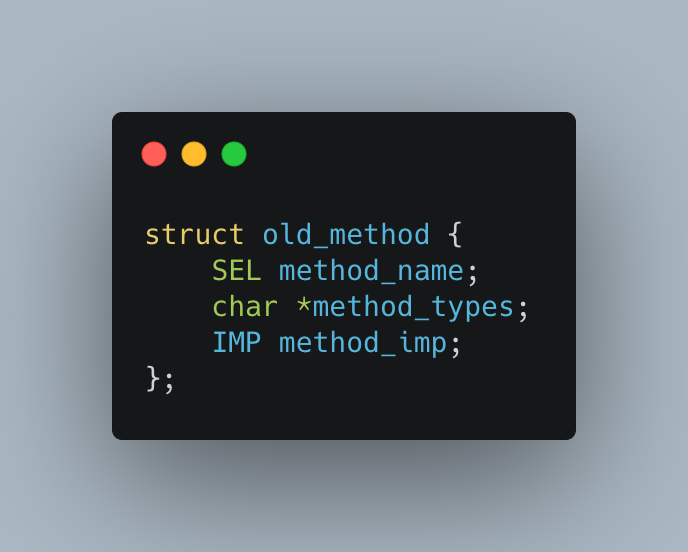
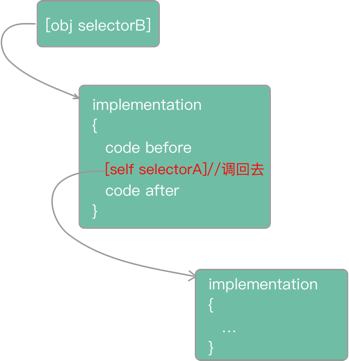
The improved version of method swizzling is as follows
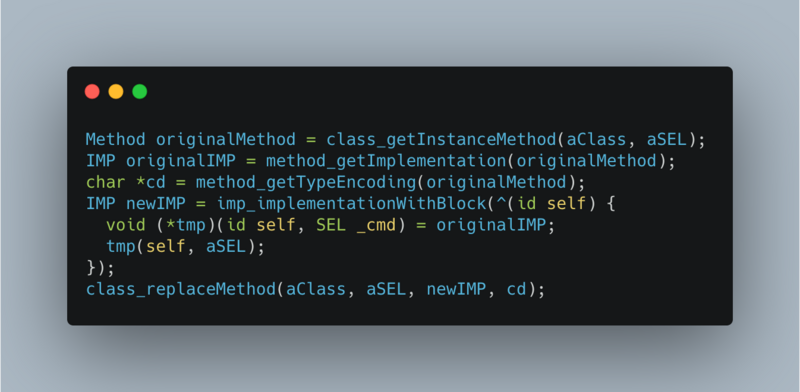
- isa swizzling
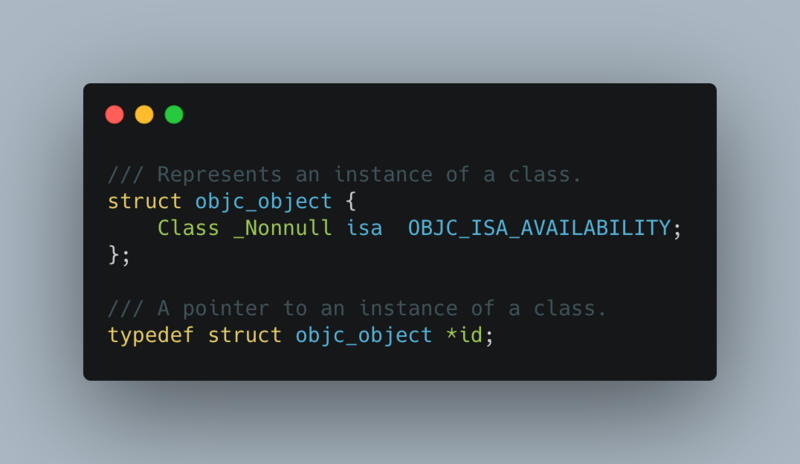
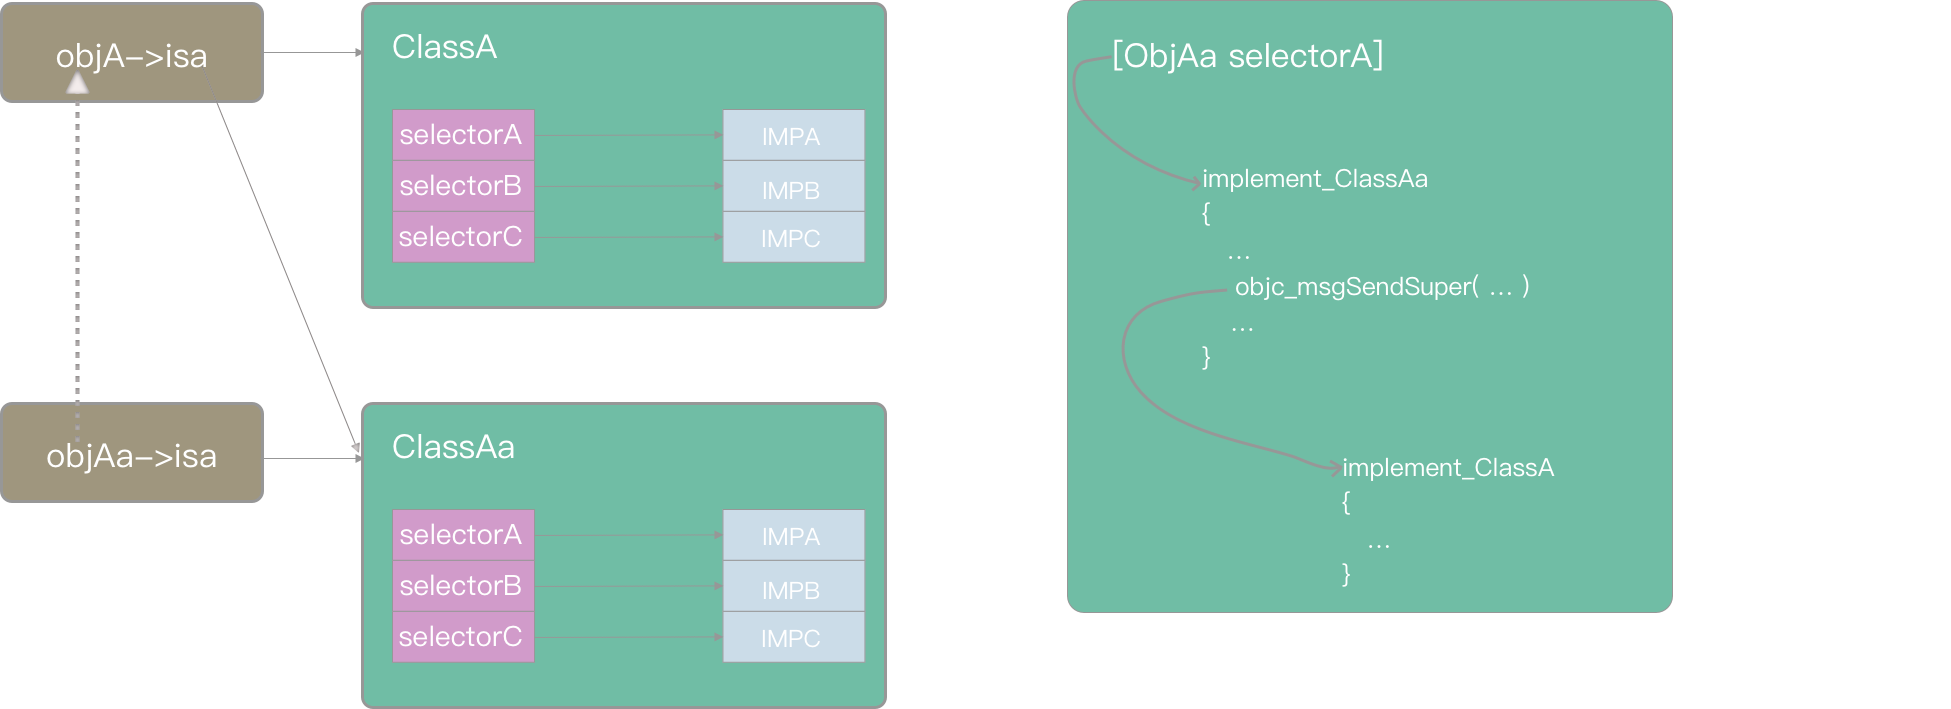
Let's analyze why modifying isa can achieve the goal?
- People who write APM monitoring cannot determine the business code
- It is not possible to write some classes for the convenience of APM monitoring, so that business line developers can not use the system NSURLSession and NSURLConnection classes
Think about how KVO works? Combined with the above figure
- Create monitor object subclass
- Override getter and seeter of properties in subclass
- Point the isa pointer of the monitoring object to the newly created subclass
- Intercept the change of the value in the getter and setter of the subclass, and inform the monitoring object of the change of the value
- Restore isa of monitoring object after monitoring
According to this idea, we can also dynamically create subclasses in the load methods of NSURLConnection and NSURLSession, and override methods in subclasses, such as - (* * nullable * * * instancetype * *) initwithrequest: (nsurlrequest *) request delegate: (* * nullable * * * id * *) delegate startimmediate: (* * bool * *) startimmediate;, and then set isa points to a subclass created dynamically. Restore the isa pointer after these methods are processed.
However, isa swizzling is aimed at method swizzling, and the proxy object is uncertain, so NSProxy is still needed for dynamic processing.
As for how to modify isa, I write a simple Demo to simulate KVO
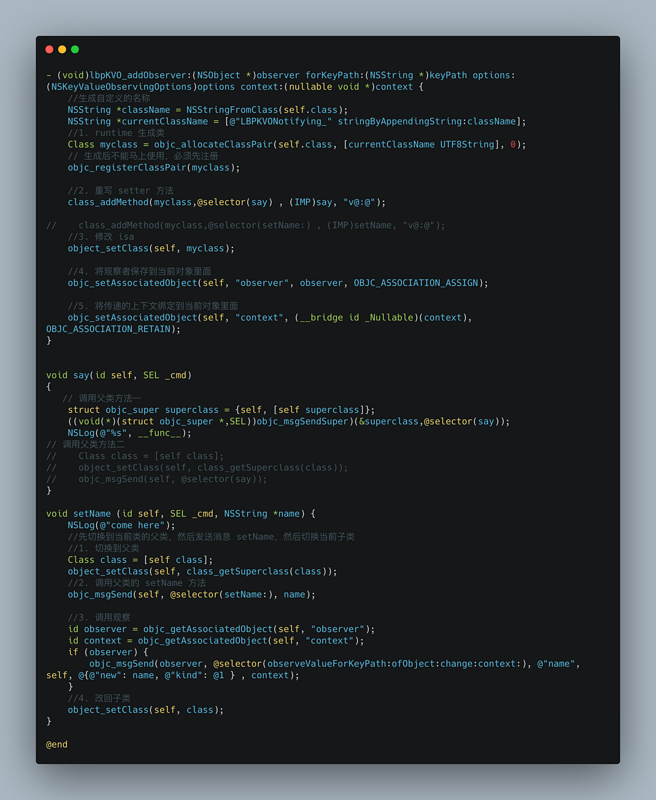
2.4 scheme 4: monitor common network requests of App
For the sake of cost, most of the network capacity of current projects is through AFNetworking So the network monitoring of this paper can be completed quickly.
AFNetworking will be notified when it initiates the network. AFNetworkingTaskDidResumeNotification and afnetworkingtaskdidcompletenenotification. Obtain the network information through the parameters carried by the monitoring notice.
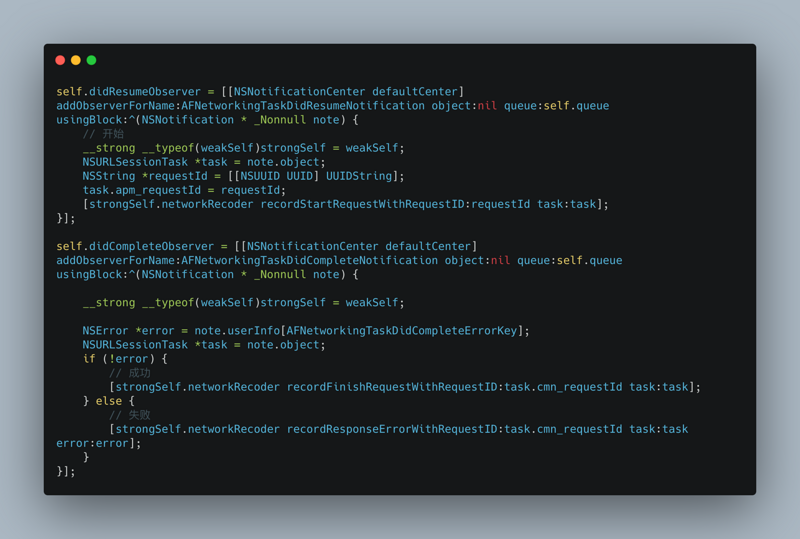
In the method of network recoder, assemble the data, hand it to the data reporting component, and wait for the right time to report.
Because the network is an asynchronous process, when the network request starts, it needs to set a unique identifier for each network. After the network request is completed, it can judge how long the network takes and whether it is successful according to the identifier of each request. Therefore, the measure is to add a classification for the asurlsessiontask, and add a property, i.e. unique identification, through runtime.
You need to pay attention to the name of Category, internal properties and methods. What if you don't pay attention? If you want to add the function of hiding the middle digit of ID card number for the NSString class, then the old driver a, who has written the code for a long time, has added a method name for NSString, which is called getMaskedIdCardNumber, but his requirement is to hide it from the four character strings of [9, 12]. A few days later, colleague B met a similar demand. He is also an old driver. He added a method called getMaskedIdCardNumber to NSString, but his demand was from [8, 11] These 4-bit strings are hidden, but after he introduced the project, he found that the output did not meet the expectation. The single test written for this method failed. He thought he wrote a wrong interception method. After several checks, he found that another NSString classification was introduced into the project, and the method in it has the same name 😂 Real pit.
The following example is SDK, but the same is true for daily development.
- Category class name: it is recommended to prefix with the abbreviation of the current SDK name, underline it, and add the function of the current classification, that is, class name + SDK name abbreviation_ Function name. For example, if the current SDK is called JuhuaSuanAPM, the name of the NSURLSessionTask Category is called NSURLSessionTask+JuHuaSuanAPM_NetworkMonitor.h
- Category property name: it is recommended to prefix with the abbreviation of the current SDK name, underline it, and add the property name, that is, the abbreviation of the SDK name_ Property name. For example, Juhua Suan APM_ requestId`
- Category method name: it is recommended to prefix the current SDK name with the abbreviation, then underline it, and then add the method name, that is, SDK name abbreviation_ Method name. For example - (BOOL)JuhuaSuanAPM__isGzippedData
Examples are as follows: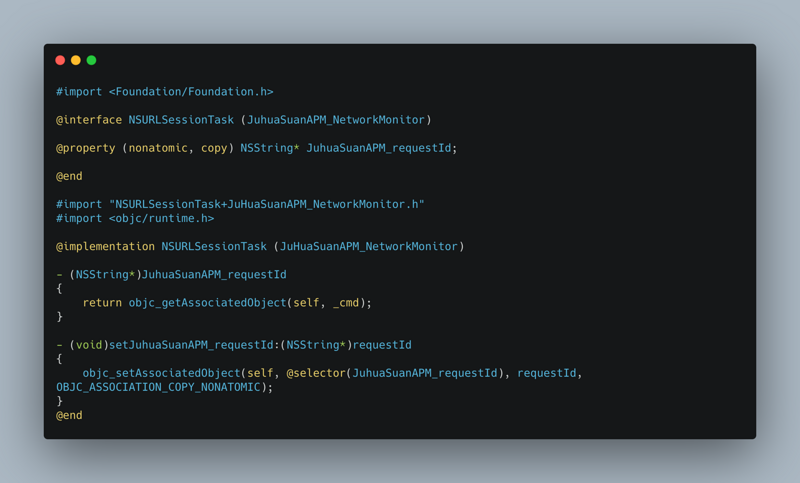
2.5 iOS traffic monitoring
2.5.1 HTTP request and response data structure
HTTP request message structure
Structure of response message
- HTTP message is a formatted data block, each message is composed of three parts: the starting line to describe the message, the first block containing attributes, and the optional main part containing data.
- Starting line and hand are ASCII text with line separator. Each line ends with a 2-character line termination sequence (including a carriage return and a line feed)
- The entity body or message body is an optional data block. Unlike the start line and the first part, the body can contain text or binary data, or it can be empty.
- HTTP Headers (that is, Headers) should always end with a blank line, even if there is no entity part. The browser sends a blank line to notify the server that it has finished sending the header.
Format of request message
<method> <request-URI> <version>
<headers>

<entity-body>
Format of response message
<version> <status> <reason-phrase>
<headers>

<entity-body>
The following figure is the request information of opening Chrome to view Jike time page. Including response line, response header, response body and other information.
The figure below shows a complete request and response data in the terminal by using curl
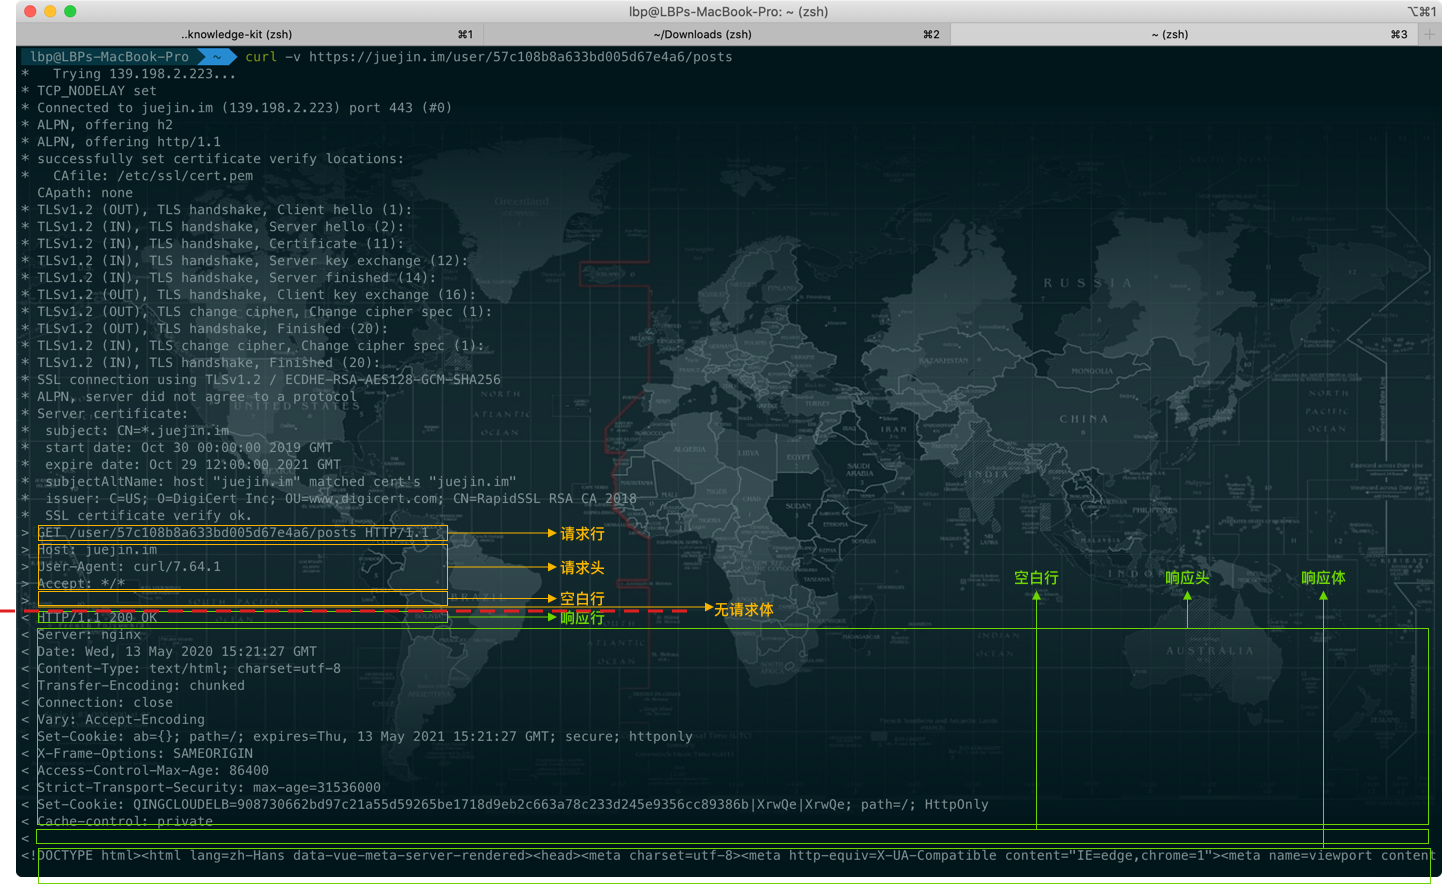
We all know that in HTTP communication, response data will be compressed by gzip or other compression methods, monitored by NSURLProtocol and other schemes, and analyzed by NSData type, which will cause data inaccuracy. Because the content of a normal HTTP response body is compressed by gzip or other compression methods, NSData will be larger.
2.5.2 questions
- Request and Response do not necessarily exist in pairs
For example, when the network is disconnected and the App suddenly crashes, the Request and Response should not be recorded in one record after monitoring
-
Request traffic calculation method is not accurate
The main reasons are as follows:
- The monitoring technical scheme ignores the data size of the request header and the request line part
- The data size of the Cookie part is ignored in the monitoring technical scheme
- The monitoring technical scheme is directly used in the calculation of request body size HTTPBody.length , resulting in imprecision
-
Inaccurate calculation of response flow
The main reasons are as follows:
- The monitoring technical scheme ignores the data size of response header and response line
- In the calculation of the byte size of the body part of the monitoring technical scheme, the exceptedContentLength is adopted, which leads to inaccuracy
- The monitoring technical solution ignores the gzip compression of the response body. In the real network communication process, the client accepts encoding in the request header of the request The field represents the data compression method supported by the client (indicating that the client can normally use the compression method supported by the data). Similarly, the server processes the data according to the compression method desired by the client and the compression method currently supported by the server. In the response header, the content encoding field represents the compression method adopted by the current server.
2.5.3 technical realization
In the fifth part, we talk about various principles and technical solutions of network interception. Here we take NSURLProtocol to realize the flow monitoring (Hook mode). From the above, we can know what we need, so let's gradually realize it.
2.5.3.1 request
- First, use the network monitoring scheme to manage the various network requests of the App
- Record the required parameters in each method (NSURLProtocol cannot analyze data size and time consumption such as request handshake and wave, but it is enough for normal interface traffic analysis, and Socket layer is needed at the bottom)
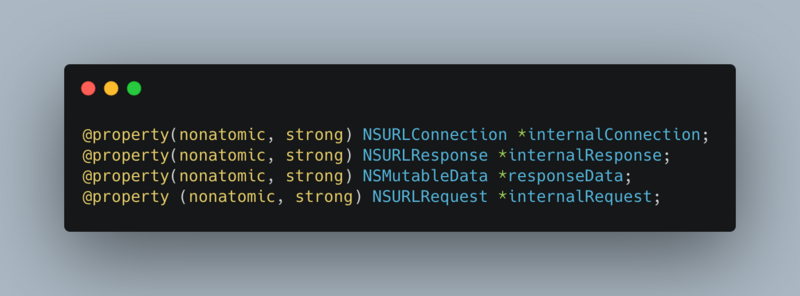
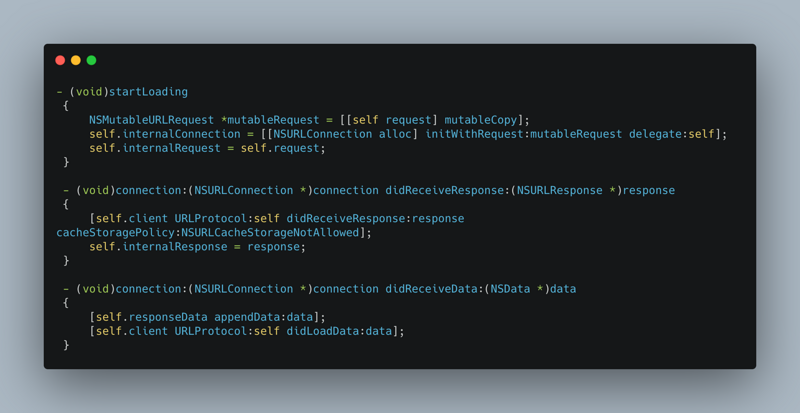
- Status Line section
There is no attribute or interface such as Status Line or HTTP Version information in NSURLResponse, so if you want to get Status Line, try to convert it to CFNetwork layer. It is found that a private API can be implemented.
Idea: pass NSURLResponse_ CFURLResponse is converted to CFTypeRef, then CFTypeRef is converted to CFHTTPMessageRef, and the Status Line information of CFHTTPMessageRef is obtained through CFHTTPMessageCopyResponseStatusLine.
Add a classification of NSURLResponse to the function of reading Status Line.
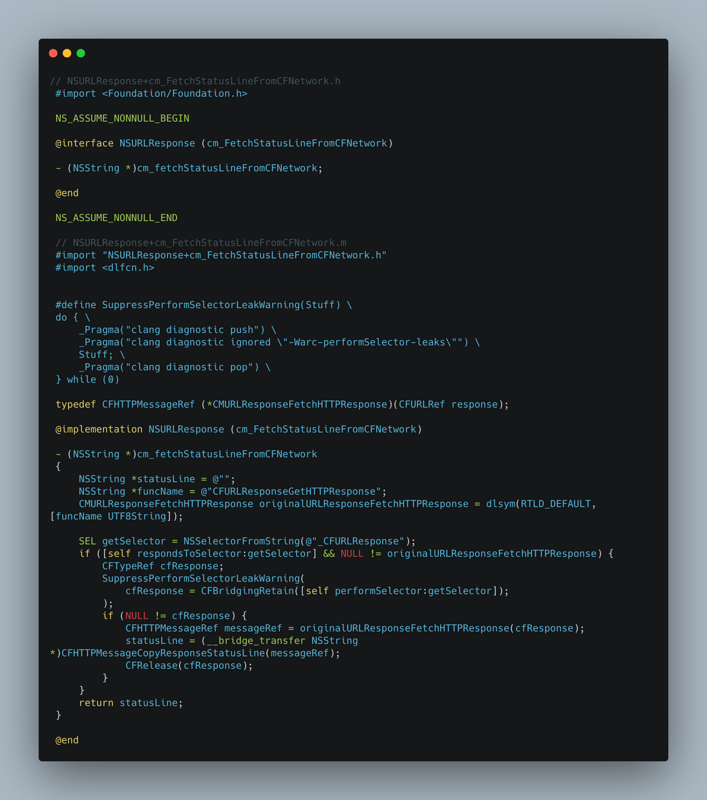
- Convert the obtained Status Line to NSData, and then calculate the size
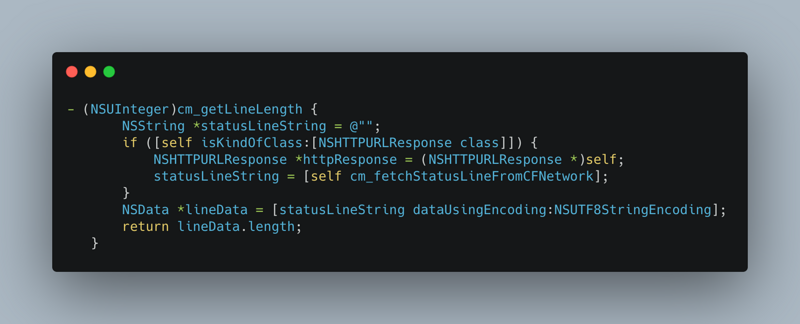
- Header section
allHeaderFields gets the NSDictionary, splices it into a string according to key: value, and converts it into NSData to calculate the size
Note: there is a space after the key: value key. The curl or chrome Network panel can be viewed and verified.

Body part
The calculation of the Body size cannot directly use the exceptedcontentlength. The official documents indicate that it is not accurate and can only be used as a reference. Or the content length value in allHeaderFields is not accurate enough.
/*!
@abstract Returns the expected content length of the receiver.
@discussion Some protocol implementations report a content length
as part of delivering load metadata, but not all protocols
guarantee the amount of data that will be delivered in actuality.
Hence, this method returns an expected amount. Clients should use
this value as an advisory, and should be prepared to deal with
either more or less data.
@result The expected content length of the receiver, or -1 if
there is no expectation that can be arrived at regarding expected
content length.
*/
@property (readonly) long long expectedContentLength;
- According to HTTP version 1.1, if there is transfer encoding: chunked, there cannot be content length in the header, and some will be ignored.
- In HTTP 1.0 and earlier, the content length field is optional
- HTTP 1.1 and later. If it is keep alive, then content length and chunked must be one of the two choices. If it is not keep alive, it is the same as HTTP 1.0. Content length is optional.
What is transfer encoding: chunked
Data is sent in the form of a series of blocks. In this case, the content length header is not sent. At the beginning of each block, you need to add the length of the current block, which is expressed in hexadecimal form, followed by the block itself, followed by the block itself, and the termination block is a regular block, the difference is that its length is 0
We recorded the data with NSMutableData before, so we can calculate the Body size in the stopLoading method. The steps are as follows:
- Add data continuously in didReceiveData
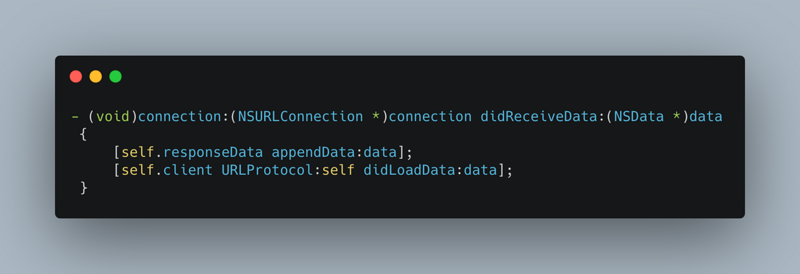
- Get the allHeaderFields dictionary in stopLoading method, and get the value of content encoding key. If it is gzip, process NSData as gzip compressed data in stopLoading, and then calculate the size. (gzip related functions can use this tool)
The length of a blank row needs to be calculated additionally
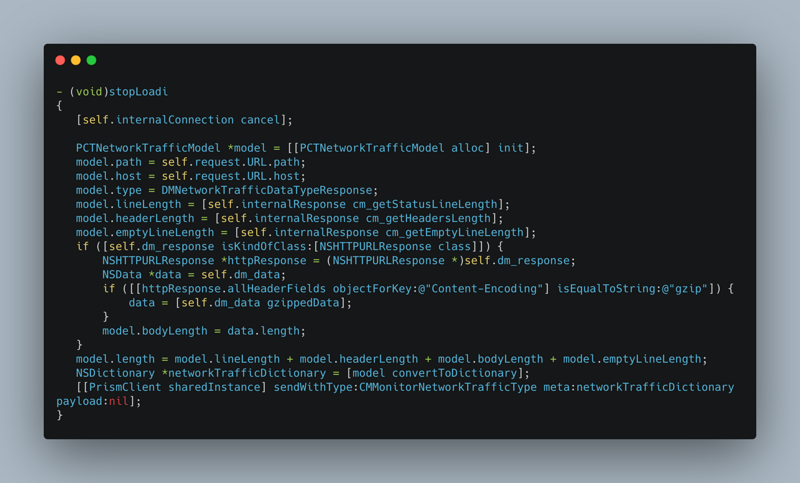
2.5.3.2 request
- First, use the network monitoring scheme to manage the various network requests of the App
- Record the required parameters in each method (NSURLProtocol cannot analyze data size and time consumption such as request handshake and wave, but it is enough for normal interface traffic analysis, and Socket layer is needed at the bottom)
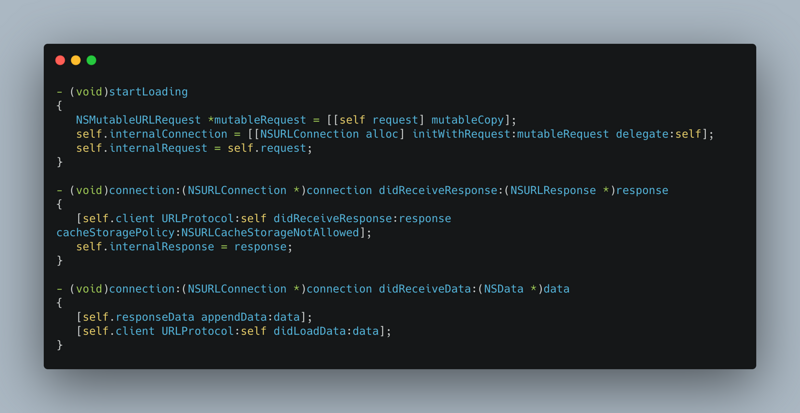
- Status Line section
There is no way to find StatusLine for NSURLRequest like NSURLResponse. Therefore, the scheme is to construct one manually according to the Status Line structure. Structure: protocol version number + space + status code + space + status text + line feed
Add a special category for NSURLRequest to get Status Line.
- Header section
An HTTP request will first build a cache to determine whether there is a cache, and then perform DNS domain name resolution to obtain the IP address of the server requesting the domain name. If the request protocol is HTTPS, a TLS connection is also required. The next step is to use the IP address to establish a TCP connection with the server. After the connection is established, the browser will build the request line, request header and other information, and attach the Cookie and other data related to the domain name to the request header, and then send the built request information to the server.
So a network monitor doesn't consider cookie s 😂 In the words of Wang Duoyu, "is there no end to calves?".
Read some articles that NSURLRequest can't get the request header information completely. In fact, the problem is not big, and there is no way to obtain a few information. Measuring the monitoring scheme itself is to see whether the data consumption of the interface is abnormal in different versions or in some cases, and whether the WebView resource request is too large, similar to the idea of control variable method.
So after getting the allHeaderFields of NSURLRequest, add the cookie information to calculate the full Header size
- Body part
The HTTP body of NSURLConnection may not be available. The problem is similar to ajax on WebView. So you can read the stream through HTTP bodystream to calculate the body size
- In the - (NSURLRequest *)connection:(NSURLConnection *)connection willSendRequest:(NSURLRequest *)request redirectResponse:(NSURLResponse *)response method, the data will be reported in the Build a powerful, flexible and configurable data reporting component speak
6, Electricity consumption
The power consumption of mobile devices has always been a sensitive issue. If users find that the power consumption is serious and the phone is hot when using an App, they are likely to uninstall the App immediately. So we need to pay attention to the power consumption in the development stage.
Generally speaking, when we encounter a large power consumption, we immediately think about whether we use positioning, frequent network requests, and do something repeatedly?
There are basically no problems in the development stage. We can combine the Energy Log tool in instruments to locate the problems. But online problems require code to monitor power consumption, which can be used as one of the capabilities of APM.
1. How to obtain electricity
In iOS, IOKit is a private framework, which is used to obtain the detailed information of hardware and devices, and is also the underlying framework of communication between hardware and kernel services. So we can get the hardware information through IOKit, so as to get the power information. The steps are as follows:
- First, find it in Apple open source IOPowerSources.h,IOPSKeys.h . Found in the Package Contents of Xcode IOKit.framework . The path is / Applications/Xcode.app/Contents/Developer/Platforms/iPhoneOS.platform/Developer/SDKs/iPhoneOS.sdk/System/Library/Frameworks/IOKit.framework
- Then iopowerresources. H, IOPSKeys.h IOKit.framework Import project project
- Set the batteryMonitoringEnabled of UIDevice to true
- Power consumption accuracy obtained is 1%
2. Positioning
Usually, we solve many problems through the Energy Log in instruments. After the App is online, we need to use APM to solve the online power consumption. The power consumption place may be a two-way library, a three-way library, or the code of a colleague.
The idea is: after detecting the power consumption, first find the thread in question, and then stack dump to restore the scene of the crime.
In the above part, we know the structure of thread information, thread_basic_info has a field CPU that records the percentage of CPU used_ usage. So we can traverse the current thread to determine which thread has a higher CPU utilization, and then find out the thread in question. Then dump the stack to locate the code where the power consumption occurred. For details, please see 3.2 part.
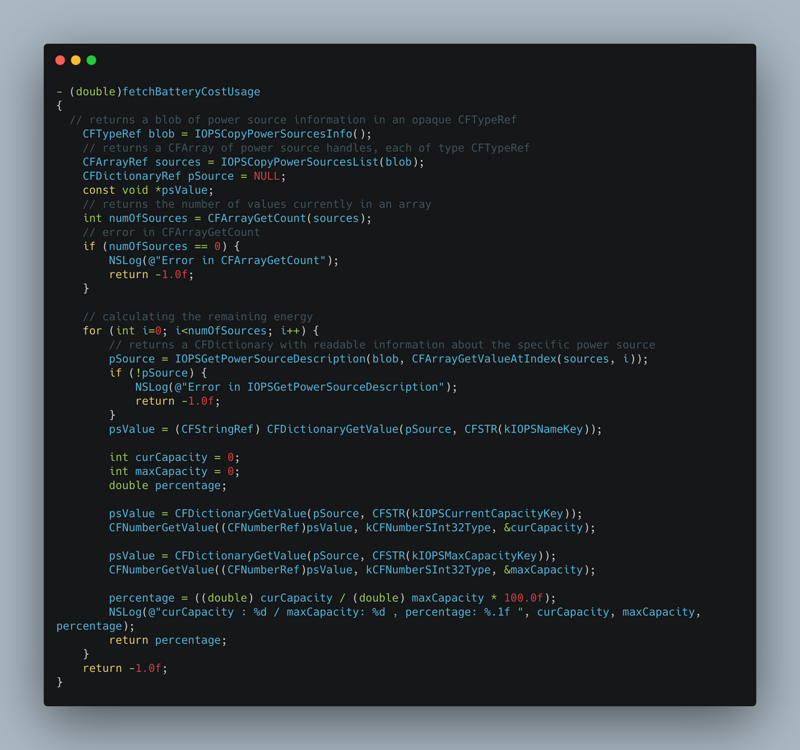
3. What can we do for power consumption in the development stage
CPU intensive operation is the main reason of power consumption. So we need to use CPU carefully. Try not to let the CPU do idle work. For the complex operation of a large number of data, the ability of the server and GPU can be used. If the scheme design must complete the data operation on the CPU, you can use GCD technology and dispatch_ block_ create_ with_ qos_ class(<#dispatch_ block_ flags_ t flags#>, dispatch_ qos_ class_ t qos_ class, <#int relative_ Priority × >, < void) block × >) () and specify QoS of queue as QOS_CLASS_UTILITY. Submit the task to the block of this queue. In QoS_ CLASS_ In utility mode, the system optimizes the power consumption for the calculation of a large number of data
In addition to a large number of CPU operations, I/O operation is also the main reason for power consumption. The common solution in the industry is to postpone the operation of "write fragmented data to disk storage" and aggregate it in memory before disk storage. Fragmentation data is aggregated first and stored in memory. iOS provides NSCache as an object.
NSCache is thread safe. NSCache cleans up the cache when it reaches the preset cache space. At this time - (* * void**)cache:(NSCache *)cache willEvictObject:(**id**)obj is triggered. Method callback is used to perform I/O operations on the data inside the method, so as to delay the aggregated data I/O. The less I/O times, the less power consumption.
NSCache can be used to view the SDWebImage image image loading framework. In the process of image read cache processing, the hard disk file (I/O) is not read directly, but the NSCache of the system is used.
You can see that the main logic is to read the pictures from the disk first. If the configuration allows memory caching to be turned on, the pictures will be saved to NSCache, and the pictures will also be read from NSCache when used. The totalCostLimit and countLimit properties of NSCache,
-(void)setObject:(ObjectType)obj forKey:(KeyType)key cost:(NSUInteger)g; method is used to set the cache condition. So we can use this strategy for reference when we write files of disk and memory to optimize power consumption.
7, Crash monitoring
1. Review of abnormality related knowledge
1.1 handling of exceptions in Mach layer
Mach implements a unique exception handling method based on message passing. Mach exception handling is designed with:
- A single exception handling facility with consistent semantics: Mach provides only one exception handling mechanism for handling all types of exceptions (including user-defined, platform independent, and platform specific). Group according to exception types. Specific platforms can define specific subtypes.
- Clear and concise: the exception handling interface relies on Mach's well-defined message and port architecture, so it is very elegant (does not affect efficiency). This allows the development of debuggers and external handlers - and even, in theory, network-based exception handling.
In Mach, exceptions are handled through the infrastructure messaging mechanism in the kernel. An exception is not much more complex than a message. The exception is caused by the wrong thread or task (through msg_send()) is thrown and then passed by a handler through msg_recv()) capture. The handler can handle the exception, be aware of the exception (mark the exception completed and continue), and decide to terminate the thread.
The exception handling model of mach is different from other exception handling models. The exception handlers of other models run in the context of an error thread, while the exception handlers of Mach run in different contexts. The error thread sends messages to a pre specified exception port and waits for an answer. Each task can register an exception handling port, which will take effect for all threads in the task. In addition, each thread can pass the thread_ set_ exception_ ports(<#thread_ act_ t thread#>, <#exception_ mask_ t exception_ mask#>, <#mach_ port_ t new_ port#>, <#exception_ behavior_ t behavior#>, <#thread_ state_ flavor_ t new_ Register your own exception handling port. In general, the exception ports of tasks and threads are NULL, that is, exceptions will not be handled. Once an exception port is created, these ports, like other ports in the system, can be transferred to other tasks or other hosts. (with a port, you can use UDP protocol to let applications on other hosts handle exceptions through network capabilities.).
When an exception occurs, first try to throw the exception to the exception port of the thread, then try to throw it to the exception port of the task, and finally throw it to the exception port of the host (that is, the default port registered by the host). If no port returns KERN_SUCCESS, then the whole task will be terminated. That is, Mach does not provide exception handling logic, but only provides a framework for passing exception notifications.
The exception is first thrown by a processor trap. In order to deal with traps, every modern kernel will install trap handlers. These underlying functions are inserted by the assembly part of the kernel.
1.2 BSD layer handling of exceptions
BSD layer is the main XUN interface used in user mode, which shows an interface conforming to POSIX standard. Developers can use all the functions of UNIX system, but they don't need to know the details of Mach layer.
Mach has provided the underlying sink processing through the exception mechanism, while BSD has built the signal processing mechanism on top of the exception mechanism. The signals generated by the hardware are captured by the Mach layer, and then converted to the corresponding UNIX signals. In order to maintain a unified mechanism, the signals generated by the operating system and users are first converted to Mach exceptions, and then converted to signals.
Mach exceptions are all uxed in the host layer_ The exception is converted to the corresponding unix signal, and the signal is delivered to the wrong thread through threadsignal.
2. Crash collection method
The Apples`s Crash Reporter of iOS system records crash logs in the settings. Let's observe the crash logs first
Incident Identifier: 7FA6736D-09E8-47A1-95EC-76C4522BDE1A
CrashReporter Key:   4e2d36419259f14413c3229e8b7235bcc74847f3
Hardware Model:      iPhone7,1
Process:         CMMonitorExample [3608]
Path:            /var/containers/Bundle/Application/9518A4F4-59B7-44E9-BDDA-9FBEE8CA18E5/CMMonitorExample.app/CMMonitorExample
Identifier:      com.Wacai.CMMonitorExample
Version:         1.0 (1)
Code Type:       ARM-64
Parent Process:  ? [1]

Date/Time:       2017-01-03 11:43:03.000 +0800
OS Version:      iOS 10.2 (14C92)
Report Version:  104

Exception Type:  EXC_CRASH (SIGABRT)
Exception Codes: 0x00000000 at 0x0000000000000000
Crashed Thread:  0

Application Specific Information:
*** Terminating app due to uncaught exception 'NSInvalidArgumentException', reason: '-[__NSSingleObjectArrayI objectForKey:]: unrecognized selector sent to instance 0x174015060'

Thread 0 Crashed:
0   CoreFoundation                  0x0000000188f291b8 0x188df9000 + 1245624 (<redacted> + 124)
1   libobjc.A.dylib                 0x000000018796055c 0x187958000 + 34140 (objc_exception_throw + 56)
2   CoreFoundation                  0x0000000188f30268 0x188df9000 + 1274472 (<redacted> + 140)
3   CoreFoundation                  0x0000000188f2d270 0x188df9000 + 1262192 (<redacted> + 916)
4   CoreFoundation                  0x0000000188e2680c 0x188df9000 + 186380 (_CF_forwarding_prep_0 + 92)
5   CMMonitorExample                0x000000010004c618 0x100044000 + 34328 (-[MakeCrashHandler throwUncaughtNSException] + 80)
It will be found that the Exception Type entry in the Crash log consists of two parts: Mach exception + Unix signal.
So exception type: EXC_CRASH (SIGABRT) indicates that exc occurs in Mach layer_ Crash exception, converted to SIGABRT signal in the host layer and delivered to the wrong thread.
Question: catch Mach layer exceptions and register Unix signal processing to catch Crash. How to choose between these two ways?
A: the Mach layer is preferred to intercept abnormally. According to the description in 1.2 above, we know that the opportunity of exception handling in Mach layer is earlier. If the exception handler in Mach layer lets the process exit, the Unix signal will never occur.
There are many open-source projects about the collection of crash logs in the industry, including KSCrash and plcrashreporter, Bugly and Youmeng, which provide one-stop services. We usually use open source projects to develop bug collection tools that meet the internal needs of the company. After a comparison, choose KSCrash. Why KSCrash is not the focus of this article.
KSCrash has complete functions and can capture the following types of Crash
- Mach kernel exceptions
- Fatal signals
- C++ exceptions
- Objective-C exceptions
- Main thread deadlock (experimental)
- Custom crashes (e.g. from scripting languages)
So analyzing the Crash collection scheme of iOS is to analyze the implementation principle of the Crash monitoring of KSCrash.
2.1. Mach layer exception handling
The general idea is: first, create an exception handling port, apply for permission for the port, then set the exception port, create a new kernel thread, and wait for exceptions in the thread. However, in order to prevent the Mach layer exception handling registered by ourselves from preempting the logic set by other SDK s or business line developers, we need to save other exception handling ports at the beginning, and hand the exception handling to the logic processing in other ports after the logic execution. After collecting the Crash information, assemble the data and write it to the json file.
The flow chart is as follows:
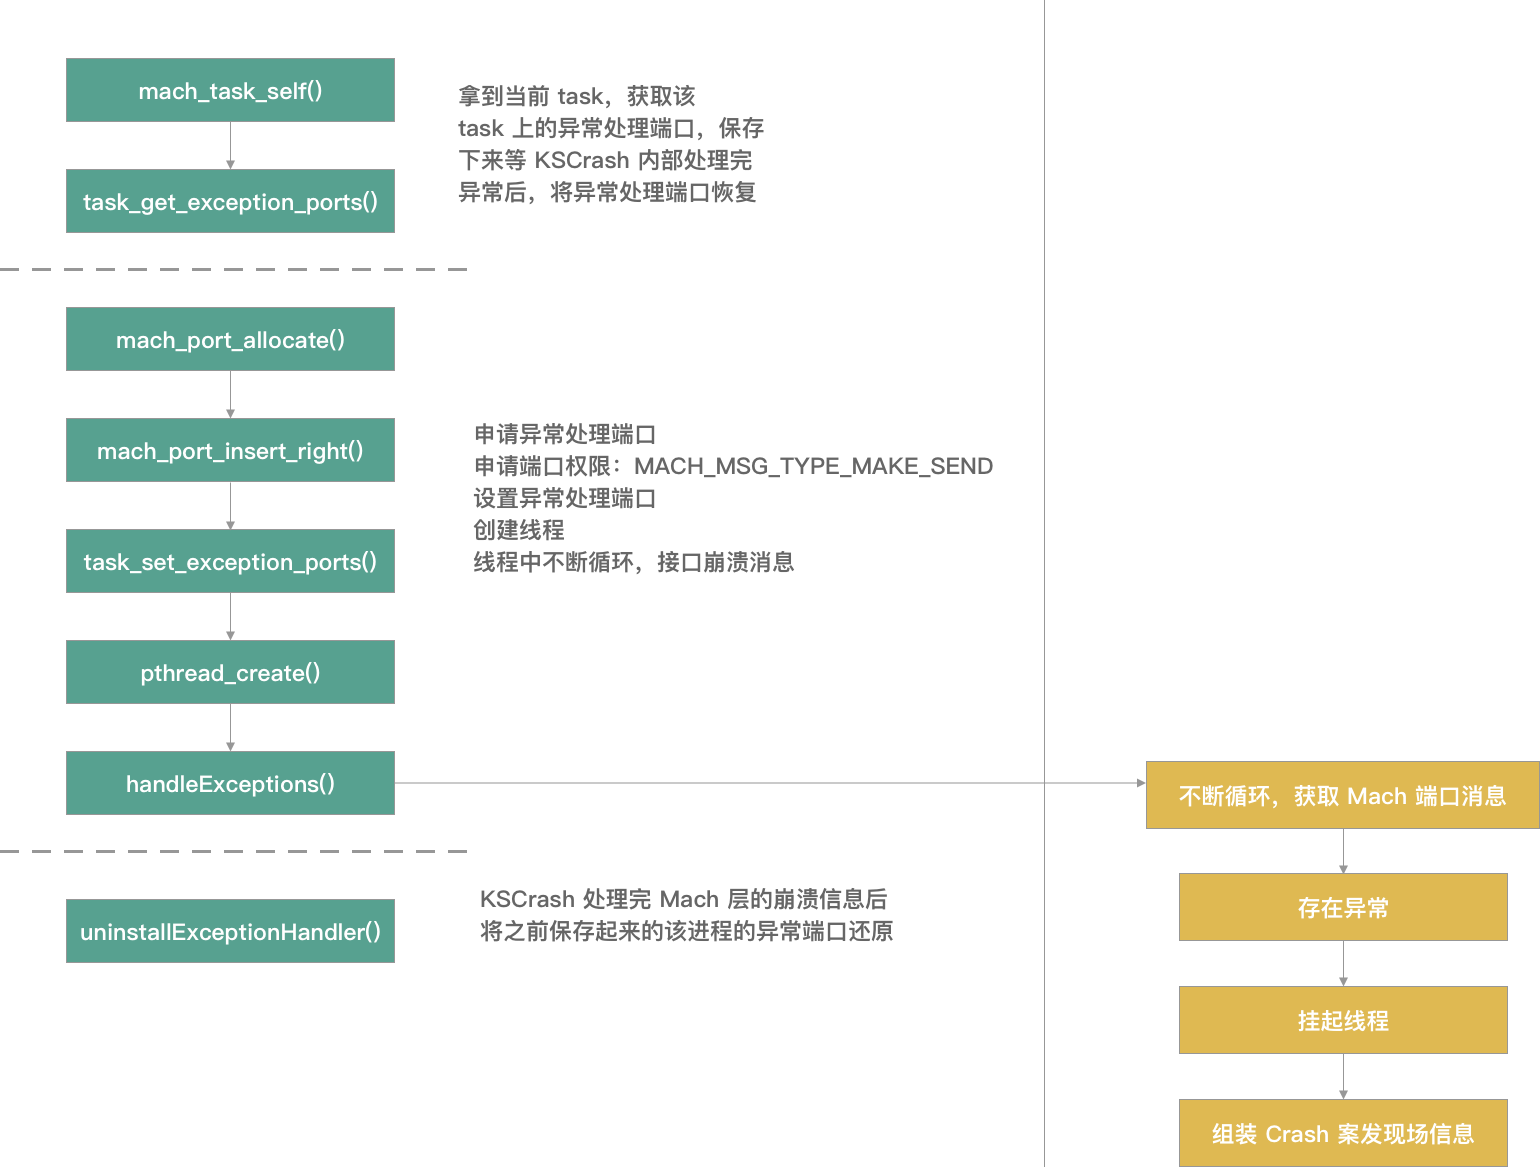
For Mach exception capture, you can register an exception port, which is responsible for listening to all threads of the current task.
Here's the key code:
Register Mach layer exception listening code
static bool installExceptionHandler()
{
    KSLOG_DEBUG("Installing mach exception handler.");

    bool attributes_created = false;
    pthread_attr_t attr;

    kern_return_t kr;
    int error;
    // Get the current process
    const task_t thisTask = mach_task_self();
    exception_mask_t mask = EXC_MASK_BAD_ACCESS |
    EXC_MASK_BAD_INSTRUCTION |
    EXC_MASK_ARITHMETIC |
    EXC_MASK_SOFTWARE |
    EXC_MASK_BREAKPOINT;

    KSLOG_DEBUG("Backing up original exception ports.");
    // Get the registered exception port on the Task
    kr = task_get_exception_ports(thisTask,
                                  mask,
                                  g_previousExceptionPorts.masks,
                                  &g_previousExceptionPorts.count,
                                  g_previousExceptionPorts.ports,
                                  g_previousExceptionPorts.behaviors,
                                  g_previousExceptionPorts.flavors);
    // Get failed go to failed logic
    if(kr != KERN_SUCCESS)
    {
        KSLOG_ERROR("task_get_exception_ports: %s", mach_error_string(kr));
        goto failed;
    }
    // If the exception of KSCrash is empty, execute the logic
    if(g_exceptionPort == MACH_PORT_NULL)
    {
        KSLOG_DEBUG("Allocating new port with receive rights.");
        // Application exception handling port
        kr = mach_port_allocate(thisTask,
                                MACH_PORT_RIGHT_RECEIVE,
                                &g_exceptionPort);
        if(kr != KERN_SUCCESS)
        {
            KSLOG_ERROR("mach_port_allocate: %s", mach_error_string(kr));
            goto failed;
        }

        KSLOG_DEBUG("Adding send rights to port.");
        // Request permission for exception handling port: MACH_MSG_TYPE_MAKE_SEND
        kr = mach_port_insert_right(thisTask,
                                    g_exceptionPort,
                                    g_exceptionPort,
                                    MACH_MSG_TYPE_MAKE_SEND);
        if(kr != KERN_SUCCESS)
        {
            KSLOG_ERROR("mach_port_insert_right: %s", mach_error_string(kr));
            goto failed;
        }
    }

    KSLOG_DEBUG("Installing port as exception handler.");
    // Set exception handling port for the Task
    kr = task_set_exception_ports(thisTask,
                                  mask,
                                  g_exceptionPort,
                                  EXCEPTION_DEFAULT,
                                  THREAD_STATE_NONE);
    if(kr != KERN_SUCCESS)
    {
        KSLOG_ERROR("task_set_exception_ports: %s", mach_error_string(kr));
        goto failed;
    }

    KSLOG_DEBUG("Creating secondary exception thread (suspended).");
    pthread_attr_init(&attr);
    attributes_created = true;
    pthread_attr_setdetachstate(&attr, PTHREAD_CREATE_DETACHED);
    // Set monitoring thread
    error = pthread_create(&g_secondaryPThread,
                           &attr,
                           &handleExceptions,
                           kThreadSecondary);
    if(error != 0)
    {
        KSLOG_ERROR("pthread_create_suspended_np: %s", strerror(error));
        goto failed;
    }
    // Convert to Mach kernel thread
    g_secondaryMachThread = pthread_mach_thread_np(g_secondaryPThread);
    ksmc_addReservedThread(g_secondaryMachThread);

    KSLOG_DEBUG("Creating primary exception thread.");
    error = pthread_create(&g_primaryPThread,
                           &attr,
                           &handleExceptions,
                           kThreadPrimary);
    if(error != 0)
    {
        KSLOG_ERROR("pthread_create: %s", strerror(error));
        goto failed;
    }
    pthread_attr_destroy(&attr);
    g_primaryMachThread = pthread_mach_thread_np(g_primaryPThread);
    ksmc_addReservedThread(g_primaryMachThread);

    KSLOG_DEBUG("Mach exception handler installed.");
    return true;


failed:
    KSLOG_DEBUG("Failed to install mach exception handler.");
    if(attributes_created)
    {
        pthread_attr_destroy(&attr);
    }
    // Restore the abnormal registration port before restoring, and restore the control right
    uninstallExceptionHandler();
    return false;
}
Handling abnormal logic, assembling crash information
/** Our exception handler thread routine.
 * Wait for an exception message, uninstall our exception port, record the
 * exception information, and write a report.
 */
static void* handleExceptions(void* const userData)
{
    MachExceptionMessage exceptionMessage = {{0}};
    MachReplyMessage replyMessage = {{0}};
    char* eventID = g_primaryEventID;

    const char* threadName = (const char*) userData;
    pthread_setname_np(threadName);
    if(threadName == kThreadSecondary)
    {
        KSLOG_DEBUG("This is the secondary thread. Suspending.");
        thread_suspend((thread_t)ksthread_self());
        eventID = g_secondaryEventID;
    }
    // Circular reading of registered abnormal port information
    for(;;)
    {
        KSLOG_DEBUG("Waiting for mach exception");

        // Wait for a message.
        kern_return_t kr = mach_msg(&exceptionMessage.header,
                                    MACH_RCV_MSG,
                                    0,
                                    sizeof(exceptionMessage),
                                    g_exceptionPort,
                                    MACH_MSG_TIMEOUT_NONE,
                                    MACH_PORT_NULL);
        // After getting the information, it means that the Mach layer exception occurs, jump out of the for loop, and assemble the data
        if(kr == KERN_SUCCESS)
        {
            break;
        }

        // Loop and try again on failure.
        KSLOG_ERROR("mach_msg: %s", mach_error_string(kr));
    }

    KSLOG_DEBUG("Trapped mach exception code 0x%x, subcode 0x%x",
                exceptionMessage.code[0], exceptionMessage.code[1]);
    if(g_isEnabled)
    {
        // Suspend all threads
        ksmc_suspendEnvironment();
        g_isHandlingCrash = true;
        // Exception in notification
        kscm_notifyFatalExceptionCaptured(true);

        KSLOG_DEBUG("Exception handler is installed. Continuing exception handling.");


        // Switch to the secondary thread if necessary, or uninstall the handler
        // to avoid a death loop.
        if(ksthread_self() == g_primaryMachThread)
        {
            KSLOG_DEBUG("This is the primary exception thread. Activating secondary thread.");
// TODO: This was put here to avoid a freeze. Does secondary thread ever fire?
            restoreExceptionPorts();
            if(thread_resume(g_secondaryMachThread) != KERN_SUCCESS)
            {
                KSLOG_DEBUG("Could not activate secondary thread. Restoring original exception ports.");
            }
        }
        else
        {
            KSLOG_DEBUG("This is the secondary exception thread. Restoring original exception ports.");
//            restoreExceptionPorts();
        }

        // Fill out crash information
        // Plan site information required for abnormal assembly
        KSLOG_DEBUG("Fetching machine state.");
        KSMC_NEW_CONTEXT(machineContext);
        KSCrash_MonitorContext* crashContext = &g_monitorContext;
        crashContext->offendingMachineContext = machineContext;
        kssc_initCursor(&g_stackCursor, NULL, NULL);
        if(ksmc_getContextForThread(exceptionMessage.thread.name, machineContext, true))
        {
            kssc_initWithMachineContext(&g_stackCursor, 100, machineContext);
            KSLOG_TRACE("Fault address 0x%x, instruction address 0x%x", kscpu_faultAddress(machineContext), kscpu_instructionAddress(machineContext));
            if(exceptionMessage.exception == EXC_BAD_ACCESS)
            {
                crashContext->faultAddress = kscpu_faultAddress(machineContext);
            }
            else
            {
                crashContext->faultAddress = kscpu_instructionAddress(machineContext);
            }
        }

        KSLOG_DEBUG("Filling out context.");
        crashContext->crashType = KSCrashMonitorTypeMachException;
        crashContext->eventID = eventID;
        crashContext->registersAreValid = true;
        crashContext->mach.type = exceptionMessage.exception;
        crashContext->mach.code = exceptionMessage.code[0];
        crashContext->mach.subcode = exceptionMessage.code[1];
        if(crashContext->mach.code == KERN_PROTECTION_FAILURE && crashContext->isStackOverflow)
        {
            // A stack overflow should return KERN_INVALID_ADDRESS, but
            // when a stack blasts through the guard pages at the top of the stack,
            // it generates KERN_PROTECTION_FAILURE. Correct for this.
            crashContext->mach.code = KERN_INVALID_ADDRESS;
        }
        crashContext->signal.signum = signalForMachException(crashContext->mach.type, crashContext->mach.code);
        crashContext->stackCursor = &g_stackCursor;

        kscm_handleException(crashContext);

        KSLOG_DEBUG("Crash handling complete. Restoring original handlers.");
        g_isHandlingCrash = false;
        ksmc_resumeEnvironment();
    }

    KSLOG_DEBUG("Replying to mach exception message.");
    // Send a reply saying "I didn't handle this exception".
    replyMessage.header = exceptionMessage.header;
    replyMessage.NDR = exceptionMessage.NDR;
    replyMessage.returnCode = KERN_FAILURE;

    mach_msg(&replyMessage.header,
             MACH_SEND_MSG,
             sizeof(replyMessage),
             0,
             MACH_PORT_NULL,
             MACH_MSG_TIMEOUT_NONE,
             MACH_PORT_NULL);

    return NULL;
}
Restore exception handling port, transfer control
/** Restore the original mach exception ports.
 */
static void restoreExceptionPorts(void)
{
    KSLOG_DEBUG("Restoring original exception ports.");
    if(g_previousExceptionPorts.count == 0)
    {
        KSLOG_DEBUG("Original exception ports were already restored.");
        return;
    }

    const task_t thisTask = mach_task_self();
    kern_return_t kr;

    // Reinstall old exception ports.
    // for loop removes the saved abnormal ports registered before KSCrash, and registers each port back
    for(mach_msg_type_number_t i = 0; i < g_previousExceptionPorts.count; i++)
    {
        KSLOG_TRACE("Restoring port index %d", i);
        kr = task_set_exception_ports(thisTask,
                                      g_previousExceptionPorts.masks[i],
                                      g_previousExceptionPorts.ports[i],
                                      g_previousExceptionPorts.behaviors[i],
                                      g_previousExceptionPorts.flavors[i]);
        if(kr != KERN_SUCCESS)
        {
            KSLOG_ERROR("task_set_exception_ports: %s",
                        mach_error_string(kr));
        }
    }
    KSLOG_DEBUG("Exception ports restored.");
    g_previousExceptionPorts.count = 0;
}
2.2. Signal exception handling
For Mach exceptions, the operating system will convert them to corresponding Unix signals, so developers can deal with them by registering signhandler.
The processing logic of KSCrash here is as follows:
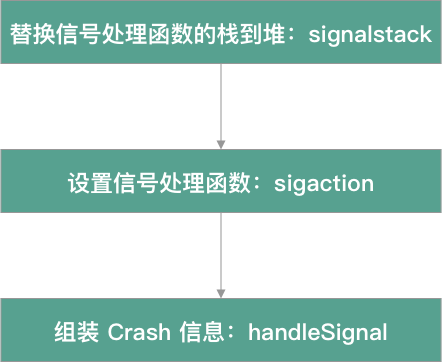
Take a look at the key code:
Set signal processing function
static bool installSignalHandler()
{
    KSLOG_DEBUG("Installing signal handler.");

#if KSCRASH_HAS_SIGNAL_STACK
    // Allocate a block of memory on the heap,
    if(g_signalStack.ss_size == 0)
    {
        KSLOG_DEBUG("Allocating signal stack area.");
        g_signalStack.ss_size = SIGSTKSZ;
        g_signalStack.ss_sp = malloc(g_signalStack.ss_size);
    }
    // The stack of the signal processing function is moved to the heap without sharing a stack area with the process
    // sigaltstack() function, the first parameter of which sigstack is a stack_ Pointer of T structure, which stores the location and attribute information of a "replaceable signal stack". Second parameter old_sigstack is also a stack_ Pointer of type T, which is used to return the information of the last "replaceable signal stack" (if any)
    KSLOG_DEBUG("Setting signal stack area.");
    // The first parameter of signalstack is the new replaceable signal stack created. The second parameter can be set to NULL. If it is not NULL, the information of the old replaceable signal stack will be saved in it. The function returns 0 for success and - 1 for failure
    if(sigaltstack(&g_signalStack, NULL) != 0)
    {
        KSLOG_ERROR("signalstack: %s", strerror(errno));
        goto failed;
    }
#endif

    const int* fatalSignals = kssignal_fatalSignals();
    int fatalSignalsCount = kssignal_numFatalSignals();

    if(g_previousSignalHandlers == NULL)
    {
        KSLOG_DEBUG("Allocating memory to store previous signal handlers.");
        g_previousSignalHandlers = malloc(sizeof(*g_previousSignalHandlers)
                                          * (unsigned)fatalSignalsCount);
    }

    // Set the second parameter of signal processing function sigaction, which is of type sigaction structure
    struct sigaction action = {{0}};
    // Sa_ Flag members set up SA_ONSTACK flag, which tells the kernel that the stack frame of the signal processing function is set up on the "replaceable signal stack".
    action.sa_flags = SA_SIGINFO | SA_ONSTACK;
#if KSCRASH_HOST_APPLE && defined(__LP64__)
    action.sa_flags |= SA_64REGSET;
#endif
    sigemptyset(&action.sa_mask);
    action.sa_sigaction = &handleSignal;

    // Traverse the array of signals to be processed
    for(int i = 0; i < fatalSignalsCount; i++)
    {
        // Bind the processing function of each signal to the action declared above, and use g_previousSignalHandlers save the processing function of the current signal
        KSLOG_DEBUG("Assigning handler for signal %d", fatalSignals[i]);
        if(sigaction(fatalSignals[i], &action, &g_previousSignalHandlers[i]) != 0)
        {
            char sigNameBuff[30];
            const char* sigName = kssignal_signalName(fatalSignals[i]);
            if(sigName == NULL)
            {
                snprintf(sigNameBuff, sizeof(sigNameBuff), "%d", fatalSignals[i]);
                sigName = sigNameBuff;
            }
            KSLOG_ERROR("sigaction (%s): %s", sigName, strerror(errno));
            // Try to reverse the damage
            for(i--;i >= 0; i--)
            {
                sigaction(fatalSignals[i], &g_previousSignalHandlers[i], NULL);
            }
            goto failed;
        }
    }
    KSLOG_DEBUG("Signal handlers installed.");
    return true;

failed:
    KSLOG_DEBUG("Failed to install signal handlers.");
    return false;
}
Record context information such as thread during signal processing
static void handleSignal(int sigNum, siginfo_t* signalInfo, void* userContext)
{
    KSLOG_DEBUG("Trapped signal %d", sigNum);
    if(g_isEnabled)
    {
        ksmc_suspendEnvironment();
        kscm_notifyFatalExceptionCaptured(false);

        KSLOG_DEBUG("Filling out context.");
        KSMC_NEW_CONTEXT(machineContext);
        ksmc_getContextForSignal(userContext, machineContext);
        kssc_initWithMachineContext(&g_stackCursor, 100, machineContext);
        // Record context information during signal processing
        KSCrash_MonitorContext* crashContext = &g_monitorContext;
        memset(crashContext, 0, sizeof(*crashContext));
        crashContext->crashType = KSCrashMonitorTypeSignal;
        crashContext->eventID = g_eventID;
        crashContext->offendingMachineContext = machineContext;
        crashContext->registersAreValid = true;
        crashContext->faultAddress = (uintptr_t)signalInfo->si_addr;
        crashContext->signal.userContext = userContext;
        crashContext->signal.signum = signalInfo->si_signo;
        crashContext->signal.sigcode = signalInfo->si_code;
        crashContext->stackCursor = &g_stackCursor;

        kscm_handleException(crashContext);
        ksmc_resumeEnvironment();
    }

    KSLOG_DEBUG("Re-raising signal for regular handlers to catch.");
    // This is technically not allowed, but it works in OSX and iOS.
    raise(sigNum);
}
Signal processing authority before restoring after KSCrash signal processing
static void uninstallSignalHandler(void)
{
    KSLOG_DEBUG("Uninstalling signal handlers.");

    const int* fatalSignals = kssignal_fatalSignals();
    int fatalSignalsCount = kssignal_numFatalSignals();
    // Traversal needs to process the signal array and restore the previous signal processing function
    for(int i = 0; i < fatalSignalsCount; i++)
    {
        KSLOG_DEBUG("Restoring original handler for signal %d", fatalSignals[i]);
        sigaction(fatalSignals[i], &g_previousSignalHandlers[i], NULL);
    }

    KSLOG_DEBUG("Signal handlers uninstalled.");
}
explain:
- First, a block of memory area is allocated from the heap, which is called "replaceable signal stack". The purpose is to wipe out the stack of signal processing functions and replace it with the memory area on the heap, instead of sharing a stack area with the process.
Why do you do this? A process may have n threads, and each thread has its own task. If a thread fails to execute, the whole process will crash. Therefore, in order to ensure the normal operation of signal processing function, it is necessary to set up a separate operation space for the signal processing function. The other is that the recursive function runs out of the default stack space, but the stack used by the signal processing function is the space allocated in the heap instead of the default stack, so it can still work normally.
-
int sigaltstack(const stack_t * __ restrict, stack_t * __ Both parameters of the restrict function are stack_ The pointer of T structure stores the information of the replaceable signal stack (the starting address, the length and the state of the stack). The first parameter: this structure stores the location and attribute information of a "replaceable signal stack". The second parameter is used to return the information of the last "replaceable signal stack" (if any).
_STRUCT_SIGALTSTACK
{
    void            *ss_sp;         /* signal stack base */
    __darwin_size_t ss_size;        /* signal stack length */
    int             ss_flags;       /* SA_DISABLE and/or SA_ONSTACK */
};
typedef _STRUCT_SIGALTSTACK     stack_t; /* [???] signal stack */
Newly created replaceable signal stack, ss_flags must be set to 0. SIGSTKSZ constant is defined in the system, which can meet the needs of most replaceable signal stacks.
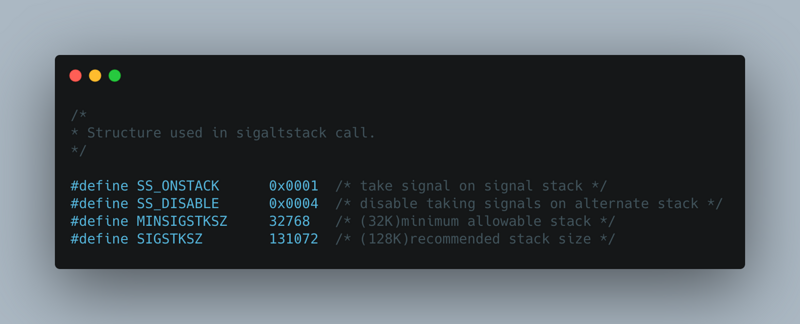
The sigaltstack system call informs the kernel that a "replaceable signal stack" has been established.
ss_flags is SS_ONSTACK indicates that the process is currently executing in the "replaceable signal stack". If you attempt to create a new "replaceable signal stack" at this time, you will encounter EPERM (prohibit the action) error; SS_DISABLE indicates that there is no "replaceable signal stack" established at present. It is forbidden to establish "replaceable signal stack".
-
int sigaction(int, const struct sigaction * __restrict, struct sigaction * __restrict);
The first function represents the signal value to be processed, but not SIGKILL and SIGSTOP. The processing functions of these two signals do not allow users to rewrite, because they provide super users with a method to terminate the program (SIGKILL and SIGSTOP cannot be caused, blocked, or ignored);
The second and third parameters are a sigaction structure. If the second parameter is not empty, it points to the signal processing function. If the third parameter is not empty, the previous signal processing function is saved to the pointer. If the second parameter is empty and the third parameter is not empty, the current signal processing function can be obtained.
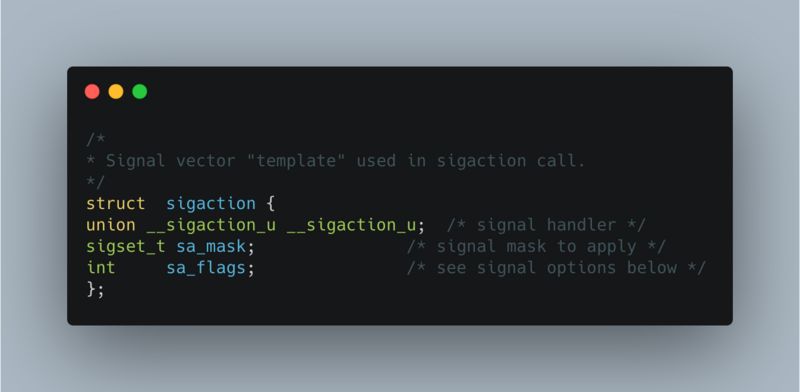
Sa of sigaction function_ The flag parameter requires SA to be set_ Onstack flag tells the kernel that the stack frame of the signal processing function is set up on the "replaceable signal stack".
2.3. C + + exception handling
The implementation of c + + exception handling relies on STD:: set of standard library_ Terminate (cppexeptionterminate) function.
The implementation of some functions in iOS project may use C, C + +, etc. If a C++ exception is thrown, if the exception can be converted to an NSException, the OC exception capture mechanism will be used. If the exception cannot be converted, the C++ exception process will continue, that is, the default_terminate_handler. The default terminate function of this C + + exception calls abort internally_ The message function finally triggers an abort call and the system generates a SIGABRT signal.
After the system throws a C + + exception, add a layer of try...catch... To determine whether the exception can be converted to an NSException, and then re throw the C + + exception. At this time, the exception field stack has disappeared, so the upper layer cannot restore the scene when the exception occurs by capturing the SIGABRT signal, that is, the exception stack is missing.
Why? The try...catch... Statement is called internally__ cxa_rethrow() throws an exception__ cxa_ Rewind() will call rewind inside, which can be simply understood as the reverse call of function call. It is mainly used to clean up the local variables generated by each function in the process of function call until the function where the outermost catch statement is located, and hand over the control to the catch statement, which is the reason why the stack of C + + exceptions disappears.
static void setEnabled(bool isEnabled)
{
    if(isEnabled != g_isEnabled)
    {
        g_isEnabled = isEnabled;
        if(isEnabled)
        {
            initialize();

            ksid_generate(g_eventID);
            g_originalTerminateHandler = std::set_terminate(CPPExceptionTerminate);
        }
        else
        {
            std::set_terminate(g_originalTerminateHandler);
        }
        g_captureNextStackTrace = isEnabled;
    }
}

static void initialize()
{
    static bool isInitialized = false;
    if(!isInitialized)
    {
        isInitialized = true;
        kssc_initCursor(&g_stackCursor, NULL, NULL);
    }
}

void kssc_initCursor(KSStackCursor *cursor,
                     void (*resetCursor)(KSStackCursor*),
                     bool (*advanceCursor)(KSStackCursor*))
{
    cursor->symbolicate = kssymbolicator_symbolicate;
    cursor->advanceCursor = advanceCursor != NULL ? advanceCursor : g_advanceCursor;
    cursor->resetCursor = resetCursor != NULL ? resetCursor : kssc_resetCursor;
    cursor->resetCursor(cursor);
}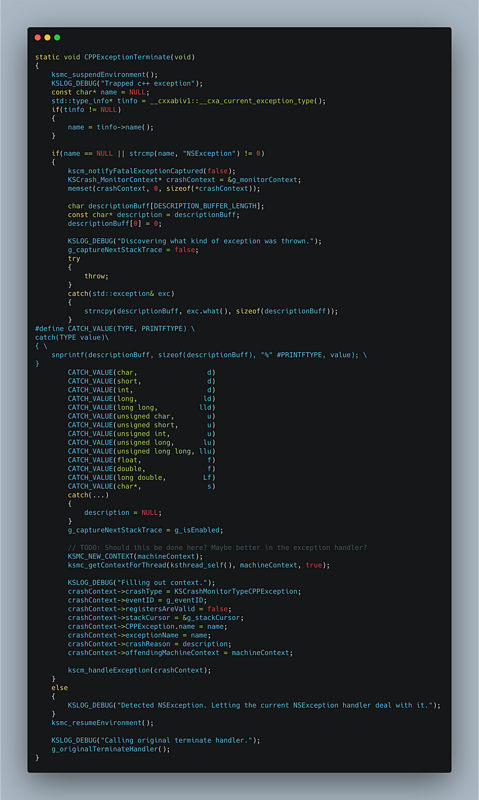
2.4. Objective-C exception handling
It is easy to handle the NSException exception at the OC level. You can register the nsuncautexceptionhandler to capture the exception information, collect the Crash information through the NSException parameter, and submit it to the data reporting component.
static void setEnabled(bool isEnabled)
{
    if(isEnabled != g_isEnabled)
    {
        g_isEnabled = isEnabled;
        if(isEnabled)
        {
            KSLOG_DEBUG(@"Backing up original handler.");
            // OC exception handling function before recording
            g_previousUncaughtExceptionHandler = NSGetUncaughtExceptionHandler();

            KSLOG_DEBUG(@"Setting new handler.");
            // Set new OC exception handling function
            NSSetUncaughtExceptionHandler(&handleException);
            KSCrash.sharedInstance.uncaughtExceptionHandler = &handleException;
        }
        else
        {
            KSLOG_DEBUG(@"Restoring original handler.");
            NSSetUncaughtExceptionHandler(g_previousUncaughtExceptionHandler);
        }
    }
}
2.5. Main thread deadlock
The deadlock detection of main thread is similar to that of ANR
- Create a thread, use do...while... Loop to process logic in the thread running method, and add autorelease to avoid excessive memory
- There is an awaitingResponse property and a watchdogPulse method. The main logic of watchdogPulse is to set awaitingResponse to YES, switch to the main thread, and set awaitingResponse to NO,
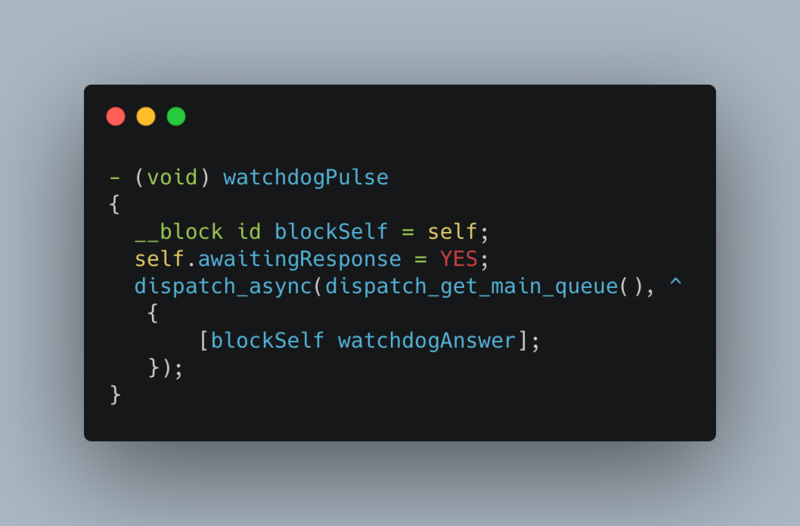
- The thread's execution method keeps cycling, waiting for the set G_ After watchdoginterval, judge whether the property value of awaitingResponse is the value of the initial state, otherwise, judge it as a deadlock
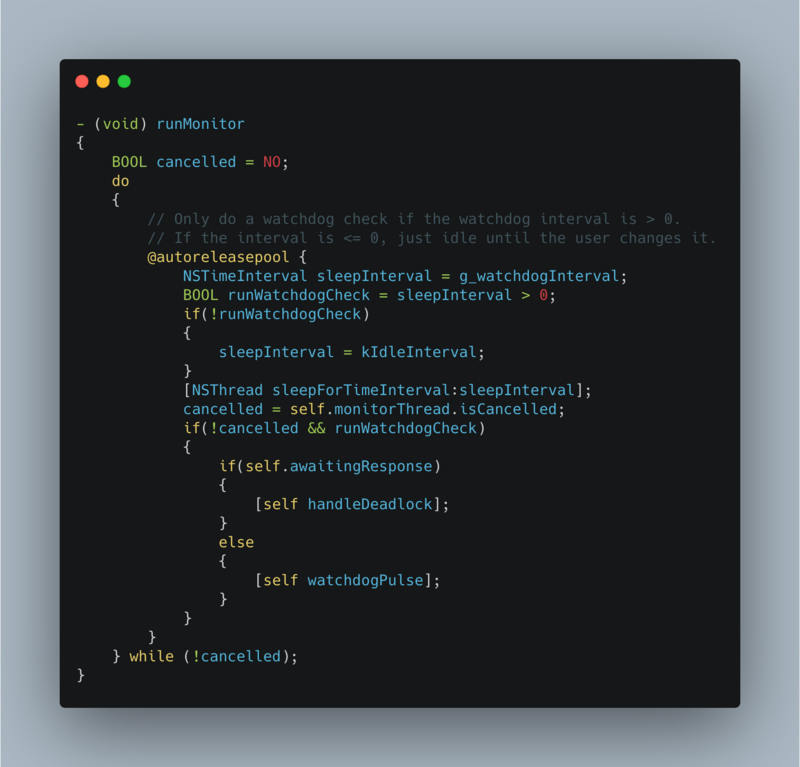
2.6 generation and preservation of crash
2.6.1 generation logic of crash log
The above part has talked about various crash monitoring logic in iOS application development. Next, we should analyze how to record the crash information after crash capture, that is, to save it in the application sandbox.
Take the crash of main thread deadlock as an example to see how KSCrash records crash information.
// KSCrashMonitor_Deadlock.m
- (void) handleDeadlock
{
    ksmc_suspendEnvironment();
    kscm_notifyFatalExceptionCaptured(false);

    KSMC_NEW_CONTEXT(machineContext);
    ksmc_getContextForThread(g_mainQueueThread, machineContext, false);
    KSStackCursor stackCursor;
    kssc_initWithMachineContext(&stackCursor, 100, machineContext);
    char eventID[37];
    ksid_generate(eventID);

    KSLOG_DEBUG(@"Filling out context.");
    KSCrash_MonitorContext* crashContext = &g_monitorContext;
    memset(crashContext, 0, sizeof(*crashContext));
    crashContext->crashType = KSCrashMonitorTypeMainThreadDeadlock;
    crashContext->eventID = eventID;
    crashContext->registersAreValid = false;
    crashContext->offendingMachineContext = machineContext;
    crashContext->stackCursor = &stackCursor;

    kscm_handleException(crashContext);
    ksmc_resumeEnvironment();

    KSLOG_DEBUG(@"Calling abort()");
    abort();
}
The same is true for several other crashes. The exception information is packaged and delivered to kscm_handleException() function processing. You can see that this function is called after it is captured by several other crashes.
/** Start general exception processing.
 *
 * @oaram context Contextual information about the exception.
 */
void kscm_handleException(struct KSCrash_MonitorContext* context)
{
    context->requiresAsyncSafety = g_requiresAsyncSafety;
    if(g_crashedDuringExceptionHandling)
    {
        context->crashedDuringCrashHandling = true;
    }
    for(int i = 0; i < g_monitorsCount; i++)
    {
        Monitor* monitor = &g_monitors[i];
        // Judge whether the current crash monitoring is on
        if(isMonitorEnabled(monitor))
        {
            // Make some additional information for each crash type
            addContextualInfoToEvent(monitor, context);
        }
    }
    // Real processing crash information, saving crash information in json format
    g_onExceptionEvent(context);


    if(g_handlingFatalException && !g_crashedDuringExceptionHandling)
    {
        KSLOG_DEBUG("Exception is fatal. Restoring original handlers.");
        kscm_setActiveMonitors(KSCrashMonitorTypeNone);
    }
}
g_onExceptionEvent is a block declared as static void (*g_onExceptionEvent)(struct KSCrash_MonitorContext* monitorContext); assigned in KSCrashMonitor.c
void kscm_setEventCallback(void (*onEvent)(struct KSCrash_MonitorContext* monitorContext))
{
    g_onExceptionEvent = onEvent;
}
kscm_ The seteventcallback() function is called in the KSCrashC.c file
KSCrashMonitorType kscrash_install(const char* appName, const char* const installPath)
{
    KSLOG_DEBUG("Installing crash reporter.");

    if(g_installed)
    {
        KSLOG_DEBUG("Crash reporter already installed.");
        return g_monitoring;
    }
    g_installed = 1;

    char path[KSFU_MAX_PATH_LENGTH];
    snprintf(path, sizeof(path), "%s/Reports", installPath);
    ksfu_makePath(path);
    kscrs_initialize(appName, path);

    snprintf(path, sizeof(path), "%s/Data", installPath);
    ksfu_makePath(path);
    snprintf(path, sizeof(path), "%s/Data/CrashState.json", installPath);
    kscrashstate_initialize(path);

    snprintf(g_consoleLogPath, sizeof(g_consoleLogPath), "%s/Data/ConsoleLog.txt", installPath);
    if(g_shouldPrintPreviousLog)
    {
        printPreviousLog(g_consoleLogPath);
    }
    kslog_setLogFilename(g_consoleLogPath, true);

    ksccd_init(60);
    // Set the callback function when crash occurs
    kscm_setEventCallback(onCrash);
    KSCrashMonitorType monitors = kscrash_setMonitoring(g_monitoring);

    KSLOG_DEBUG("Installation complete.");
    return monitors;
}

/** Called when a crash occurs.
 *
 * This function gets passed as a callback to a crash handler.
 */
static void onCrash(struct KSCrash_MonitorContext* monitorContext)
{
    KSLOG_DEBUG("Updating application state to note crash.");
    kscrashstate_notifyAppCrash();
    monitorContext->consoleLogPath = g_shouldAddConsoleLogToReport ? g_consoleLogPath : NULL;

    // While processing crash, another crash occurred
    if(monitorContext->crashedDuringCrashHandling)
    {
        kscrashreport_writeRecrashReport(monitorContext, g_lastCrashReportFilePath);
    }
    else
    {
        // 1. First create a new crash file path according to the current time
        char crashReportFilePath[KSFU_MAX_PATH_LENGTH];
        kscrs_getNextCrashReportPath(crashReportFilePath);
        // 2. Save the newly generated file path to g_lastCrashReportFilePath
        strncpy(g_lastCrashReportFilePath, crashReportFilePath, sizeof(g_lastCrashReportFilePath));
        // 3. Pass the newly generated file path into the function for crash writing
        kscrashreport_writeStandardReport(monitorContext, crashReportFilePath);
    }
}
The next function is the implementation of the specific log write file. The two functions do the same thing: they are formatted as json and written to files. The difference is that if crash occurs again during crash writing, the simple version of write logic kscrashreport will be used_ Writerecashreport(), otherwise follow the standard write logic kscrashreport_writeStandardReport().
bool ksfu_openBufferedWriter(KSBufferedWriter* writer, const char* const path, char* writeBuffer, int writeBufferLength)
{
    writer->buffer = writeBuffer;
    writer->bufferLength = writeBufferLength;
    writer->position = 0;
    /*
     open() The second parameter of describes the permissions for file operations
     #define O_RDONLY        0x0000         open for reading only
     #define O_WRONLY        0x0001         open for writing only
     #define O_RDWR          0x0002         open for reading and writing
     #define O_ACCMODE       0x0003         mask for above mode

     #define O_CREAT         0x0200         create if nonexistant
     #define O_TRUNC         0x0400         truncate to zero length
     #define O_EXCL          0x0800         error if already exists

     0755: That is, users have read / write / execute permissions, group users and other users have read / write permissions;
     0644: That is, users have read-write permission, group users and other users have read-only permission;
     Returns the file descriptor if successful or - 1 if present
     */
    writer->fd = open(path, O_RDWR | O_CREAT | O_EXCL, 0644);
    if(writer->fd < 0)
    {
        KSLOG_ERROR("Could not open crash report file %s: %s", path, strerror(errno));
        return false;
    }
    return true;
}
/** * Write a standard crash report to a file. * * @param monitorContext Contextual information about the crash and environment. * The caller must fill this out before passing it in. * * @param path The file to write to. */ void kscrashreport_writeStandardReport(const struct KSCrash_MonitorContext* const monitorContext, const char* path) { KSLOG_INFO("Writing crash report to %s", path); char writeBuffer[1024]; KSBufferedWriter bufferedWriter; if(!ksfu_openBufferedWriter(&bufferedWriter, path, writeBuffer, sizeof(writeBuffer))) { return; } ksccd_freeze(); KSJSONEncodeContext jsonContext; jsonContext.userData = &bufferedWriter; KSCrashReportWriter concreteWriter; KSCrashReportWriter* writer = &concreteWriter; prepareReportWriter(writer, &jsonContext); ksjson_beginEncode(getJsonContext(writer), true, addJSONData, &bufferedWriter); writer->beginObject(writer, KSCrashField_Report); { writeReportInfo(writer, KSCrashField_Report, KSCrashReportType_Standard, monitorContext->eventID, monitorContext->System.processName); ksfu_flushBufferedWriter(&bufferedWriter); writeBinaryImages(writer, KSCrashField_BinaryImages); ksfu_flushBufferedWriter(&bufferedWriter); writeProcessState(writer, KSCrashField_ProcessState, monitorContext); ksfu_flushBufferedWriter(&bufferedWriter); writeSystemInfo(writer, KSCrashField_System, monitorContext); ksfu_flushBufferedWriter(&bufferedWriter); writer->beginObject(writer, KSCrashField_Crash); { writeError(writer, KSCrashField_Error, monitorContext); ksfu_flushBufferedWriter(&bufferedWriter); writeAllThreads(writer, KSCrashField_Threads, monitorContext, g_introspectionRules.enabled); ksfu_flushBufferedWriter(&bufferedWriter); } writer->endContainer(writer); if(g_userInfoJSON != NULL) { addJSONElement(writer, KSCrashField_User, g_userInfoJSON, false); ksfu_flushBufferedWriter(&bufferedWriter); } else { writer->beginObject(writer, KSCrashField_User); } if(g_userSectionWriteCallback != NULL) { ksfu_flushBufferedWriter(&bufferedWriter); g_userSectionWriteCallback(writer); } writer->endContainer(writer); ksfu_flushBufferedWriter(&bufferedWriter); writeDebugInfo(writer, KSCrashField_Debug, monitorContext); } writer->endContainer(writer); ksjson_endEncode(getJsonContext(writer)); ksfu_closeBufferedWriter(&bufferedWriter); ksccd_unfreeze(); } /** Write a minimal crash report to a file. * * @param monitorContext Contextual information about the crash and environment. * The caller must fill this out before passing it in. * * @param path The file to write to. */ void kscrashreport_writeRecrashReport(const struct KSCrash_MonitorContext* const monitorContext, const char* path) { char writeBuffer[1024]; KSBufferedWriter bufferedWriter; static char tempPath[KSFU_MAX_PATH_LENGTH]; // Modify the file name path of the last crash report passed in (/ var / mobile / containers / data / application / **** / library / caches / kscrash / test / reports / test report - *****. json) to remove. json, and add. old to become the new file path / var / mobile / containers / data / application / ***** / library / caches / kscrash / test / reports / test report - ******.old strncpy(tempPath, path, sizeof(tempPath) - 10); strncpy(tempPath + strlen(tempPath) - 5, ".old", 5); KSLOG_INFO("Writing recrash report to %s", path); if(rename(path, tempPath) < 0) { KSLOG_ERROR("Could not rename %s to %s: %s", path, tempPath, strerror(errno)); } // Open the file needed for memory writing according to the incoming path if(!ksfu_openBufferedWriter(&bufferedWriter, path, writeBuffer, sizeof(writeBuffer))) { return; } ksccd_freeze(); // c code of json parsing KSJSONEncodeContext jsonContext; jsonContext.userData = &bufferedWriter; KSCrashReportWriter concreteWriter; KSCrashReportWriter* writer = &concreteWriter; prepareReportWriter(writer, &jsonContext); ksjson_beginEncode(getJsonContext(writer), true, addJSONData, &bufferedWriter); writer->beginObject(writer, KSCrashField_Report); { writeRecrash(writer, KSCrashField_RecrashReport, tempPath); ksfu_flushBufferedWriter(&bufferedWriter); if(remove(tempPath) < 0) { KSLOG_ERROR("Could not remove %s: %s", tempPath, strerror(errno)); } writeReportInfo(writer, KSCrashField_Report, KSCrashReportType_Minimal, monitorContext->eventID, monitorContext->System.processName); ksfu_flushBufferedWriter(&bufferedWriter); writer->beginObject(writer, KSCrashField_Crash); { writeError(writer, KSCrashField_Error, monitorContext); ksfu_flushBufferedWriter(&bufferedWriter); int threadIndex = ksmc_indexOfThread(monitorContext->offendingMachineContext, ksmc_getThreadFromContext(monitorContext->offendingMachineContext)); writeThread(writer, KSCrashField_CrashedThread, monitorContext, monitorContext->offendingMachineContext, threadIndex, false); ksfu_flushBufferedWriter(&bufferedWriter); } writer->endContainer(writer); } writer->endContainer(writer); ksjson_endEncode(getJsonContext(writer)); ksfu_closeBufferedWriter(&bufferedWriter); ksccd_unfreeze(); }2.6.2 read logic of crash log
After the current App crashes, KSCrash saves the data to the App sandbox directory. After the App starts next time, we read the stored crash file, then process the data and upload it.
Function call after App startup:
[KSCrashInstallation sendAllReportsWithCompletion:] -> [KSCrash sendAllReportsWithCompletion:] -> [KSCrash allReports] -> [KSCrash reportWithIntID:] ->[KSCrash loadCrashReportJSONWithID:] -> kscrs_readReport
Read the Crash data in the sandbox in sendAllReportsWithCompletion.
// First, judge the number of crash reports by reading the folder and traversing the number of files in the folder
static int getReportCount()
{
    int count = 0;
    DIR* dir = opendir(g_reportsPath);
    if(dir == NULL)
    {
        KSLOG_ERROR("Could not open directory %s", g_reportsPath);
        goto done;
    }
    struct dirent* ent;
    while((ent = readdir(dir)) != NULL)
    {
        if(getReportIDFromFilename(ent->d_name) > 0)
        {
            count++;
        }
    }

done:
    if(dir != NULL)
    {
        closedir(dir);
    }
    return count;
}

// Traverse through the number of crash files and folder information, get the file name (the last part of the file name is the reportID), get the reportID, read the file content in the crash report, and write the array
- (NSArray*) allReports
{
    int reportCount = kscrash_getReportCount();
    int64_t reportIDs[reportCount];
    reportCount = kscrash_getReportIDs(reportIDs, reportCount);
    NSMutableArray* reports = [NSMutableArray arrayWithCapacity:(NSUInteger)reportCount];
    for(int i = 0; i < reportCount; i++)
    {
        NSDictionary* report = [self reportWithIntID:reportIDs[i]];
        if(report != nil)
        {
            [reports addObject:report];
        }
    }

    return reports;
}

//  Find crash information based on reportID
- (NSDictionary*) reportWithIntID:(int64_t) reportID
{
    NSData* jsonData = [self loadCrashReportJSONWithID:reportID];
    if(jsonData == nil)
    {
        return nil;
    }

    NSError* error = nil;
    NSMutableDictionary* crashReport = [KSJSONCodec decode:jsonData
                                                   options:KSJSONDecodeOptionIgnoreNullInArray |
                                                           KSJSONDecodeOptionIgnoreNullInObject |
                                                           KSJSONDecodeOptionKeepPartialObject
                                                     error:&error];
    if(error != nil)
    {
        KSLOG_ERROR(@"Encountered error loading crash report %" PRIx64 ": %@", reportID, error);
    }
    if(crashReport == nil)
    {
        KSLOG_ERROR(@"Could not load crash report");
        return nil;
    }
    [self doctorReport:crashReport];

    return crashReport;
}

//  reportID reads crash content and converts to NSData type
- (NSData*) loadCrashReportJSONWithID:(int64_t) reportID
{
    char* report = kscrash_readReport(reportID);
    if(report != NULL)
    {
        return [NSData dataWithBytesNoCopy:report length:strlen(report) freeWhenDone:YES];
    }
    return nil;
}

// reportID reads crash data to char type
char* kscrash_readReport(int64_t reportID)
{
    if(reportID <= 0)
    {
        KSLOG_ERROR("Report ID was %" PRIx64, reportID);
        return NULL;
    }

    char* rawReport = kscrs_readReport(reportID);
    if(rawReport == NULL)
    {
        KSLOG_ERROR("Failed to load report ID %" PRIx64, reportID);
        return NULL;
    }

    char* fixedReport = kscrf_fixupCrashReport(rawReport);
    if(fixedReport == NULL)
    {
        KSLOG_ERROR("Failed to fixup report ID %" PRIx64, reportID);
    }

    free(rawReport);
    return fixedReport;
}

// Multi thread lock, execute the c function getCrashReportPathByID through reportID, and set the path to path. Then perform ksfu_readEntireFile reads crash information to result
char* kscrs_readReport(int64_t reportID)
{
    pthread_mutex_lock(&g_mutex);
    char path[KSCRS_MAX_PATH_LENGTH];
    getCrashReportPathByID(reportID, path);
    char* result;
    ksfu_readEntireFile(path, &result, NULL, 2000000);
    pthread_mutex_unlock(&g_mutex);
    return result;
}

int kscrash_getReportIDs(int64_t* reportIDs, int count)
{
    return kscrs_getReportIDs(reportIDs, count);
}

int kscrs_getReportIDs(int64_t* reportIDs, int count)
{
    pthread_mutex_lock(&g_mutex);
    count = getReportIDs(reportIDs, count);
    pthread_mutex_unlock(&g_mutex);
    return count;
}
// Read the contents of the folder circularly according to ENT - > d_ Name calls getReportIDFromFilename function to get reportID, and the array is filled in the loop
static int getReportIDs(int64_t* reportIDs, int count)
{
    int index = 0;
    DIR* dir = opendir(g_reportsPath);
    if(dir == NULL)
    {
        KSLOG_ERROR("Could not open directory %s", g_reportsPath);
        goto done;
    }

    struct dirent* ent;
    while((ent = readdir(dir)) != NULL && index < count)
    {
        int64_t reportID = getReportIDFromFilename(ent->d_name);
        if(reportID > 0)
        {
            reportIDs[index++] = reportID;
        }
    }

    qsort(reportIDs, (unsigned)count, sizeof(reportIDs[0]), compareInt64);

done:
    if(dir != NULL)
    {
        closedir(dir);
    }
    return index;
}

// The sprintf (parameter 1, format 2) function returns the value of format 2 to parameter 1, and then executes sscanf (parameter 1, parameter 2, parameter 3). The function writes the content of string parameter 1 to parameter 3 according to the format of parameter 2. The crash file is named "App name report"- reportID.json "
static int64_t getReportIDFromFilename(const char* filename)
{
    char scanFormat[100];
    sprintf(scanFormat, "%s-report-%%" PRIx64 ".json", g_appName);

    int64_t reportID = 0;
    sscanf(filename, scanFormat, &reportID);
    return reportID;
}
2.7 monitoring of Crash related to front-end js
2.7.1 JavaScript core exception monitoring
This part is simple and crude. It is directly monitored by the exceptionHandler property of the JSContext object, such as the following code
jsContext.exceptionHandler = ^(JSContext *context, JSValue *exception) {
    // Handling exception information related to jscore
};
2.7.2 h5 page exception monitoring
When Javascript in h5 page runs abnormally, window object will trigger error event of erroreevent interface and execute window.onerror().
window.onerror = function (msg, url, lineNumber, columnNumber, error) {
   // Handling exception information
};
2.7.3 react native abnormal monitoring
Small experiment: in the following figure, an RN Demo project is written. Event monitoring code is added to the Debug Text control, and crash is triggered artificially inside
<Text style={styles.sectionTitle} onPress={()=>{1+qw;}}>Debug</Text>Control group 1:
Condition: iOS project debug mode. The code for exception handling is added at RN end.
The simulator will click command + d to call up the panel, select Debug, open Chrome browser, and the shortcut key Command + Option + J under Mac will open the debugging panel, so that the RN code can be debugged just like the real code.
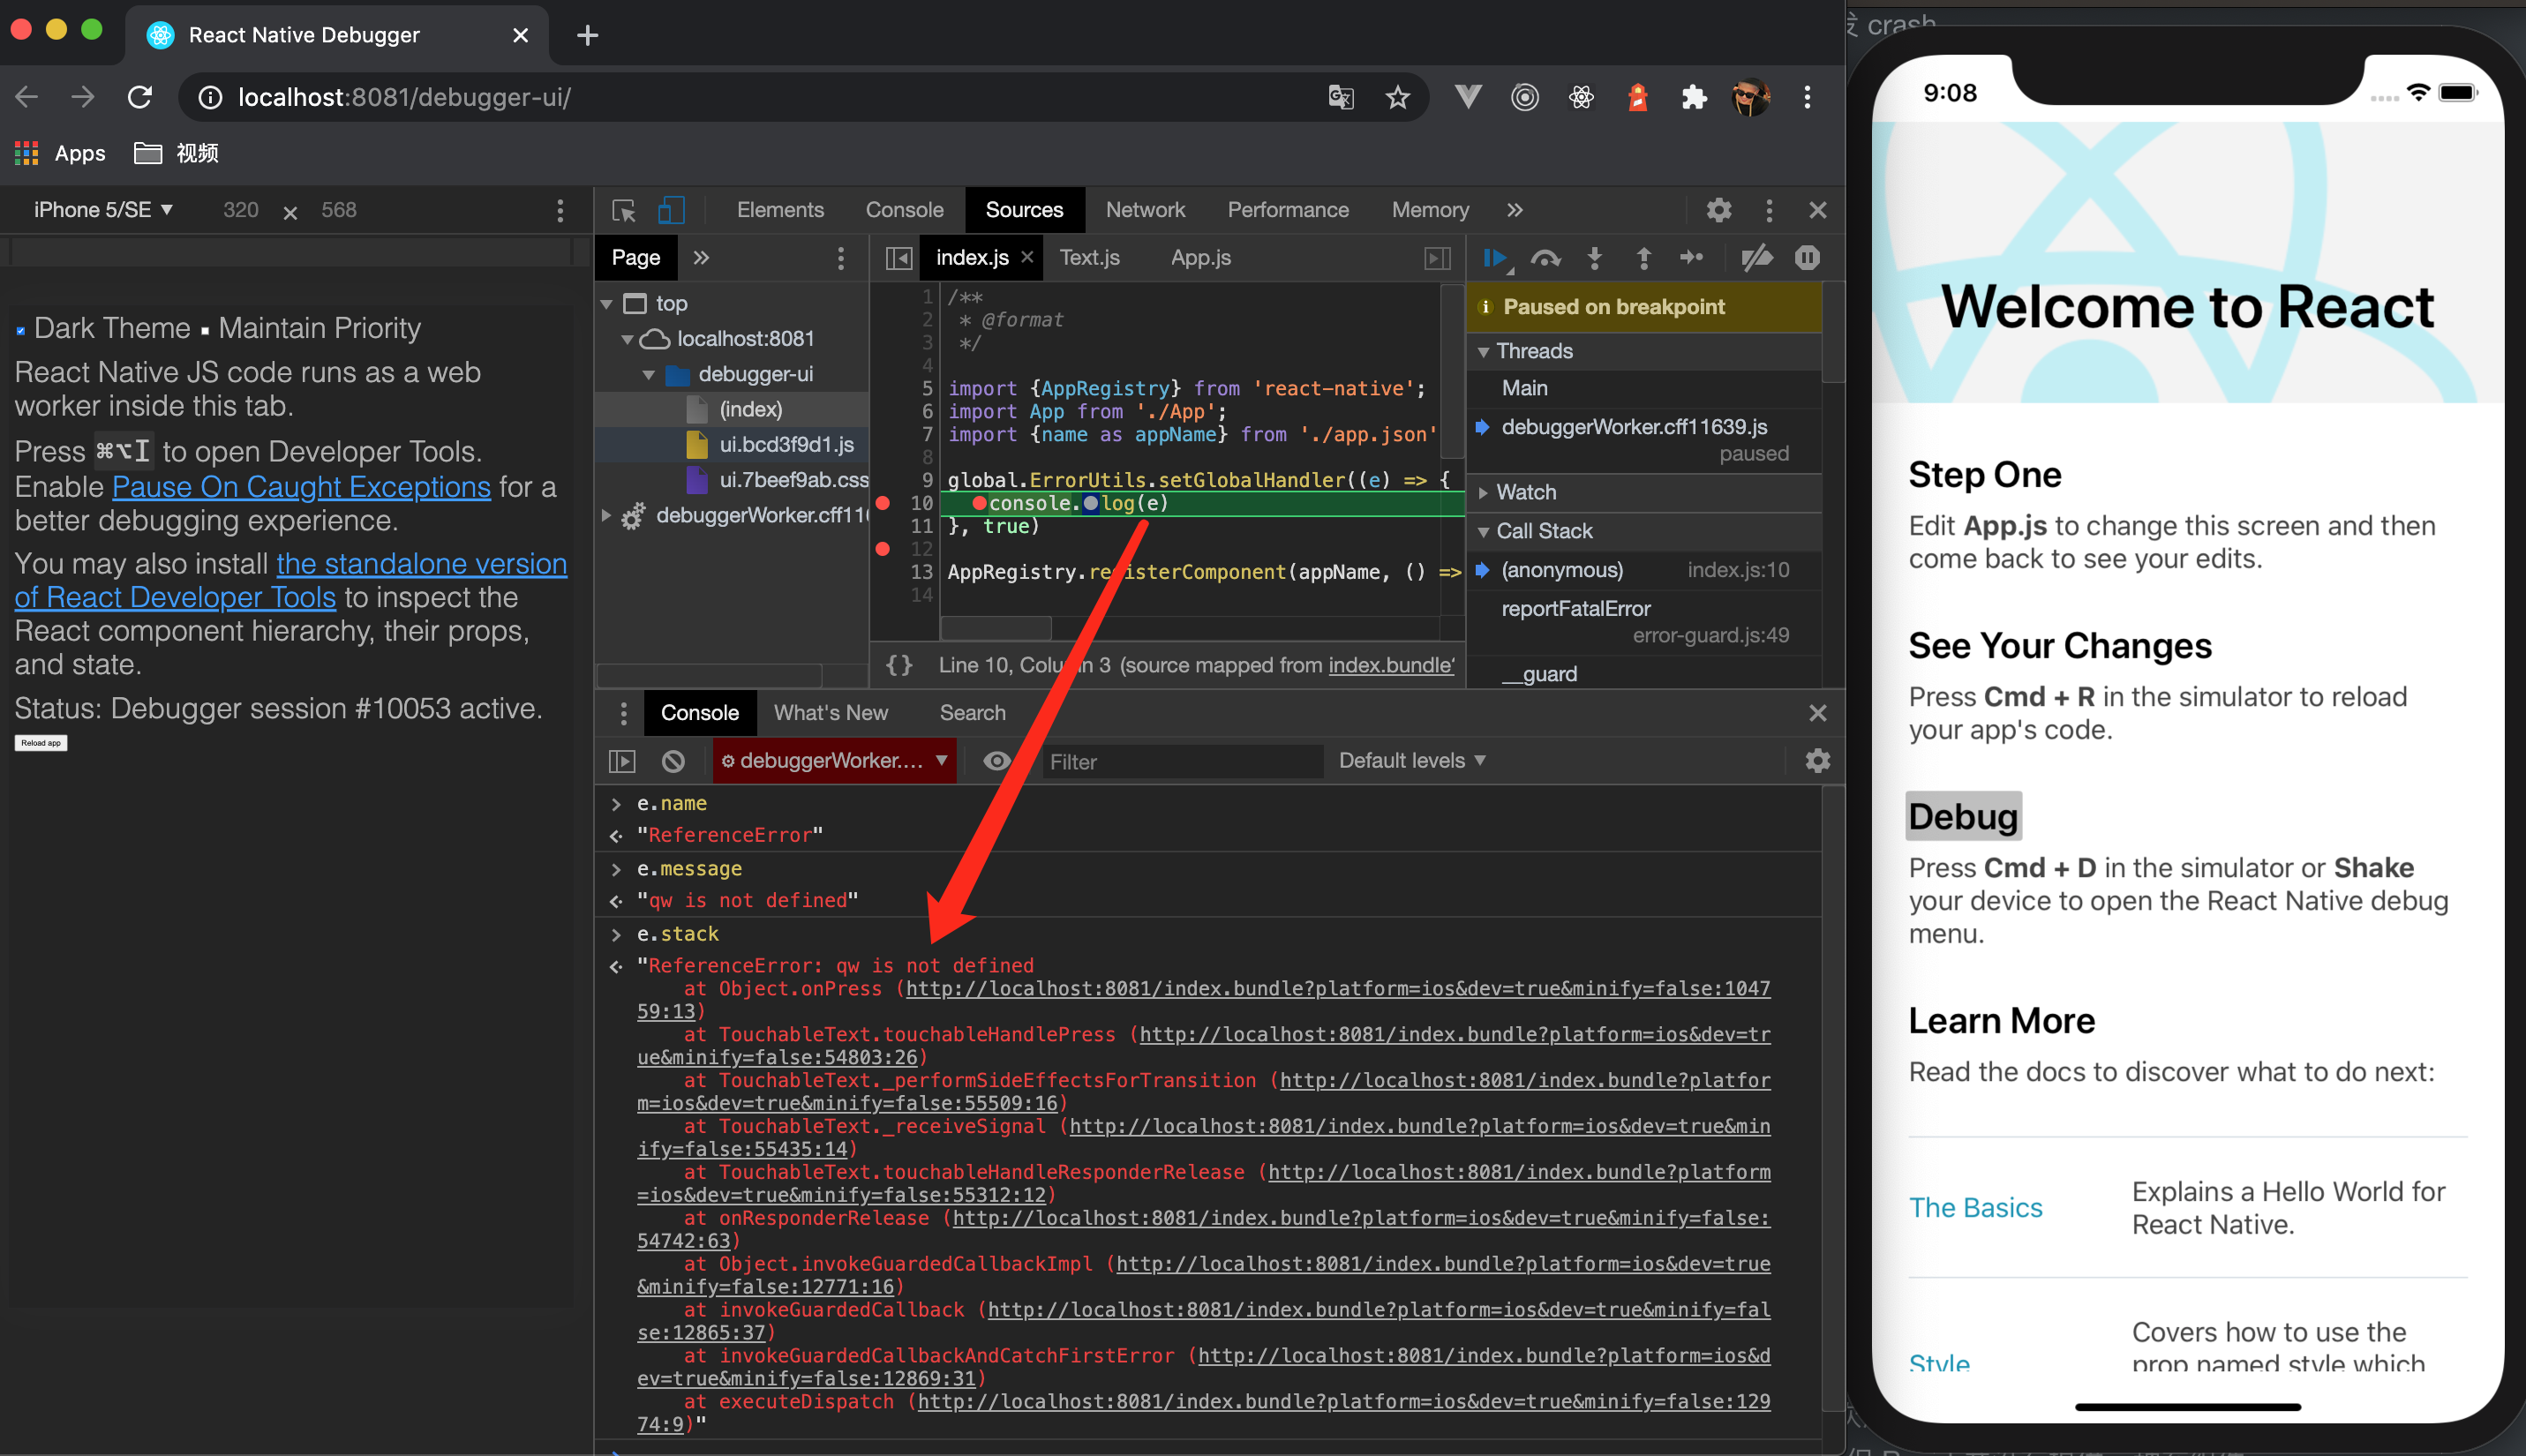
After checking the crash stack, click to jump to the place of sourceMap.
Tips: Release package for RN project
- Create a folder under the project root (release_iOS), as the output folder of the resource
-
Switch to the project directory at the terminal, and then execute the following code
react-native bundle --entry-file index.js --platform ios --dev false --bundle-output release_ios/main.jsbundle --assets-dest release_iOS --sourcemap-output release_ios/index.ios.map; - Release_ Drag the contents of the. Jsbundles and assets folders in the iOS folder into the iOS project
Control group 2:
Condition: iOS project release mode. Do not add exception handling code at RN end
Operation: run iOS project and click the button to simulate crash
Phenomenon: iOS project crashes. The screenshots and logs are as follows
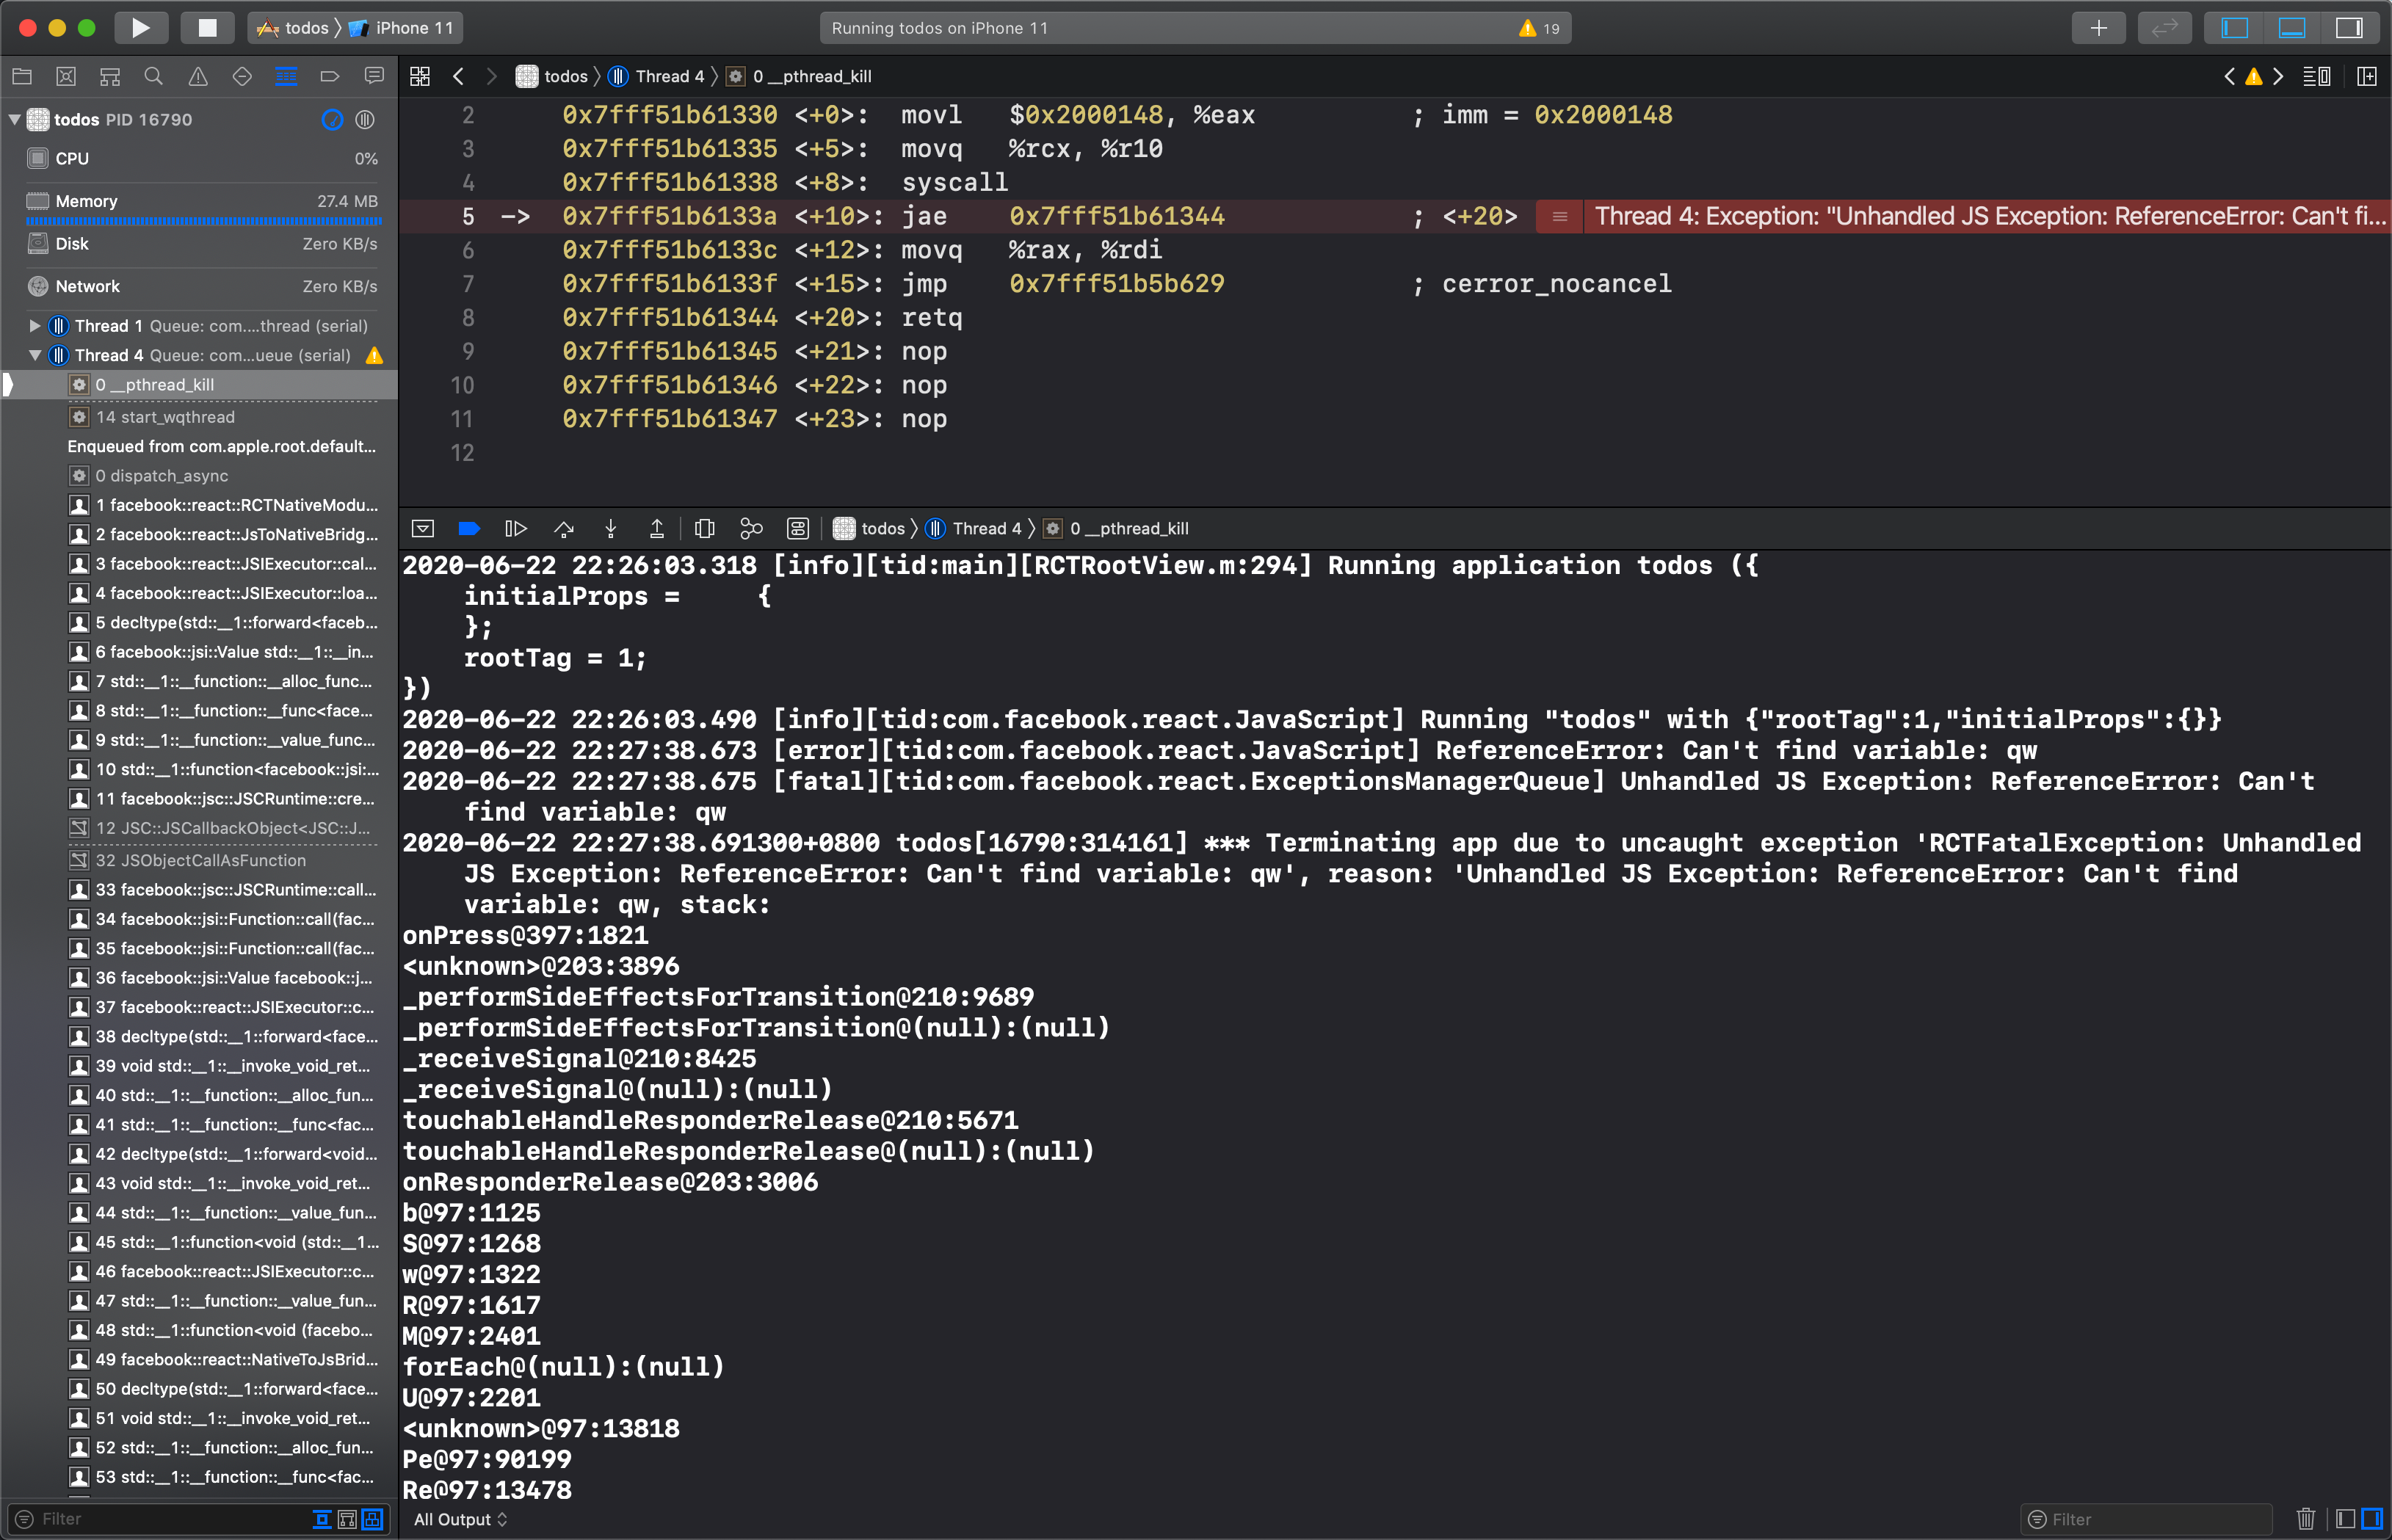
2020-06-22 22:26:03.318 [info][tid:main][RCTRootView.m:294] Running application todos ({
    initialProps =     {
    };
    rootTag = 1;
})
2020-06-22 22:26:03.490 [info][tid:com.facebook.react.JavaScript] Running "todos" with {"rootTag":1,"initialProps":{}}
2020-06-22 22:27:38.673 [error][tid:com.facebook.react.JavaScript] ReferenceError: Can't find variable: qw
2020-06-22 22:27:38.675 [fatal][tid:com.facebook.react.ExceptionsManagerQueue] Unhandled JS Exception: ReferenceError: Can't find variable: qw
2020-06-22 22:27:38.691300+0800 todos[16790:314161] *** Terminating app due to uncaught exception 'RCTFatalException: Unhandled JS Exception: ReferenceError: Can't find variable: qw', reason: 'Unhandled JS Exception: ReferenceError: Can't find variable: qw, stack:
onPress@397:1821
<unknown>@203:3896
_performSideEffectsForTransition@210:9689
_performSideEffectsForTransition@(null):(null)
_receiveSignal@210:8425
_receiveSignal@(null):(null)
touchableHandleResponderRelease@210:5671
touchableHandleResponderRelease@(null):(null)
onResponderRelease@203:3006
b@97:1125
S@97:1268
w@97:1322
R@97:1617
M@97:2401
forEach@(null):(null)
U@97:2201
<unknown>@97:13818
Pe@97:90199
Re@97:13478
Ie@97:13664
receiveTouches@97:14448
value@27:3544
<unknown>@27:840
value@27:2798
value@27:812
value@(null):(null)
'
*** First throw call stack:
(
    0   CoreFoundation                      0x00007fff23e3cf0e __exceptionPreprocess + 350
    1   libobjc.A.dylib                     0x00007fff50ba89b2 objc_exception_throw + 48
    2   todos                               0x00000001017b0510 RCTFormatError + 0
    3   todos                               0x000000010182d8ca -[RCTExceptionsManager reportFatal:stack:exceptionId:suppressRedBox:] + 503
    4   todos                               0x000000010182e34e -[RCTExceptionsManager reportException:] + 1658
    5   CoreFoundation                      0x00007fff23e43e8c __invoking___ + 140
    6   CoreFoundation                      0x00007fff23e41071 -[NSInvocation invoke] + 321
    7   CoreFoundation                      0x00007fff23e41344 -[NSInvocation invokeWithTarget:] + 68
    8   todos                               0x00000001017e07fa -[RCTModuleMethod invokeWithBridge:module:arguments:] + 578
    9   todos                               0x00000001017e2a84 _ZN8facebook5reactL11invokeInnerEP9RCTBridgeP13RCTModuleDatajRKN5folly7dynamicE + 246
    10  todos                               0x00000001017e280c ___ZN8facebook5react15RCTNativeModule6invokeEjON5folly7dynamicEi_block_invoke + 78
    11  libdispatch.dylib                   0x00000001025b5f11 _dispatch_call_block_and_release + 12
    12  libdispatch.dylib                   0x00000001025b6e8e _dispatch_client_callout + 8
    13  libdispatch.dylib                   0x00000001025bd6fd _dispatch_lane_serial_drain + 788
    14  libdispatch.dylib                   0x00000001025be28f _dispatch_lane_invoke + 422
    15  libdispatch.dylib                   0x00000001025c9b65 _dispatch_workloop_worker_thread + 719
    16  libsystem_pthread.dylib             0x00007fff51c08a3d _pthread_wqthread + 290
    17  libsystem_pthread.dylib             0x00007fff51c07b77 start_wqthread + 15
)
libc++abi.dylib: terminating with uncaught exception of type NSException
(lldb)
Tips: how to debug in RN release mode (see the console information on js side)
- Import < react / rctlog. H > in AppDelegate.m
- Add RCTSetLogThreshold(RCTLogLevelTrace) to - (BOOL)application:(UIApplication *)application didFinishLaunchingWithOptions:(NSDictionary *)launchOptions;
Control group 3:
Condition: iOS project release mode. Add exception handling code at RN end.
global.ErrorUtils.setGlobalHandler((e) => {
  console.log(e);
  let message = { name: e.name,
                message: e.message,
                stack: e.stack
  };
  axios.get('http://192.168.1.100:8888/test.php', {
      params: { 'message': JSON.stringify(message) }
  }).then(function (response) {
          console.log(response)
  }).catch(function (error) {
  console.log(error)
  });
}, true)
Operation: run iOS project and click the button to simulate crash.
Phenomenon: iOS project does not collapse. The log information is as follows, comparing js in bundle package.
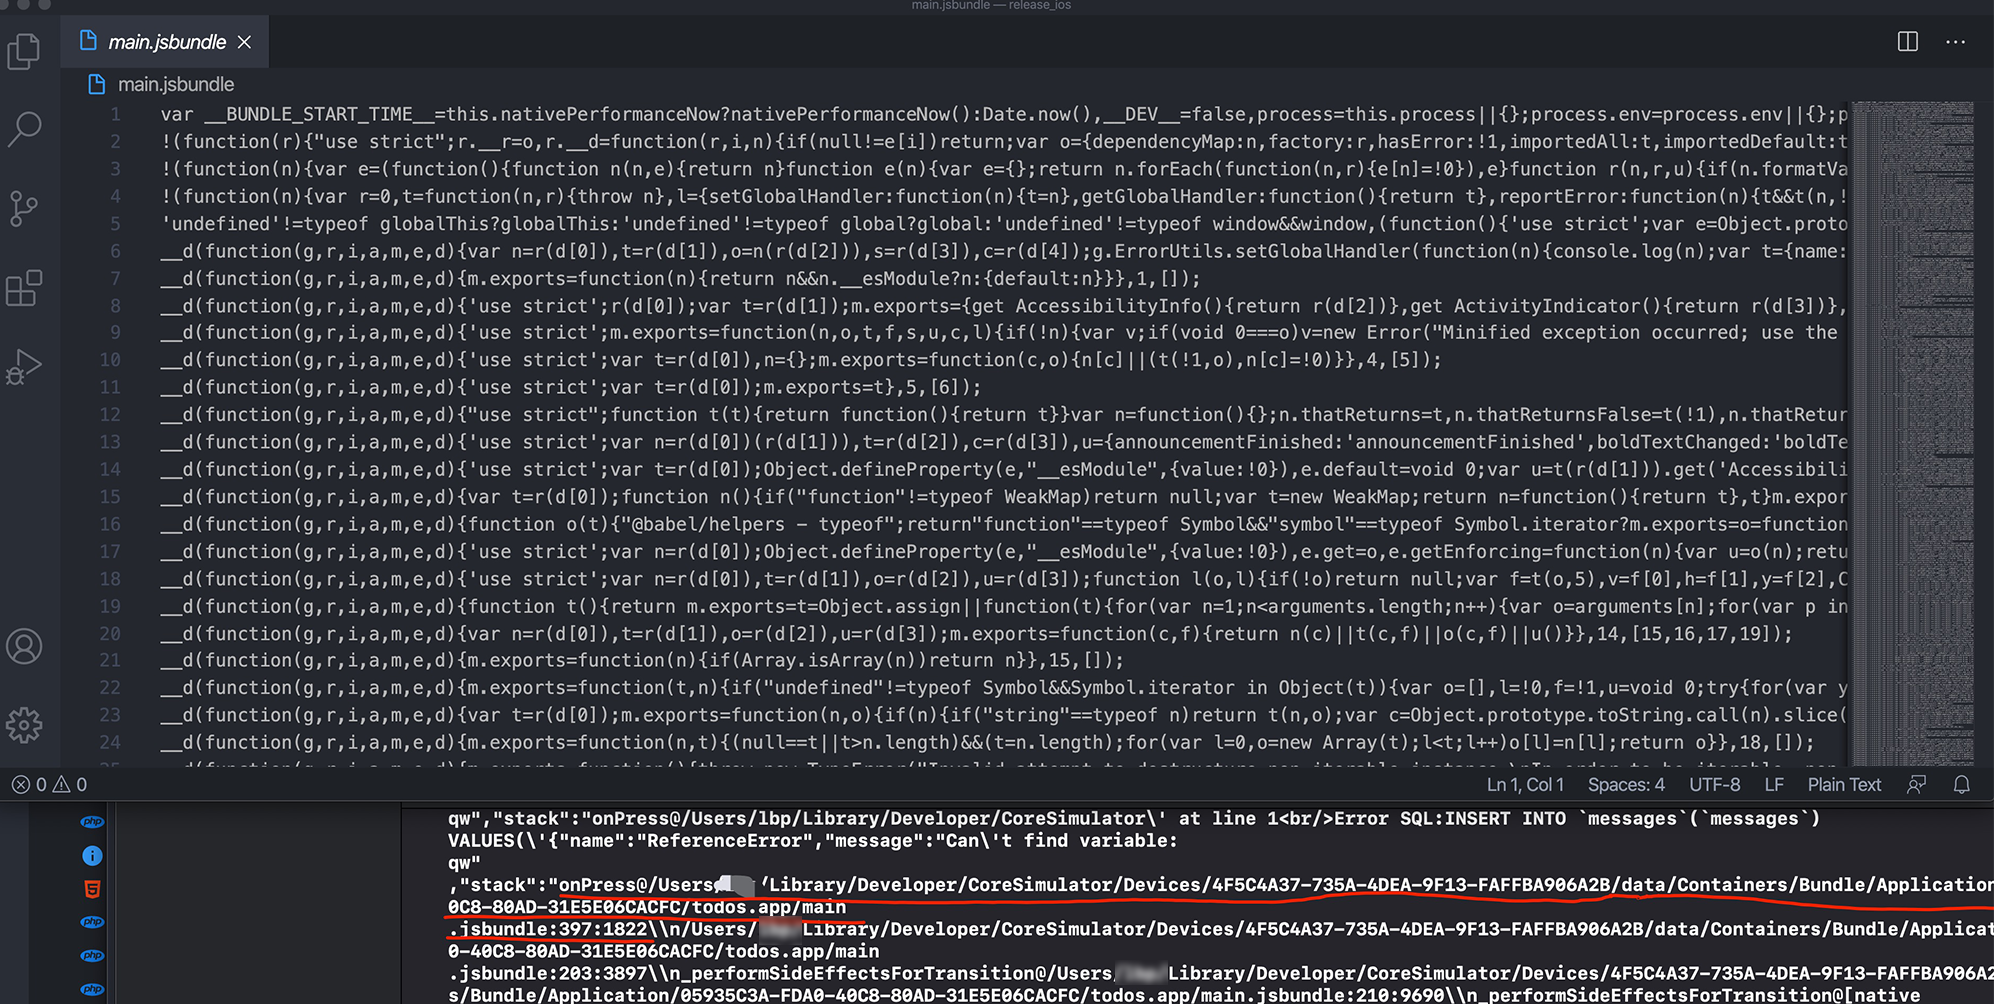
Conclusion:
In RN projects, if crash occurs, it will be reflected in the Native side. If the RN side writes crash captured code, the Native side will not crash. If the crash on the RN side is not captured, Native will directly crash.
The RN project writes crash monitoring. After monitoring, the stack information is printed out and found that the corresponding js information is processed by webpack. Crash analysis is very difficult. So we need to write monitoring code on the RN side for the crash of RN, and report it after monitoring. In addition, we need to write special crash information to restore to you for the information after monitoring, that is, sourceMap parsing.
2.7.3.1 js logic error
People who have written RN know that if there is a problem with js code in DEBUG mode, a red screen will appear, and if there is a problem in RELEASE mode, a white screen or a flash back will appear. In order to experience and control quality, abnormal monitoring is required.
Error utils is found when looking at RN source code. You can set error handling information by looking at the code.
/**
 * Copyright (c) Facebook, Inc. and its affiliates.
 *
 * This source code is licensed under the MIT license found in the
 * LICENSE file in the root directory of this source tree.
 *
 * @format
 * @flow strict
 * @polyfill
 */

let _inGuard = 0;

type ErrorHandler = (error: mixed, isFatal: boolean) => void;
type Fn<Args, Return> = (...Args) => Return;

/**
 * This is the error handler that is called when we encounter an exception
 * when loading a module. This will report any errors encountered before
 * ExceptionsManager is configured.
 */
let _globalHandler: ErrorHandler = function onError(
  e: mixed,
  isFatal: boolean,
) {
  throw e;
};

/**
 * The particular require runtime that we are using looks for a global
 * `ErrorUtils` object and if it exists, then it requires modules with the
 * error handler specified via ErrorUtils.setGlobalHandler by calling the
 * require function with applyWithGuard. Since the require module is loaded
 * before any of the modules, this ErrorUtils must be defined (and the handler
 * set) globally before requiring anything.
 */
const ErrorUtils = {
  setGlobalHandler(fun: ErrorHandler): void {
    _globalHandler = fun;
  },
  getGlobalHandler(): ErrorHandler {
    return _globalHandler;
  },
  reportError(error: mixed): void {
    _globalHandler && _globalHandler(error, false);
  },
  reportFatalError(error: mixed): void {
    // NOTE: This has an untyped call site in Metro.
    _globalHandler && _globalHandler(error, true);
  },
  applyWithGuard<TArgs: $ReadOnlyArray<mixed>, TOut>(
    fun: Fn<TArgs, TOut>,
    context?: ?mixed,
    args?: ?TArgs,
    // Unused, but some code synced from www sets it to null.
    unused_onError?: null,
    // Some callers pass a name here, which we ignore.
    unused_name?: ?string,
  ): ?TOut {
    try {
      _inGuard++;
      // $FlowFixMe: TODO T48204745 (1) apply(context, null) is fine. (2) array -> rest array should work
      return fun.apply(context, args);
    } catch (e) {
      ErrorUtils.reportError(e);
    } finally {
      _inGuard--;
    }
    return null;
  },
  applyWithGuardIfNeeded<TArgs: $ReadOnlyArray<mixed>, TOut>(
    fun: Fn<TArgs, TOut>,
    context?: ?mixed,
    args?: ?TArgs,
  ): ?TOut {
    if (ErrorUtils.inGuard()) {
      // $FlowFixMe: TODO T48204745 (1) apply(context, null) is fine. (2) array -> rest array should work
      return fun.apply(context, args);
    } else {
      ErrorUtils.applyWithGuard(fun, context, args);
    }
    return null;
  },
  inGuard(): boolean {
    return !!_inGuard;
  },
  guard<TArgs: $ReadOnlyArray<mixed>, TOut>(
    fun: Fn<TArgs, TOut>,
    name?: ?string,
    context?: ?mixed,
  ): ?(...TArgs) => ?TOut {
    // TODO: (moti) T48204753 Make sure this warning is never hit and remove it - types
    // should be sufficient.
    if (typeof fun !== 'function') {
      console.warn('A function must be passed to ErrorUtils.guard, got ', fun);
      return null;
    }
    const guardName = name ?? fun.name ?? '<generated guard>';
    function guarded(...args: TArgs): ?TOut {
      return ErrorUtils.applyWithGuard(
        fun,
        context ?? this,
        args,
        null,
        guardName,
      );
    }

    return guarded;
  },
};

global.ErrorUtils = ErrorUtils;

export type ErrorUtilsT = typeof ErrorUtils;
So RN exceptions can be used global.ErrorUtils To set up error handling. for instance
global.ErrorUtils.setGlobalHandler(e => {
   // e.name e.message e.stack
}, true);
2.7.3.2 component problems
In fact, there is a need to pay attention to the fact that the React Error Boundaries is used to deal with the crash of RN. Details
In the past, JavaScript errors in components could cause the internal state of React to be destroyed, and the next rendering produce May not be traceable error . These errors are basically caused by other earlier code (non React component code) errors, but React does not provide a way to handle these errors gracefully in the component, nor can it recover from them.
In order to solve this problem, React 16 introduces a new concept - error boundary.
The error boundary is a React component that can capture and print JavaScript errors that occur anywhere in its subcomponent tree, and it will render the alternate UI instead of the crashed subcomponent tree. The error boundary captures errors during rendering, in the lifecycle method, and in the constructor for the entire component tree.
It can catch exceptions in subcomponent lifecycle functions, including constructor s and render functions
Instead of catching the following exception:
- Event handlers
- Asynchronous code (asynchronous code, such as setTimeout, promise, etc.)
- Server side rendering
- Errors throw in the error boundary itself (rater than its children)
So we can capture all the exceptions in the component life cycle through the exception boundary component and then render the bottomless component to prevent App crash and improve the user experience. It can also guide users to feed back problems and facilitate troubleshooting and repair
So far, RN crash can be divided into two types, namely js logic error and component js error, which have been monitored and processed. Now let's see how to solve these problems from the engineering level
2.7.4 RN Crash reduction
The SourceMap file is very important for the analysis of front-end logs. All parameters and calculation steps in the SourceMap file are written in it, which can be viewed This article.
With the SourceMap file, the mozilla Of source-map Project, which can restore the crash log of RN.
I wrote a NodeJS script, the code is as follows
var fs = require('fs');
var sourceMap = require('source-map');
var arguments = process.argv.splice(2);

function parseJSError(aLine, aColumn) {
    fs.readFile('./index.ios.map', 'utf8', function (err, data) {
        const whatever =  sourceMap.SourceMapConsumer.with(data, null, consumer => {
            // Read the row number and column number of crash log
            let parseData = consumer.originalPositionFor({
                line: parseInt(aLine),
                column: parseInt(aColumn)
            });
            // Output to console
            console.log(parseData);
            // Export to file
            fs.writeFileSync('./parsed.txt', JSON.stringify(parseData) + '\n', 'utf8', function(err) {
                if(err) {
                    console.log(err);
                }
            });
        });
    });
}

var line = arguments[0];
var column = arguments[1];
parseJSError(line, column);
The next experiment is the todos project mentioned above.
-
Simulate crash on the click event of Text
<Text style={styles.sectionTitle} onPress={()=>{1+qw;}}>Debug</Text> -
bundle the RN project and output the sourceMap file. Execution of orders,
react-native bundle --entry-file index.js --platform android --dev false --bundle-output release_ios/main.jsbundle --assets-dest release_iOS --sourcemap-output release_ios/index.android.map;Because of high frequency use, add alias setting to iterm2 and modify the. zshrc file
alias RNRelease='react-native bundle --entry-file index.js --platform ios --dev false --bundle-output release_ios/main.jsbundle --assets-dest release_iOS --sourcemap-output release_ios/index.ios.map;' # RN to Release package - Copy js bundle and image resources to Xcode project
-
Click simulate crash to copy the row number and column number under the log. Under the Node project, execute the following command
node index.js 397 1822 - Take the line number, column number and file information parsed by the script to compare with the source code file, and the result is very correct.
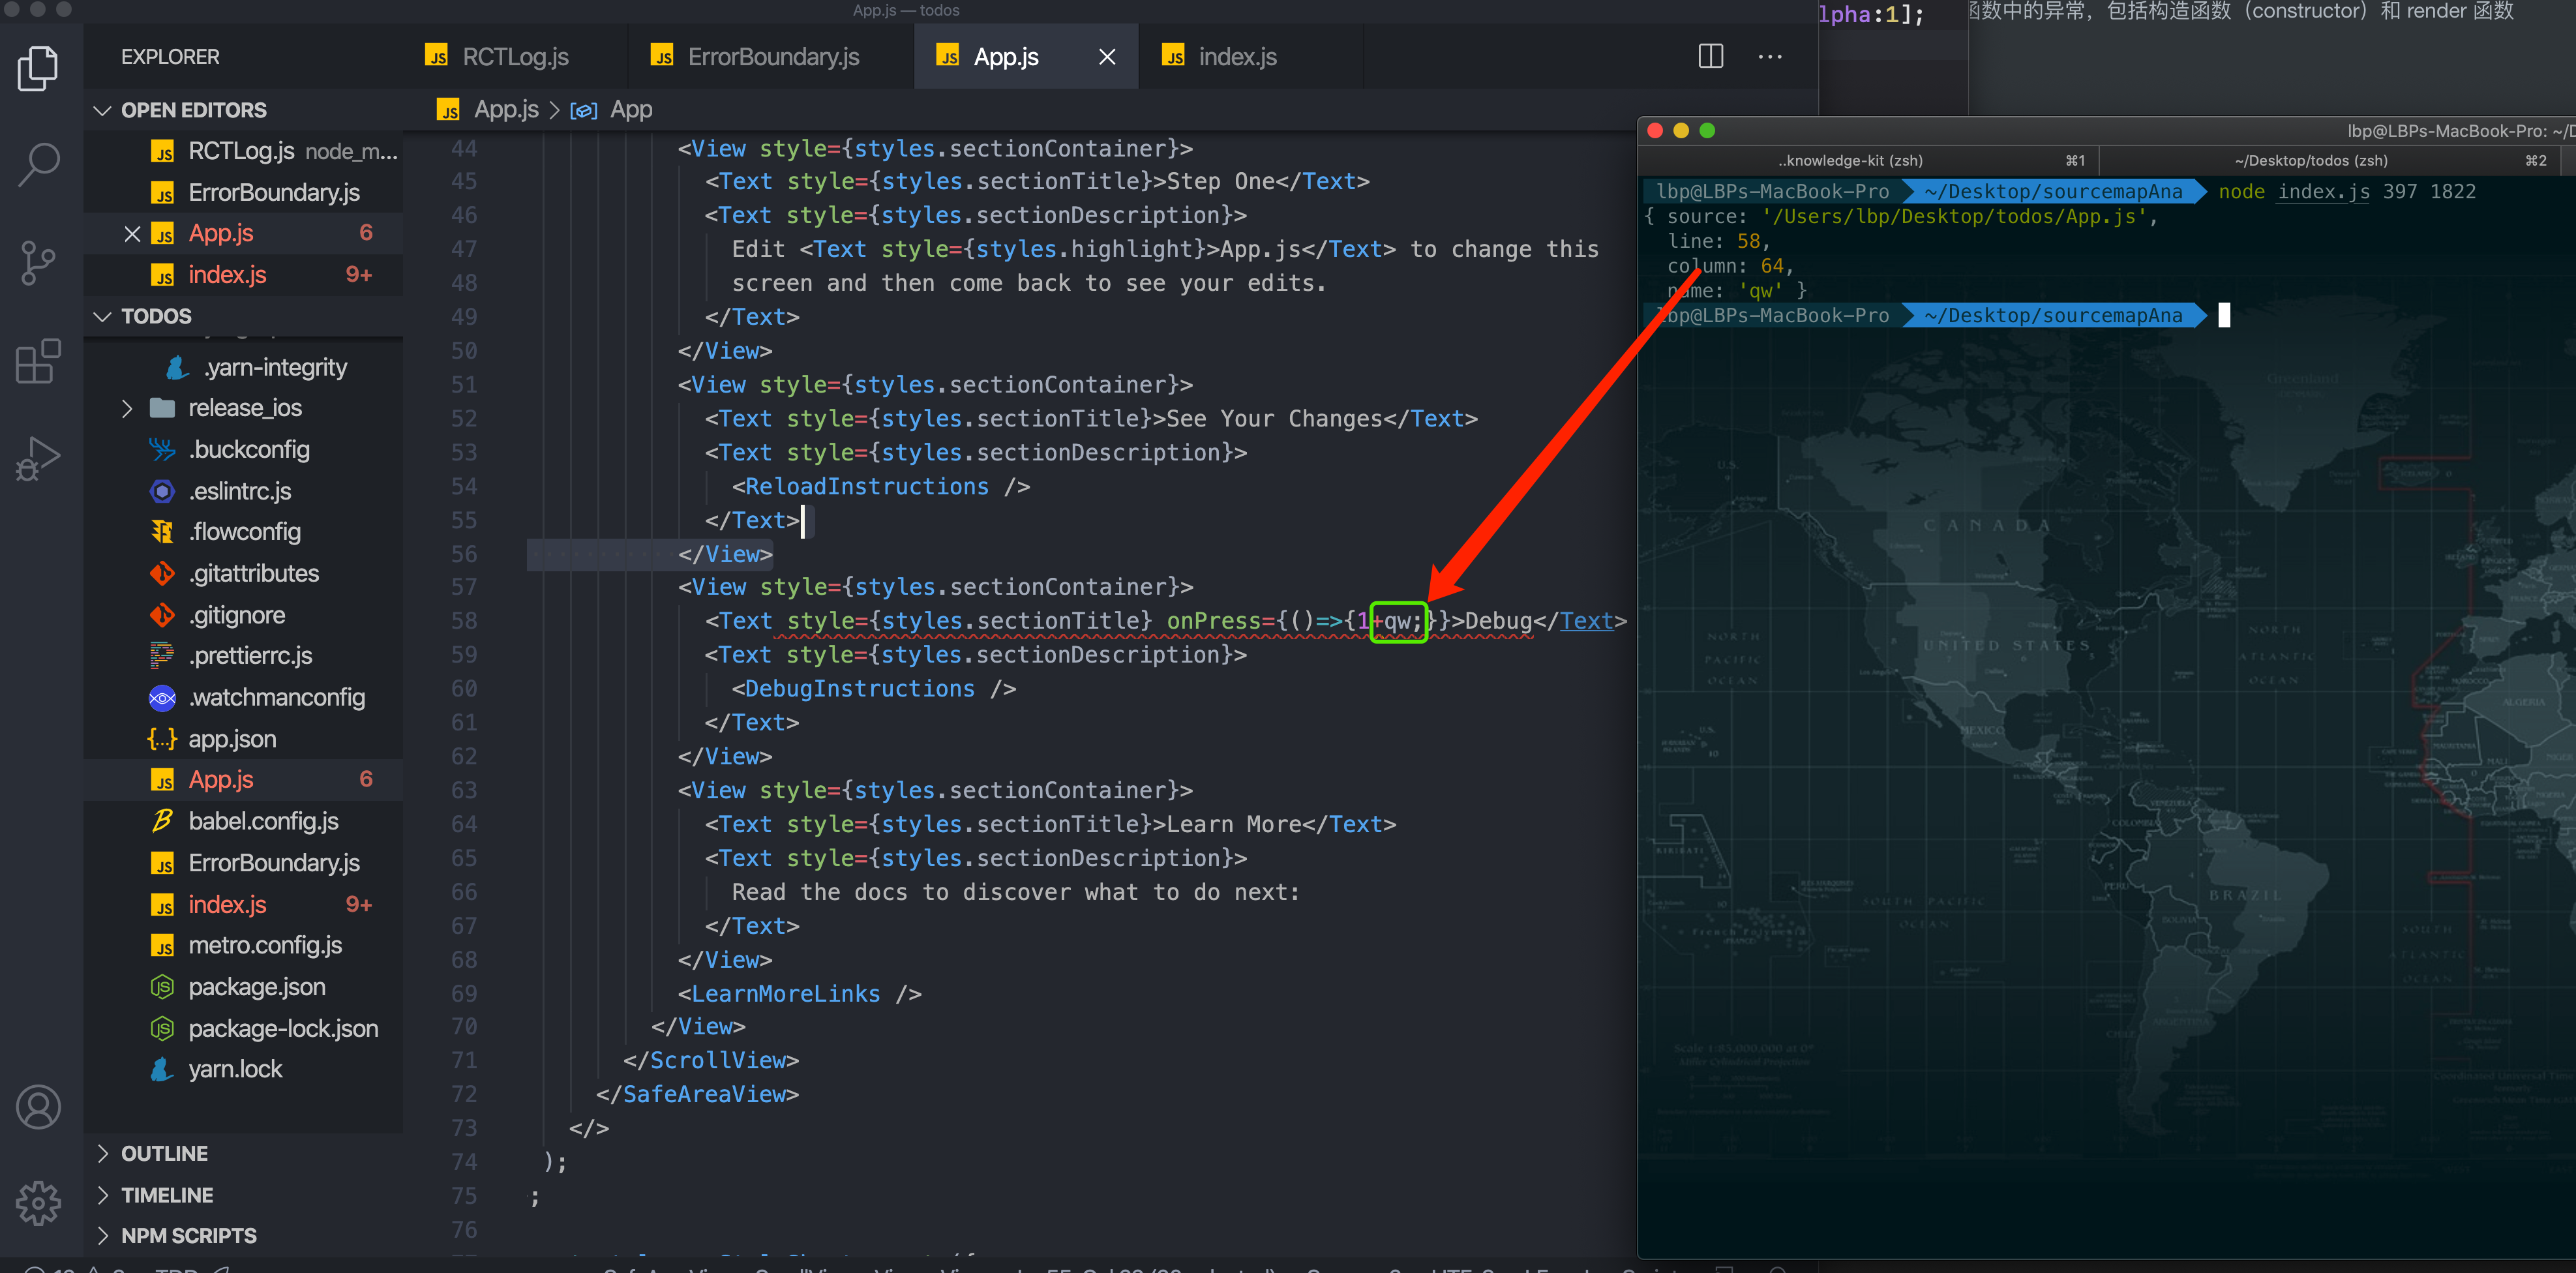
2.7.5 design of sourcemap analysis system
Objective: through the platform, the on-line crash of RN project can be restored to specific files, code lines and code columns. You can see the specific code, the RN stack trace, and the source file download function.
-
Servers managed under the packaging system:
- Generate source map file only after packaging in production environment
- Store all files before packaging (install)
- Develop product side RN analysis interface. Click the collected RN crash, and you can see the specific files, code lines and code columns on the details page. You can see the specific code, RN stack trace and Native stack trace. (the specific technical implementation has been mentioned above)
- Because the souce map file is large and the RN parsing is too long, although it is not long, it is a consumption of computing resources, so it is necessary to design an efficient reading mode
- SourceMap is different in iOS and Android modes, so SoureceMap storage needs to distinguish os.
3. Use and packaging of kscrash
Then it encapsulates its own Crash processing logic. For example, what we should do is:
- Inherit from the abstract class KSCrashInstallation, set the initialization work (for example, NSURLProtocol must be used after inheritance), and implement the sink method in the abstract class.
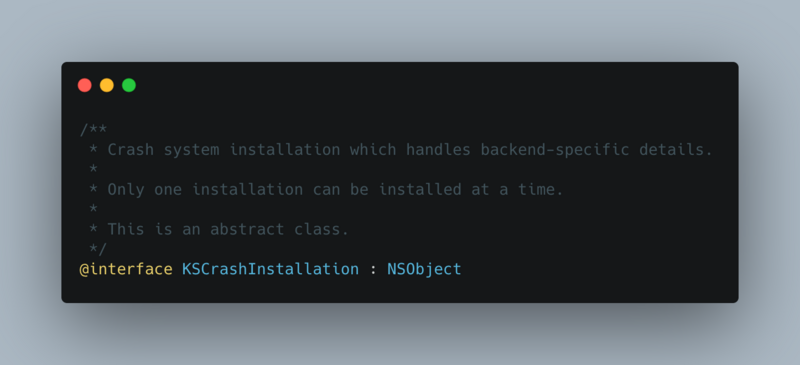
-
The CMCrashReporterSink class inside the sink method follows the KSCrashReportFilter protocol and declares the public method defaultcrashreportfilterseetapplefmt
The defaultCrashReportFilterSetAppleFmt method returns the result of a KSCrashReportFilterPipeline class method filterWithFilters.
CMCrashReportFilterAppleFmt is a class inherited from KSCrashReportFilterAppleFmt and follows the KSCrashReportFilter protocol. Protocol methods allow developers to handle Crash data formats.
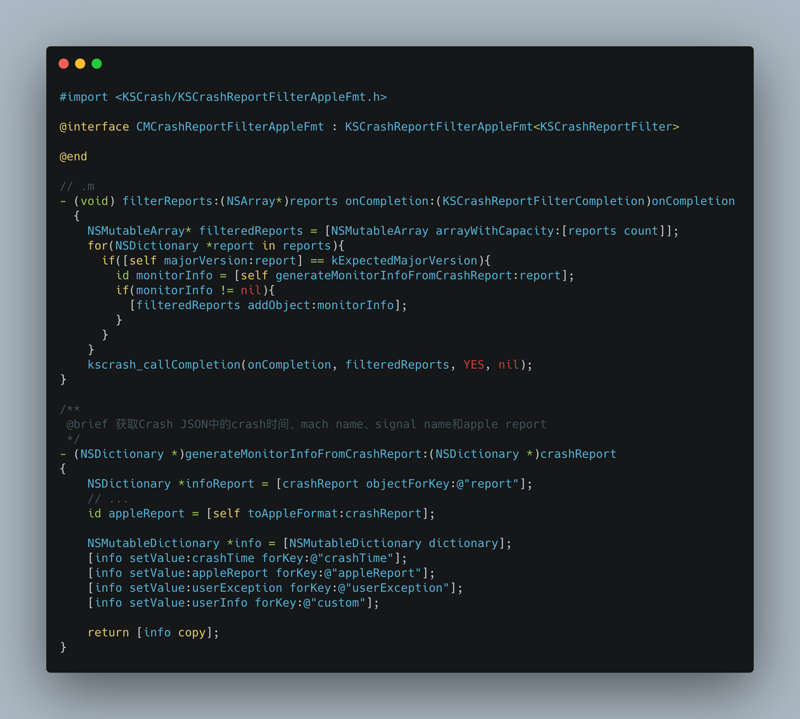
- An initiator is set for Crash module in APM capability. The initialization of KSCrash is set inside the initiator, and the assembly of data needed for monitoring when Crash is triggered. For example: session_ Basic information such as ID, App start time, App name, Crash time, App version number, current page information, etc.
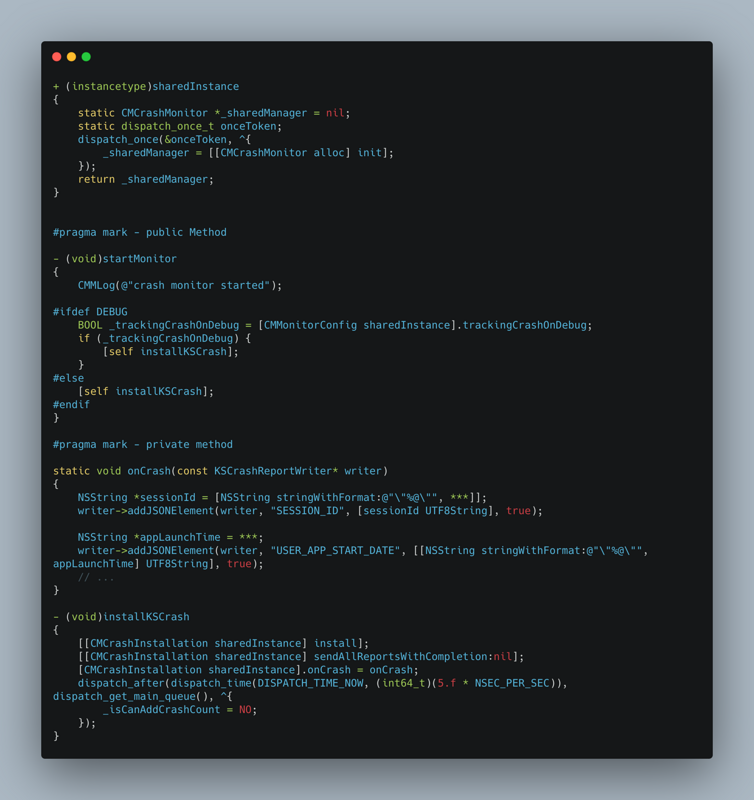
The [[CMCrashInstallation sharedInstance] sendAllReportsWithCompletion: nil] is invoked in the installKSCrash method, and the internal implementation is as follows
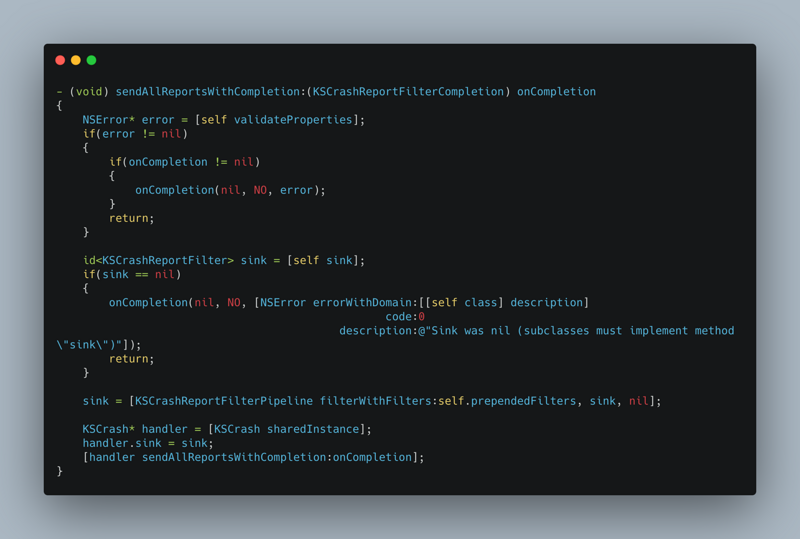
Method internally assigns the sink of KSCrashInstallation to the KSCrash object. Internally, the sendAllReportsWithCompletion method of KSCrash is also called. The implementation is as follows
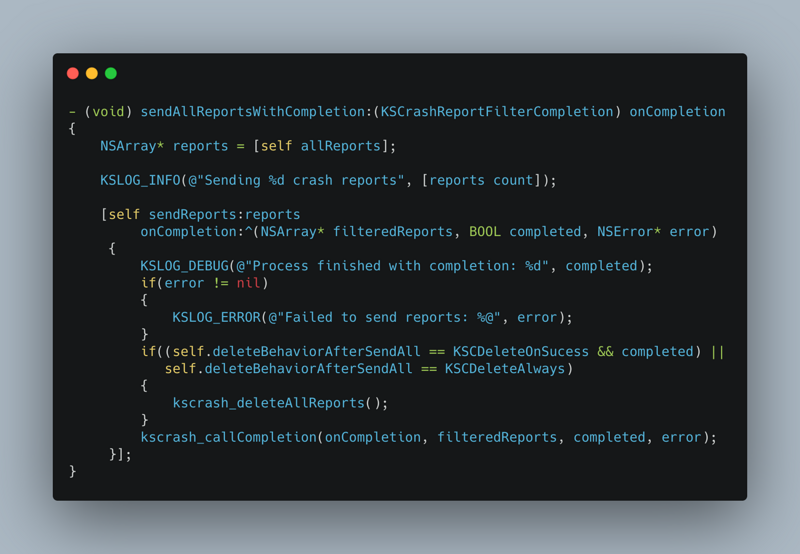
This method internally calls the object method sendReports: onCompletion:, as follows
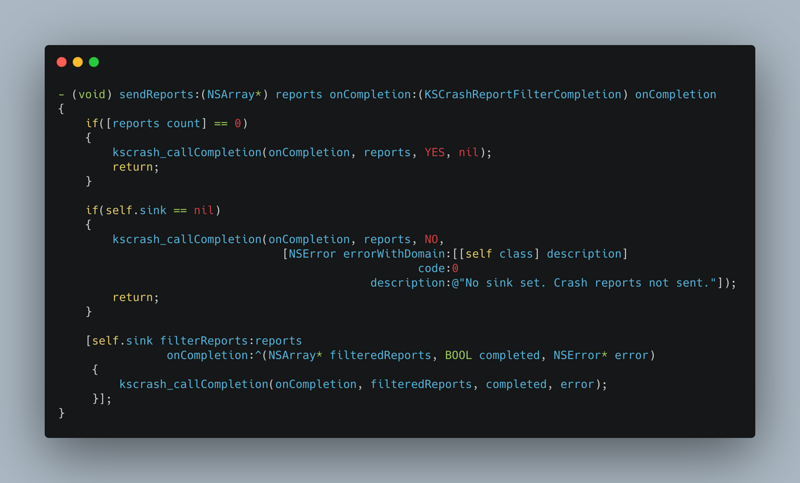
Method internal[ self.sink Filterreports: oncompletion:] the implementation is actually the sink getter method set in CMCrashInstallation, which internally returns the return value of the defaultCrashReportFilterSetAppleFmt method of the CMCrashReporterSink object. The internal implementation is as follows
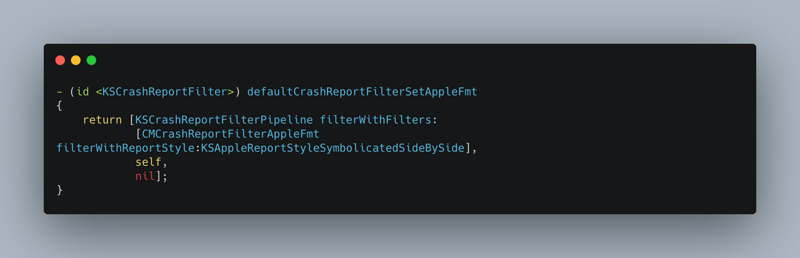
You can see that there are multiple filters set inside this function, one of which is self, that is, CMCrashReporterSink object, so the above[ self.sink Filterreports: oncompletion:], which is to call the data processing method in CMCrashReporterSink. After that, through KSCrash_ Call completion (oncompletion, reports, yes, Nil); tell KSCrash that the locally saved Crash logs have been processed and can be deleted.
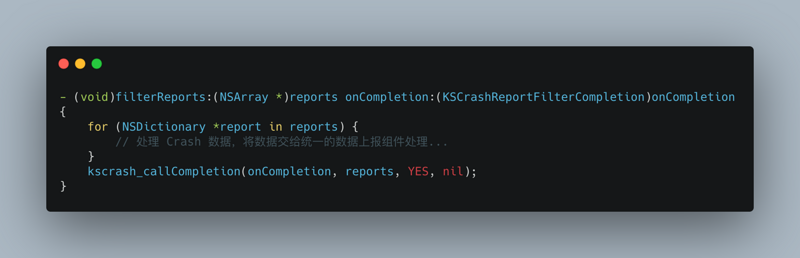
At this point, we will summarize what KSCrash does, and provide various crash monitoring capabilities. After crash, we will use c to efficiently convert process information, basic information, exception information, thread information, etc. into json file for writing. After the App starts next time, we will read the crash log in the local crash folder, so that developers can customize the key and value, and then report the log to APM System, and then delete the logs in the local crash folder.
4. Symbolization
After applying crash, the system will generate a crash log, which will be stored in the settings, and the running state, call stack, thread and other information of the application will be recorded in the log. However, these logs are addresses and unreadable, so symbolic restore is required.
4.1. Dsym document
The. dSYM (debugging symbol) file is a transit file to save the address mapping information of hexadecimal functions. Debugging information (symbols) is included in the file. The Xcode project generates a new. dSYM file every time it compiles and runs. By default. dSYM is not generated in debug mode. You can change the value DWARF to DWARF with dSYM File after build settings - > build options - > debug information format, so that the. dSYM file can be generated by compiling and running again.
So you need to save the. dSYM file of each version every time the App is packaged.
. dsym file contains dwarf information. Open the package content of the file Test.app.dSYM/Contents/Resources/DWARF/Test What you save is the dwarf file.
. dSYM file is a file directory obtained by extracting debugging information from Mach-O file. In order to be safe when publishing, debugging information will be stored in a separate file. dSYM is actually a file directory with the following structure:
4.2 DWARF document
DWARF is a debugging file format used by many compilers and debuggers to support source level debugging. It addresses the requirements of a number of procedural languages, such as C, C++, and Fortran, and is designed to be extensible to other languages. DWARF is architecture independent and applicable to any processor or operating system. It is widely used on Unix, Linux and other operating systems, as well as in stand-alone environments.
DWARF is a debugging file format, which is widely used by many compilers and debuggers to support source level debugging. It meets the needs of many process languages (C, C + +, Fortran) and is designed to support expansion to other languages. DWARF is architecturally independent and suitable for any other processor and operating system. It is widely used in Unix, Linux and other operating systems, as well as independent environment.
The full name of DWARF is debugging with array record formats, which is a debugging file using attribute record format.
DWARF is a compact representation of the relationship between executable and source code.
Most modern programming languages are block structures: each entity (a class, a function) is contained in another entity. A c program, each file may contain multiple data definitions, variables, and functions, so DWARF follows this model and is also a block structure. The basic description item in DWARF is the Debugging Information Entry. A DIE has a label that indicates what the DIE describes and a list of attributes (similar to html and xml structures) that fill in the details and further describe the item. A DIE (other than the top-level) is contained by a parent DIE. There may be a sibling DIE or a child DIE. Properties may contain various values: constants (such as a function name), variables (such as the starting address of a function), or references to another DIE (such as the return value type of a function).
The data in the DWARF file is as follows:
Data column Information description .debug_loc At DW_ AT_ List of locations used in the location property .debug_macinfo Macro information .debug_pubnames Lookup tables for global objects and functions .debug_pubtypes Lookup table of global type .debug_ranges At DW_ AT_ Address range used in the ranges property .debug_str In. Debug_ String table used in info .debug_types Type description Common tags and attributes are as follows:
Data column Information description DW_TAG_class_type Represents class name and type information DW_TAG_structure_type Represents structure name and type information DW_TAG_union_type Represents union name and type information DW_TAG_enumeration_type Represents enumeration name and type information DW_TAG_typedef Represents the name and type information of a typedef DW_TAG_array_type Represents array name and type information DW_TAG_subrange_type Represents the size information of an array DW_TAG_inheritance Represents inherited class name and type information DW_TAG_member Represents a member of a class DW_TAG_subprogram Represents the name information of a function DW_TAG_formal_parameter Parameter information of function DW_TAG_name Represents the name string DW_TAG_type Representation type information DW_TAG_artifical Set by compiler at creation time DW_TAG_sibling Indicates brother location information DW_TAG_data_memver_location Indicates location information DW_TAG_virtuality Set when virtual Take a simple look at a DWARF example: parse the DWARF file under the. dSYM folder of the test project with the following command
dwarfdump -F --debug-info Test.app.dSYM/Contents/Resources/DWARF/Test > debug-info.txtOpen as follows
Test.app.dSYM/Contents/Resources/DWARF/Test:    file format Mach-O arm64

.debug_info contents:
0x00000000: Compile Unit: length = 0x0000004f version = 0x0004 abbr_offset = 0x0000 addr_size = 0x08 (next unit at 0x00000053)

0x0000000b: DW_TAG_compile_unit
              DW_AT_producer [DW_FORM_strp]    ("Apple clang version 11.0.3 (clang-1103.0.32.62)")
              DW_AT_language [DW_FORM_data2]    (DW_LANG_ObjC)
              DW_AT_name [DW_FORM_strp]    ("_Builtin_stddef_max_align_t")
              DW_AT_stmt_list [DW_FORM_sec_offset]    (0x00000000)
              DW_AT_comp_dir [DW_FORM_strp]    ("/Users/lbp/Desktop/Test")
              DW_AT_APPLE_major_runtime_vers [DW_FORM_data1]    (0x02)
              DW_AT_GNU_dwo_id [DW_FORM_data8]    (0x392b5344d415340c)

0x00000027:   DW_TAG_module
                DW_AT_name [DW_FORM_strp]    ("_Builtin_stddef_max_align_t")
                DW_AT_LLVM_config_macros [DW_FORM_strp]    ("\"-DDEBUG=1\" \"-DOBJC_OLD_DISPATCH_PROTOTYPES=1\"")
                DW_AT_LLVM_include_path [DW_FORM_strp]    ("/Applications/Xcode.app/Contents/Developer/Toolchains/XcodeDefault.xctoolchain/usr/lib/clang/11.0.3/include")
                DW_AT_LLVM_isysroot [DW_FORM_strp]    ("/Applications/Xcode.app/Contents/Developer/Platforms/iPhoneOS.platform/Developer/SDKs/iPhoneOS13.5.sdk")

0x00000038:     DW_TAG_typedef
                  DW_AT_type [DW_FORM_ref4]    (0x0000004b "long double")
                  DW_AT_name [DW_FORM_strp]    ("max_align_t")
                  DW_AT_decl_file [DW_FORM_data1]    ("/Applications/Xcode.app/Contents/Developer/Toolchains/XcodeDefault.xctoolchain/usr/lib/clang/11.0.3/include/__stddef_max_align_t.h")
                  DW_AT_decl_line [DW_FORM_data1]    (16)

0x00000043:     DW_TAG_imported_declaration
                  DW_AT_decl_file [DW_FORM_data1]    ("/Applications/Xcode.app/Contents/Developer/Toolchains/XcodeDefault.xctoolchain/usr/lib/clang/11.0.3/include/__stddef_max_align_t.h")
                  DW_AT_decl_line [DW_FORM_data1]    (27)
                  DW_AT_import [DW_FORM_ref_addr]    (0x0000000000000027)

0x0000004a:     NULL

0x0000004b:   DW_TAG_base_type
                DW_AT_name [DW_FORM_strp]    ("long double")
                DW_AT_encoding [DW_FORM_data1]    (DW_ATE_float)
                DW_AT_byte_size [DW_FORM_data1]    (0x08)

0x00000052:   NULL
0x00000053: Compile Unit: length = 0x000183dc version = 0x0004 abbr_offset = 0x0000 addr_size = 0x08 (next unit at 0x00018433)

0x0000005e: DW_TAG_compile_unit
              DW_AT_producer [DW_FORM_strp]    ("Apple clang version 11.0.3 (clang-1103.0.32.62)")
              DW_AT_language [DW_FORM_data2]    (DW_LANG_ObjC)
              DW_AT_name [DW_FORM_strp]    ("Darwin")
              DW_AT_stmt_list [DW_FORM_sec_offset]    (0x000000a7)
              DW_AT_comp_dir [DW_FORM_strp]    ("/Users/lbp/Desktop/Test")
              DW_AT_APPLE_major_runtime_vers [DW_FORM_data1]    (0x02)
              DW_AT_GNU_dwo_id [DW_FORM_data8]    (0xa4a1d339379e18a5)

0x0000007a:   DW_TAG_module
                DW_AT_name [DW_FORM_strp]    ("Darwin")
                DW_AT_LLVM_config_macros [DW_FORM_strp]    ("\"-DDEBUG=1\" \"-DOBJC_OLD_DISPATCH_PROTOTYPES=1\"")
                DW_AT_LLVM_include_path [DW_FORM_strp]    ("/Applications/Xcode.app/Contents/Developer/Platforms/iPhoneOS.platform/Developer/SDKs/iPhoneOS13.5.sdk/usr/include")
                DW_AT_LLVM_isysroot [DW_FORM_strp]    ("/Applications/Xcode.app/Contents/Developer/Platforms/iPhoneOS.platform/Developer/SDKs/iPhoneOS13.5.sdk")

0x0000008b:     DW_TAG_module
                  DW_AT_name [DW_FORM_strp]    ("C")
                  DW_AT_LLVM_config_macros [DW_FORM_strp]    ("\"-DDEBUG=1\" \"-DOBJC_OLD_DISPATCH_PROTOTYPES=1\"")
                  DW_AT_LLVM_include_path [DW_FORM_strp]    ("/Applications/Xcode.app/Contents/Developer/Platforms/iPhoneOS.platform/Developer/SDKs/iPhoneOS13.5.sdk/usr/include")
                  DW_AT_LLVM_isysroot [DW_FORM_strp]    ("/Applications/Xcode.app/Contents/Developer/Platforms/iPhoneOS.platform/Developer/SDKs/iPhoneOS13.5.sdk")

0x0000009c:       DW_TAG_module
                    DW_AT_name [DW_FORM_strp]    ("fenv")
                    DW_AT_LLVM_config_macros [DW_FORM_strp]    ("\"-DDEBUG=1\" \"-DOBJC_OLD_DISPATCH_PROTOTYPES=1\"")
                    DW_AT_LLVM_include_path [DW_FORM_strp]    ("/Applications/Xcode.app/Contents/Developer/Platforms/iPhoneOS.platform/Developer/SDKs/iPhoneOS13.5.sdk/usr/include")
                    DW_AT_LLVM_isysroot [DW_FORM_strp]    ("/Applications/Xcode.app/Contents/Developer/Platforms/iPhoneOS.platform/Developer/SDKs/iPhoneOS13.5.sdk")

0x000000ad:         DW_TAG_enumeration_type
                      DW_AT_type [DW_FORM_ref4]    (0x00017276 "unsigned int")
                      DW_AT_byte_size [DW_FORM_data1]    (0x04)
                      DW_AT_decl_file [DW_FORM_data1]    ("/Applications/Xcode.app/Contents/Developer/Platforms/iPhoneOS.platform/Developer/SDKs/iPhoneOS13.5.sdk/usr/include/fenv.h")
                      DW_AT_decl_line [DW_FORM_data1]    (154)

0x000000b5:           DW_TAG_enumerator
                        DW_AT_name [DW_FORM_strp]    ("__fpcr_trap_invalid")
                        DW_AT_const_value [DW_FORM_udata]    (256)

0x000000bc:           DW_TAG_enumerator
                        DW_AT_name [DW_FORM_strp]    ("__fpcr_trap_divbyzero")
                        DW_AT_const_value [DW_FORM_udata]    (512)

0x000000c3:           DW_TAG_enumerator
                        DW_AT_name [DW_FORM_strp]    ("__fpcr_trap_overflow")
                        DW_AT_const_value [DW_FORM_udata]    (1024)

0x000000ca:           DW_TAG_enumerator
                        DW_AT_name [DW_FORM_strp]    ("__fpcr_trap_underflow")
// ......
0x000466ee:   DW_TAG_subprogram
                DW_AT_name [DW_FORM_strp]    ("CFBridgingRetain")
                DW_AT_decl_file [DW_FORM_data1]    ("/Applications/Xcode.app/Contents/Developer/Platforms/iPhoneOS.platform/Developer/SDKs/iPhoneOS13.5.sdk/System/Library/Frameworks/Foundation.framework/Headers/NSObject.h")
                DW_AT_decl_line [DW_FORM_data1]    (105)
                DW_AT_prototyped [DW_FORM_flag_present]    (true)
                DW_AT_type [DW_FORM_ref_addr]    (0x0000000000019155 "CFTypeRef")
                DW_AT_inline [DW_FORM_data1]    (DW_INL_inlined)

0x000466fa:     DW_TAG_formal_parameter
                  DW_AT_name [DW_FORM_strp]    ("X")
                  DW_AT_decl_file [DW_FORM_data1]    ("/Applications/Xcode.app/Contents/Developer/Platforms/iPhoneOS.platform/Developer/SDKs/iPhoneOS13.5.sdk/System/Library/Frameworks/Foundation.framework/Headers/NSObject.h")
                  DW_AT_decl_line [DW_FORM_data1]    (105)
                  DW_AT_type [DW_FORM_ref4]    (0x00046706 "id")

0x00046705:     NULL

0x00046706:   DW_TAG_typedef
                DW_AT_type [DW_FORM_ref4]    (0x00046711 "objc_object*")
                DW_AT_name [DW_FORM_strp]    ("id")
                DW_AT_decl_file [DW_FORM_data1]    ("/Users/lbp/Desktop/Test/Test/NetworkAPM/NSURLResponse+cm_FetchStatusLineFromCFNetwork.m")
                DW_AT_decl_line [DW_FORM_data1]    (44)

0x00046711:   DW_TAG_pointer_type
                DW_AT_type [DW_FORM_ref4]    (0x00046716 "objc_object")

0x00046716:   DW_TAG_structure_type
                DW_AT_name [DW_FORM_strp]    ("objc_object")
                DW_AT_byte_size [DW_FORM_data1]    (0x00)

0x0004671c:     DW_TAG_member
                  DW_AT_name [DW_FORM_strp]    ("isa")
                  DW_AT_type [DW_FORM_ref4]    (0x00046727 "objc_class*")
                  DW_AT_data_member_location [DW_FORM_data1]    (0x00)
// ......
Don't paste it all here (it's too long). You can see that the DIE contains the function start address, end address, function name, file name and the number of lines. For a given address, find the DIE containing the boycott between the function start address and end address, then you can restore the function name and file name information.
debug_line can restore information such as file lines
dwarfdump -F --debug-line Test.app.dSYM/Contents/Resources/DWARF/Test > debug-inline.txtPaste some information
Test.app.dSYM/Contents/Resources/DWARF/Test:    file format Mach-O arm64

.debug_line contents:
debug_line[0x00000000]
Line table prologue:
    total_length: 0x000000a3
         version: 4
 prologue_length: 0x0000009a
 min_inst_length: 1
max_ops_per_inst: 1
 default_is_stmt: 1
       line_base: -5
      line_range: 14
     opcode_base: 13
standard_opcode_lengths[DW_LNS_copy] = 0
standard_opcode_lengths[DW_LNS_advance_pc] = 1
standard_opcode_lengths[DW_LNS_advance_line] = 1
standard_opcode_lengths[DW_LNS_set_file] = 1
standard_opcode_lengths[DW_LNS_set_column] = 1
standard_opcode_lengths[DW_LNS_negate_stmt] = 0
standard_opcode_lengths[DW_LNS_set_basic_block] = 0
standard_opcode_lengths[DW_LNS_const_add_pc] = 0
standard_opcode_lengths[DW_LNS_fixed_advance_pc] = 1
standard_opcode_lengths[DW_LNS_set_prologue_end] = 0
standard_opcode_lengths[DW_LNS_set_epilogue_begin] = 0
standard_opcode_lengths[DW_LNS_set_isa] = 1
include_directories[  1] = "/Applications/Xcode.app/Contents/Developer/Toolchains/XcodeDefault.xctoolchain/usr/lib/clang/11.0.3/include"
file_names[  1]:
           name: "__stddef_max_align_t.h"
      dir_index: 1
       mod_time: 0x00000000
         length: 0x00000000

Address            Line   Column File   ISA Discriminator Flags
------------------ ------ ------ ------ --- ------------- -------------
0x0000000000000000      1      0      1   0             0  is_stmt end_sequence
debug_line[0x000000a7]
Line table prologue:
    total_length: 0x0000230a
         version: 4
 prologue_length: 0x00002301
 min_inst_length: 1
max_ops_per_inst: 1
 default_is_stmt: 1
       line_base: -5
      line_range: 14
     opcode_base: 13
standard_opcode_lengths[DW_LNS_copy] = 0
standard_opcode_lengths[DW_LNS_advance_pc] = 1
standard_opcode_lengths[DW_LNS_advance_line] = 1
standard_opcode_lengths[DW_LNS_set_file] = 1
standard_opcode_lengths[DW_LNS_set_column] = 1
standard_opcode_lengths[DW_LNS_negate_stmt] = 0
standard_opcode_lengths[DW_LNS_set_basic_block] = 0
standard_opcode_lengths[DW_LNS_const_add_pc] = 0
standard_opcode_lengths[DW_LNS_fixed_advance_pc] = 1
standard_opcode_lengths[DW_LNS_set_prologue_end] = 0
standard_opcode_lengths[DW_LNS_set_epilogue_begin] = 0
standard_opcode_lengths[DW_LNS_set_isa] = 1
include_directories[  1] = "/Applications/Xcode.app/Contents/Developer/Platforms/iPhoneOS.platform/Developer/SDKs/iPhoneOS13.5.sdk/usr/include"
include_directories[  2] = "/Applications/Xcode.app/Contents/Developer/Toolchains/XcodeDefault.xctoolchain/usr/lib/clang/11.0.3/include"
include_directories[  3] = "/Applications/Xcode.app/Contents/Developer/Platforms/iPhoneOS.platform/Developer/SDKs/iPhoneOS13.5.sdk/usr/include/sys"
include_directories[  4] = "/Applications/Xcode.app/Contents/Developer/Platforms/iPhoneOS.platform/Developer/SDKs/iPhoneOS13.5.sdk/usr/include/mach"
include_directories[  5] = "/Applications/Xcode.app/Contents/Developer/Platforms/iPhoneOS.platform/Developer/SDKs/iPhoneOS13.5.sdk/usr/include/libkern"
include_directories[  6] = "/Applications/Xcode.app/Contents/Developer/Platforms/iPhoneOS.platform/Developer/SDKs/iPhoneOS13.5.sdk/usr/include/architecture"
include_directories[  7] = "/Applications/Xcode.app/Contents/Developer/Platforms/iPhoneOS.platform/Developer/SDKs/iPhoneOS13.5.sdk/usr/include/sys/_types"
include_directories[  8] = "/Applications/Xcode.app/Contents/Developer/Platforms/iPhoneOS.platform/Developer/SDKs/iPhoneOS13.5.sdk/usr/include/_types"
include_directories[  9] = "/Applications/Xcode.app/Contents/Developer/Platforms/iPhoneOS.platform/Developer/SDKs/iPhoneOS13.5.sdk/usr/include/arm"
include_directories[ 10] = "/Applications/Xcode.app/Contents/Developer/Platforms/iPhoneOS.platform/Developer/SDKs/iPhoneOS13.5.sdk/usr/include/sys/_pthread"
include_directories[ 11] = "/Applications/Xcode.app/Contents/Developer/Platforms/iPhoneOS.platform/Developer/SDKs/iPhoneOS13.5.sdk/usr/include/mach/arm"
include_directories[ 12] = "/Applications/Xcode.app/Contents/Developer/Platforms/iPhoneOS.platform/Developer/SDKs/iPhoneOS13.5.sdk/usr/include/libkern/arm"
include_directories[ 13] = "/Applications/Xcode.app/Contents/Developer/Platforms/iPhoneOS.platform/Developer/SDKs/iPhoneOS13.5.sdk/usr/include/uuid"
include_directories[ 14] = "/Applications/Xcode.app/Contents/Developer/Platforms/iPhoneOS.platform/Developer/SDKs/iPhoneOS13.5.sdk/usr/include/netinet"
include_directories[ 15] = "/Applications/Xcode.app/Contents/Developer/Platforms/iPhoneOS.platform/Developer/SDKs/iPhoneOS13.5.sdk/usr/include/netinet6"
include_directories[ 16] = "/Applications/Xcode.app/Contents/Developer/Platforms/iPhoneOS.platform/Developer/SDKs/iPhoneOS13.5.sdk/usr/include/net"
include_directories[ 17] = "/Applications/Xcode.app/Contents/Developer/Platforms/iPhoneOS.platform/Developer/SDKs/iPhoneOS13.5.sdk/usr/include/pthread"
include_directories[ 18] = "/Applications/Xcode.app/Contents/Developer/Platforms/iPhoneOS.platform/Developer/SDKs/iPhoneOS13.5.sdk/usr/include/mach_debug"
include_directories[ 19] = "/Applications/Xcode.app/Contents/Developer/Platforms/iPhoneOS.platform/Developer/SDKs/iPhoneOS13.5.sdk/usr/include/os"
include_directories[ 20] = "/Applications/Xcode.app/Contents/Developer/Platforms/iPhoneOS.platform/Developer/SDKs/iPhoneOS13.5.sdk/usr/include/malloc"
include_directories[ 21] = "/Applications/Xcode.app/Contents/Developer/Platforms/iPhoneOS.platform/Developer/SDKs/iPhoneOS13.5.sdk/usr/include/bsm"
include_directories[ 22] = "/Applications/Xcode.app/Contents/Developer/Platforms/iPhoneOS.platform/Developer/SDKs/iPhoneOS13.5.sdk/usr/include/machine"
include_directories[ 23] = "/Applications/Xcode.app/Contents/Developer/Platforms/iPhoneOS.platform/Developer/SDKs/iPhoneOS13.5.sdk/usr/include/mach/machine"
include_directories[ 24] = "/Applications/Xcode.app/Contents/Developer/Platforms/iPhoneOS.platform/Developer/SDKs/iPhoneOS13.5.sdk/usr/include/secure"
include_directories[ 25] = "/Applications/Xcode.app/Contents/Developer/Platforms/iPhoneOS.platform/Developer/SDKs/iPhoneOS13.5.sdk/usr/include/xlocale"
include_directories[ 26] = "/Applications/Xcode.app/Contents/Developer/Platforms/iPhoneOS.platform/Developer/SDKs/iPhoneOS13.5.sdk/usr/include/arpa"
file_names[  1]:
           name: "fenv.h"
      dir_index: 1
       mod_time: 0x00000000
         length: 0x00000000
file_names[  2]:
           name: "stdatomic.h"
      dir_index: 2
       mod_time: 0x00000000
         length: 0x00000000
file_names[  3]:
           name: "wait.h"
      dir_index: 3
       mod_time: 0x00000000
         length: 0x00000000
// ......
Address            Line   Column File   ISA Discriminator Flags
------------------ ------ ------ ------ --- ------------- -------------
0x000000010000b588     14      0      2   0             0  is_stmt
0x000000010000b5b4     16      5      2   0             0  is_stmt prologue_end
0x000000010000b5d0     17     11      2   0             0  is_stmt
0x000000010000b5d4      0      0      2   0             0
0x000000010000b5d8     17      5      2   0             0
0x000000010000b5dc     17     11      2   0             0
0x000000010000b5e8     18      1      2   0             0  is_stmt
0x000000010000b608     20      0      2   0             0  is_stmt
0x000000010000b61c     22      5      2   0             0  is_stmt prologue_end
0x000000010000b628     23      5      2   0             0  is_stmt
0x000000010000b644     24      1      2   0             0  is_stmt
0x000000010000b650     15      0      1   0             0  is_stmt
0x000000010000b65c     15     41      1   0             0  is_stmt prologue_end
0x000000010000b66c     11      0      2   0             0  is_stmt
0x000000010000b680     11     17      2   0             0  is_stmt prologue_end
0x000000010000b6a4     11     17      2   0             0  is_stmt end_sequence
debug_line[0x0000def9]
Line table prologue:
    total_length: 0x0000015a
         version: 4
 prologue_length: 0x000000eb
 min_inst_length: 1
max_ops_per_inst: 1
 default_is_stmt: 1
       line_base: -5
      line_range: 14
     opcode_base: 13
standard_opcode_lengths[DW_LNS_copy] = 0
standard_opcode_lengths[DW_LNS_advance_pc] = 1
standard_opcode_lengths[DW_LNS_advance_line] = 1
standard_opcode_lengths[DW_LNS_set_file] = 1
standard_opcode_lengths[DW_LNS_set_column] = 1
standard_opcode_lengths[DW_LNS_negate_stmt] = 0
standard_opcode_lengths[DW_LNS_set_basic_block] = 0
standard_opcode_lengths[DW_LNS_const_add_pc] = 0
standard_opcode_lengths[DW_LNS_fixed_advance_pc] = 1
standard_opcode_lengths[DW_LNS_set_prologue_end] = 0
standard_opcode_lengths[DW_LNS_set_epilogue_begin] = 0
standard_opcode_lengths[DW_LNS_set_isa] = 1
include_directories[  1] = "Test"
include_directories[  2] = "Test/NetworkAPM"
include_directories[  3] = "/Applications/Xcode.app/Contents/Developer/Platforms/iPhoneOS.platform/Developer/SDKs/iPhoneOS13.5.sdk/usr/include/objc"
file_names[  1]:
           name: "AppDelegate.h"
      dir_index: 1
       mod_time: 0x00000000
         length: 0x00000000
file_names[  2]:
           name: "JMWebResourceURLProtocol.h"
      dir_index: 2
       mod_time: 0x00000000
         length: 0x00000000
file_names[  3]:
           name: "AppDelegate.m"
      dir_index: 1
       mod_time: 0x00000000
         length: 0x00000000
file_names[  4]:
           name: "objc.h"
      dir_index: 3
       mod_time: 0x00000000
         length: 0x00000000
// ......
You can see debug_line contains the number of lines corresponding to each code address. The AppDelegate section is posted on it.
4.3 symbols
In the link, we call function and variable as Symbol. Function name or variable name is Symbol Name. We can regard Symbol as adhesive in the link. The whole link process can be completed correctly based on Symbol.
The above text comes from "self cultivation of programmers". So symbols are the general names of functions, variables and classes.
According to types, symbols can be divided into three categories:
- Global symbol: the symbol visible outside the target file, which can be referenced by other target files or needs to be defined by other target files
- Local symbols: symbols visible only in the target file, which refer to functions and variables visible only in the target file
- Debugging symbol: includes the debugging symbol information of line number information, which records the file and file line number corresponding to the function and variable.
Symbol Table: a mapping table of memory address and function name, file name, line number. Each defined symbol has a corresponding value, which is called Symbol Value. For variables and functions, the Symbol Value is the address. The Symbol Table is composed as follows
< start address > < end address > < function > [< filename: line number >]
4.4 how to get the address?
When image is loaded, the relative base address will be relocated, and the base address of each load is different. The address of function stack frame is the absolute address after relocation, and what we want is the relative address before relocation.
Binary Images
Take the crash log of the test project as an example, and open the Binary Images section
// ...
Binary Images:
0x102fe0000 - 0x102ff3fff Test arm64  <37eaa57df2523d95969e47a9a1d69ce5> /var/containers/Bundle/Application/643F0DFE-A710-4136-A278-A89D780B7208/Test.app/Test
0x1030e0000 - 0x1030ebfff libobjc-trampolines.dylib arm64  <181f3aa866d93165ac54344385ac6e1d> /usr/lib/libobjc-trampolines.dylib
0x103204000 - 0x103267fff dyld arm64  <6f1c86b640a3352a8529bca213946dd5> /usr/lib/dyld
0x189a78000 - 0x189a8efff libsystem_trace.dylib arm64  <b7477df8f6ab3b2b9275ad23c6cc0b75> /usr/lib/system/libsystem_trace.dylib
// ...
You can see that the Binary Images of Crash log contain the load start address, end address, image name, arm schema, uuid, image path of each image.
Information in crash log
Last Exception Backtrace:
// ...
5   Test                              0x102fe592c -[ViewController testMonitorCrash] + 22828 (ViewController.mm:58)
Binary Images: 0x102fe0000 - 0x102ff3fff Test arm64 <37eaa57df2523d95969e47a9a1d69ce5> /var/containers/Bundle/Application/643F0DFE-A710-4136-A278-A89D780B7208/Test.app/TestSo the relative address of frame 5 is 0x102fe592c - 0x102fe0000. Use the command again to restore symbol information.
Use atos to resolve. 0x102fe0000 is the start address of image loading, and 0x102fe592c is the address of frame to be restored.
atos -o Test.app.dSYM/Contents/Resources/DWARF/Test-arch arm64 -l 0x102fe0000 0x102fe592c4.5 UUID
-
UUID of crash file
grep --after-context=2 "Binary Images:" *.crashTest 5-28-20, 7-47 PM.crash:Binary Images: Test 5-28-20, 7-47 PM.crash-0x102fe0000 - 0x102ff3fff Test arm64 <37eaa57df2523d95969e47a9a1d69ce5> /var/containers/Bundle/Application/643F0DFE-A710-4136-A278-A89D780B7208/Test.app/Test Test 5-28-20, 7-47 PM.crash-0x1030e0000 - 0x1030ebfff libobjc-trampolines.dylib arm64 <181f3aa866d93165ac54344385ac6e1d> /usr/lib/libobjc-trampolines.dylib -- Test.crash:Binary Images: Test.crash-0x102fe0000 - 0x102ff3fff Test arm64 <37eaa57df2523d95969e47a9a1d69ce5> /var/containers/Bundle/Application/643F0DFE-A710-4136-A278-A89D780B7208/Test.app/Test Test.crash-0x1030e0000 - 0x1030ebfff libobjc-trampolines.dylib arm64 <181f3aa866d93165ac54344385ac6e1d> /usr/lib/libobjc-trampolines.dylibThe UUID of Test App is 37eaa57df2523d95969e47a9a1d69ce5
-
UUID of. dSYM file
dwarfdump --uuid Test.app.dSYMThe result is
UUID: 37EAA57D-F252-3D95-969E-47A9A1D69CE5 (arm64) Test.app.dSYM/Contents/Resources/DWARF/Test -
UUID of app
dwarfdump --uuid Test.app/TestThe result is
UUID: 37EAA57D-F252-3D95-969E-47A9A1D69CE5 (arm64) Test.app/Test
4.6 symbolization (parsing Crash logs)
The above section analyzes how to capture various types of crash. In the hands of users, we can obtain the scene information of crash through technical means and report it with a certain mechanism. However, this stack is a hexadecimal address, which cannot locate the problem, so it needs to be coded.
It also says . dSYM file It can restore the file name, line and function name by combining the symbol address with the dSYM file. This process is called symbolization. However, the. dSYM file must strictly correspond to the bundle id and version of the crash log file.
To obtain the Crash log, you can select the corresponding device through Xcode - > window - > devices and simulators, find the Crash log file, and locate it according to the time and App name.
app and. dSYM files can be obtained through the packaged products. The path is ~ / Library/Developer/Xcode/Archives.
There are generally two analytical methods:
-
Using symbolic crash
Symbolic crash is a crash log analysis tool provided by Xcode. First, determine the path and execute the following command on the terminal
find /Applications/Xcode.app -name symbolicatecrash -type fSeveral paths will be returned to find iPhoneSimulator.platform In that line
/Applications/Xcode.app/Contents/Developer/Platforms/iPhoneSimulator.platform/Developer/Library/PrivateFrameworks/DVTFoundation.framework/symbolicatecrashCopy symbolic crash to the specified folder (the folder where app, dSYM and crash files are saved)
Execute command
./symbolicatecrash Test.crash Test.dSYM > Test.crashThe first time you do this, you should report an error: "developer_ Dir "is not defined at. / symbolic crash line 69., solution: execute the following command at the terminal
export DEVELOPER_DIR=/Applications/Xcode.app/Contents/Developer -
Using atos
Unlike symbolic ecrash, atos is more flexible, as long as. crash and. dSYM or. crash and. app files correspond.
The usage is as follows, - l followed by the symbolic address
xcrun atos -o Test.app.dSYM/Contents/Resources/DWARF/Test -arch armv7 -l 0x1023c592cYou can also parse the. app file (there is no. dSYM file), where xxx is the segment address and xx is the offset address
atos -arch architecture -o binary -l xxx xx
Because there may be many apps, each App may have different versions in the hands of users, so when tokenization is needed after APM interception, crash files and. dSYM files need to be one-to-one corresponding to each other in order to correctly tokenize. The corresponding principle is that UUID s are the same.
4.7 symbolic analysis of system library
Every time we connect to Xcode to run the program, we will be prompted to wait. In fact, in order to resolve the stack, the system will automatically import the current version of the system symbol library to / Users / your own user name / Library/Developer/Xcode/iOS DeviceSupport directory, where a large number of system library symbol files are installed. You can visit the following directory
/Users / your own user name / Library/Developer/Xcode/iOS DeviceSupport/
5. Server processing
5.1 ELK log system
The design of log monitoring system in the industry generally adopts ELK technology. ELK is the abbreviation of elastic search, logstash and kibana. Elastic search is a distributed platform framework of near real-time search which interacts through Restful mode. Logstash is a central data flow engine, which is used to collect data of different formats from different targets (file / datastore / MQ). After filtering, it supports output to different destinations (file / MQ/Redis/ElasticsSearch/Kafka). Kibana can display the data of elasticiserarch through friendly pages and provide visual analysis function. So ELK can build an efficient and enterprise level log analysis system.
In the early era of single application, almost all the functions of the application were running on one machine, and there was a problem. The operation and maintenance personnel opened the terminal to input the command to directly view the system log, and then located and solved the problem. With the function of the system becoming more and more complex and the user volume becoming larger and larger, the single application is almost difficult to meet the demand, so the technical architecture is iterative. The single application is divided into multiple applications through horizontal expansion to support a large number of users. Each application is deployed in a cluster way, with load balancing control and scheduling. If there is a problem in a certain sub module, go to find this service Is the terminal on the device looking for log analysis? Obviously, the platform is backward, so the log management platform came into being. Logstash is used to collect and analyze the log files of each server, which are then filtered according to the defined regular template and transferred to Kafka or Redis. Then another logstash reads the logs from Kafka or Redis and stores them in ES to create an index. Finally, Kibana is used for visual analysis. In addition, the collected data can be analyzed for further maintenance and decision-making.
The above figure shows the log architecture of ELK. Briefly:
- Before Logstash and ES, there was a Kafka layer. Because Logstash was set up on the data resource server to filter the collected data in real time, which consumed time and memory. Therefore, Kafka played a role of data buffer storage, because Kafka has a very colorful read-write performance.
- The next step is for Logstash to read data from Kafka, filter and process the data, and transfer the results to ES
- This design not only has good performance and low coupling, but also has expansibility. For example, it can be read and transmitted from n different Logstash to n Kafka, and then filtered by n Logstash. Log sources can be m, such as App log, Tomcat log, Nginx log, etc
Below is an "Elastic APM hands on combat" shared by the elastic search community theme Content screenshot of.
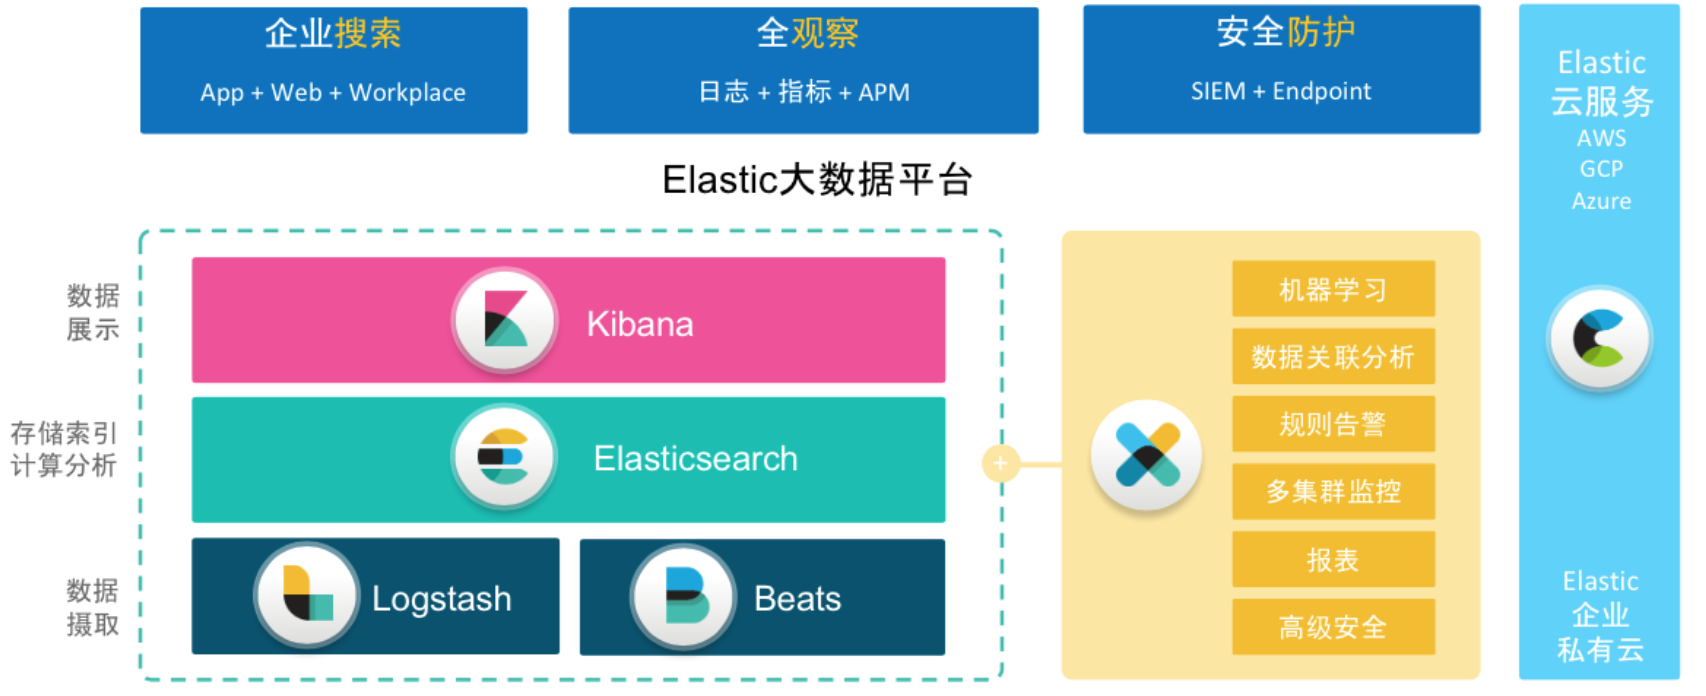
5.2 service side
When Crash log is put into Kibana in a unified way, it is not symbolic. Therefore, symbolic processing is needed to facilitate problem location, crash report generation and subsequent processing.
So the whole process is as follows: the client APM SDK collects crash log - > Kafka storage - > the MAC performs timing task symbolization - > the data is returned to Kafka - > the product side (display side) classifies, reports, alarms and other operations on the data.
Because the company has multiple product lines, multiple corresponding apps, and different versions of apps used by users, the crash log analysis must have correct. dSYM files, so automation becomes very important for different versions of many apps.
There are two ways to automate. For a smaller company or figure, you can add runScript code in Xcode to automatically upload dSYM in release mode).
Because our company has its own system, wax cli, which can manage the initialization, dependency management, construction (continuous integration, Unit Test, Lint, unified hop detection), test, packaging, deployment, dynamic capabilities (hot update, unified hop routing distribution) and other capabilities of iOS SDK, iOS App, Android SDK, Android App, Node, React, and React Native engineering projects at the same time. You can insert capabilities based on each stage, so you can upload. dSYM files to 7niu cloud storage in the packer after calling and packaging (the rules can be. dSYM files with AppName + Version as the key and value as the. dSYM file).
Nowadays, many architecture designs are microservices, but why microservices is not included in this paper. So the tokenization of crash log is designed as a microservice. The architecture is as follows
explain:
- As an integral part of the whole monitoring system Prism, symbolization service is a microservice focusing on the symbolization of crash report.
- Receive the request from the mass that contains the preprocessed crash report and dsym index, pull the corresponding dsym from the seven cows, perform symbolic analysis on the crash report, calculate the hash, and respond the hash to the mass.
- Receive the request from Prism management system, including the original crash report and dsym index, pull the corresponding dsym from seven cows, make symbolic analysis of crash report, and respond the symbolic crash report to Prism management system.
- Mass is a general data processing (flow / batch) and task scheduling framework
- Candle is a packaging system. The above-mentioned wax cli has the ability to package, which is actually the packaging and construction ability of the called candle system. According to the characteristics of the project, choose the appropriate packer (the packaging platform is to maintain multiple packaging tasks, different tasks are distributed to different packers according to the characteristics, the task details page can see the dependent download, compilation, operation process, etc., the packaged products include binary package, Download QR code, etc.)
Symbolic service is the product of large front-end team under the background of large front-end, so it is implemented by NodeJS. The symbolic machine of iOS is a dual core mac mini, which needs to be tested by experiments. In the end, several worker processes need to be started to provide symbolic services. The result is that two processes process crash log, which is nearly twice as efficient as single process, while four processes do not significantly improve the efficiency of two processes, which conforms to the characteristics of dual core mac mini. So start two worker processes for symbolic processing.
The following figure is the complete design drawing
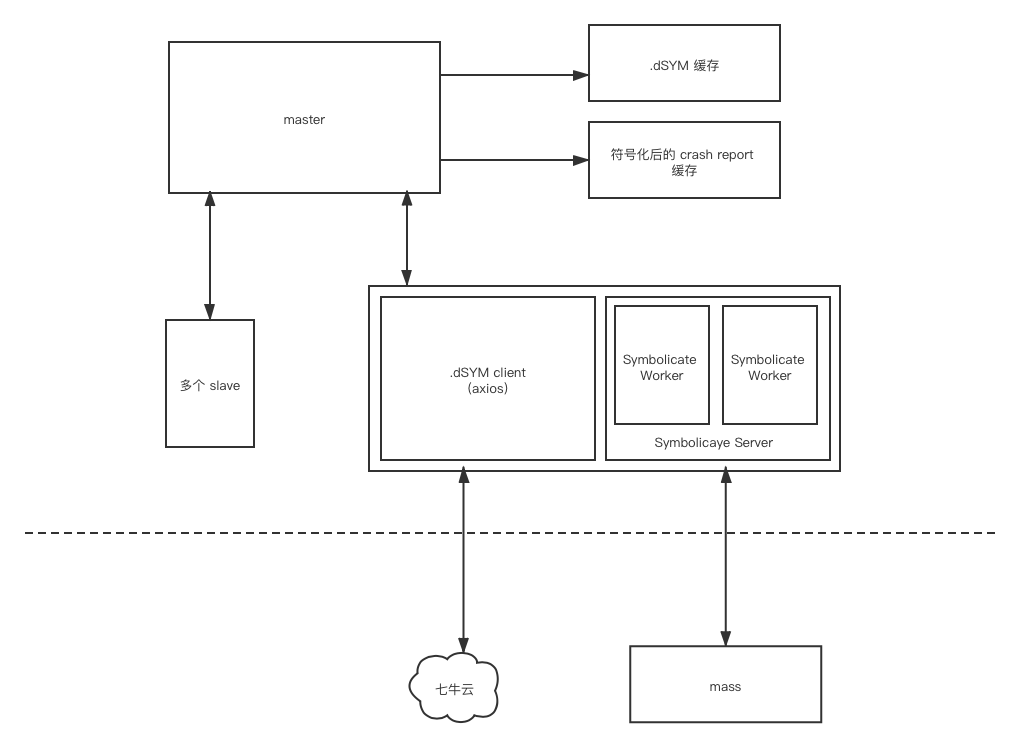
In brief, the symbolic process is a master-slave mode. One master machine, multiple slave machines and master machine read the cache of. dSYM and crash results. The mass scheduling symbolic service (two internal symbolic workers) obtains the. dSYM file from the qinniu cloud at the same time.
The system architecture is as follows
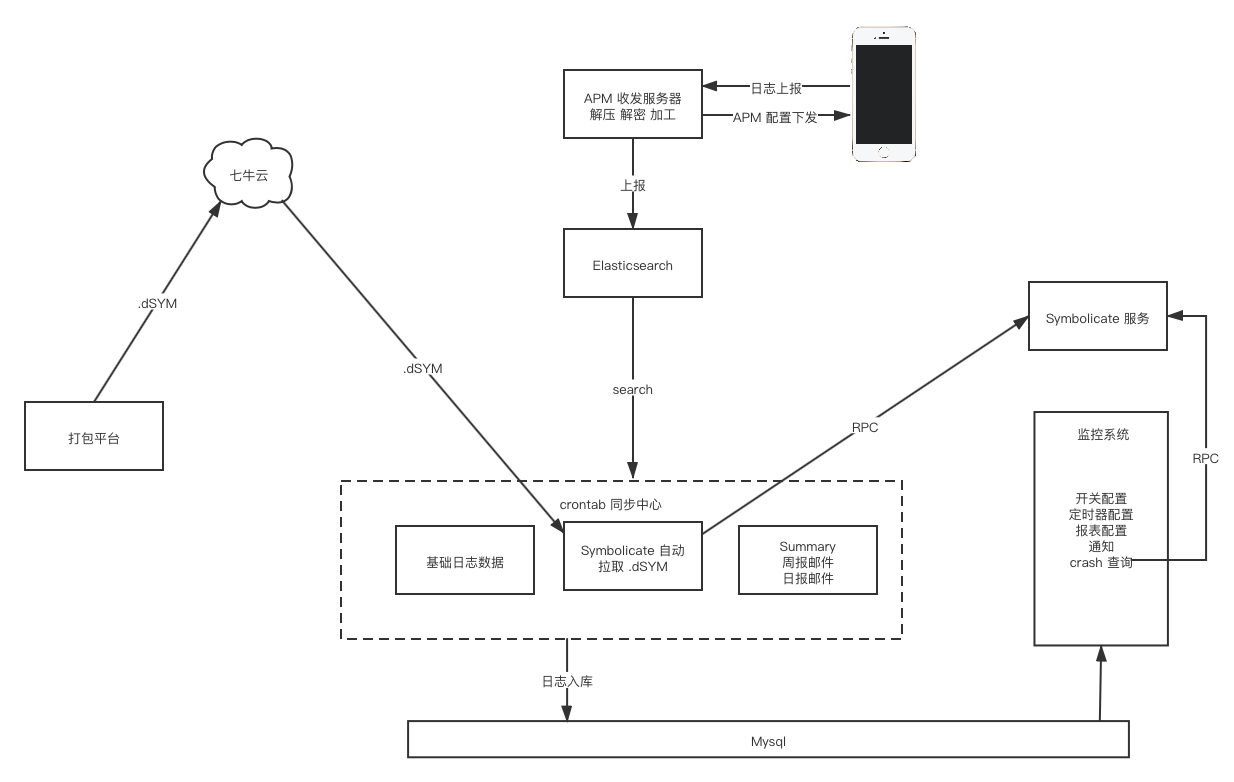
8, APM summary
- Generally speaking, the monitoring capability of each end is not very consistent, and the technical implementation details are not uniform. Therefore, it is necessary to align and unify the monitoring capability during the technical proposal review. The data fields of each capability at each end must be aligned (number of fields, name, data type and precision), because APM itself is a closed-loop. After monitoring, it needs symbolic analysis, data sorting, product development, and finally monitoring large display, etc
- Some crash or ANR will inform stakeholders by email, SMS and enterprise content communication tools according to their needs, and then release versions and hot fix quickly.
- Each monitoring capability needs to be configurable and can be opened and closed flexibly.
- Monitoring data needs to be written from memory to file, and attention should be paid to policies. Monitoring data need to store database, database size, design rules, etc. How to report after being stored in the database, and the reporting mechanism will be described in another article:Build a general and configurable data reporting SDK
- Try to write the technical realization of each end into the document after the technical review and give it to relevant personnel synchronously. For example, the implementation of ANR
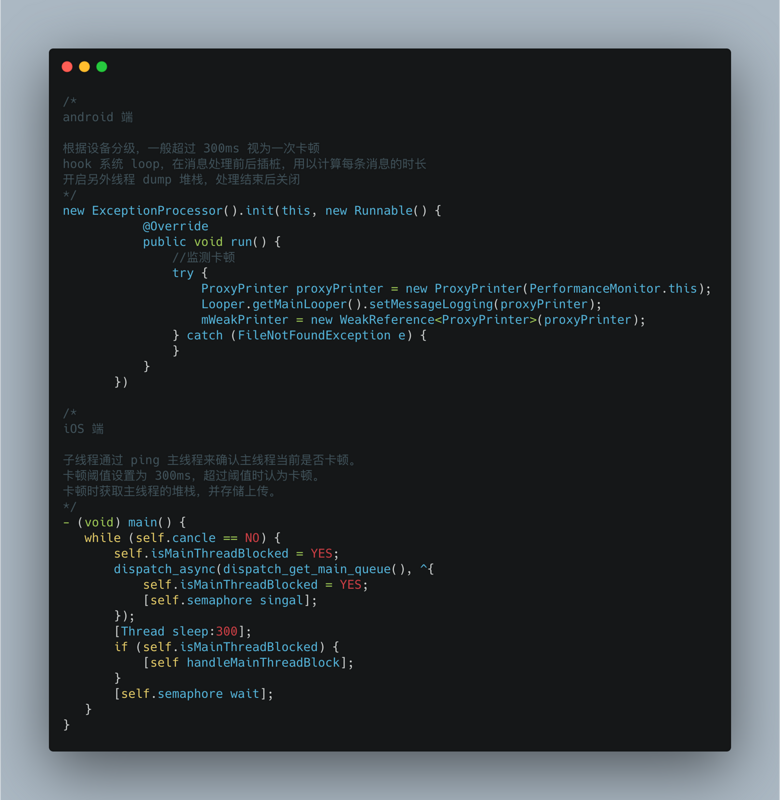
-
The architecture of the whole APM is as follows
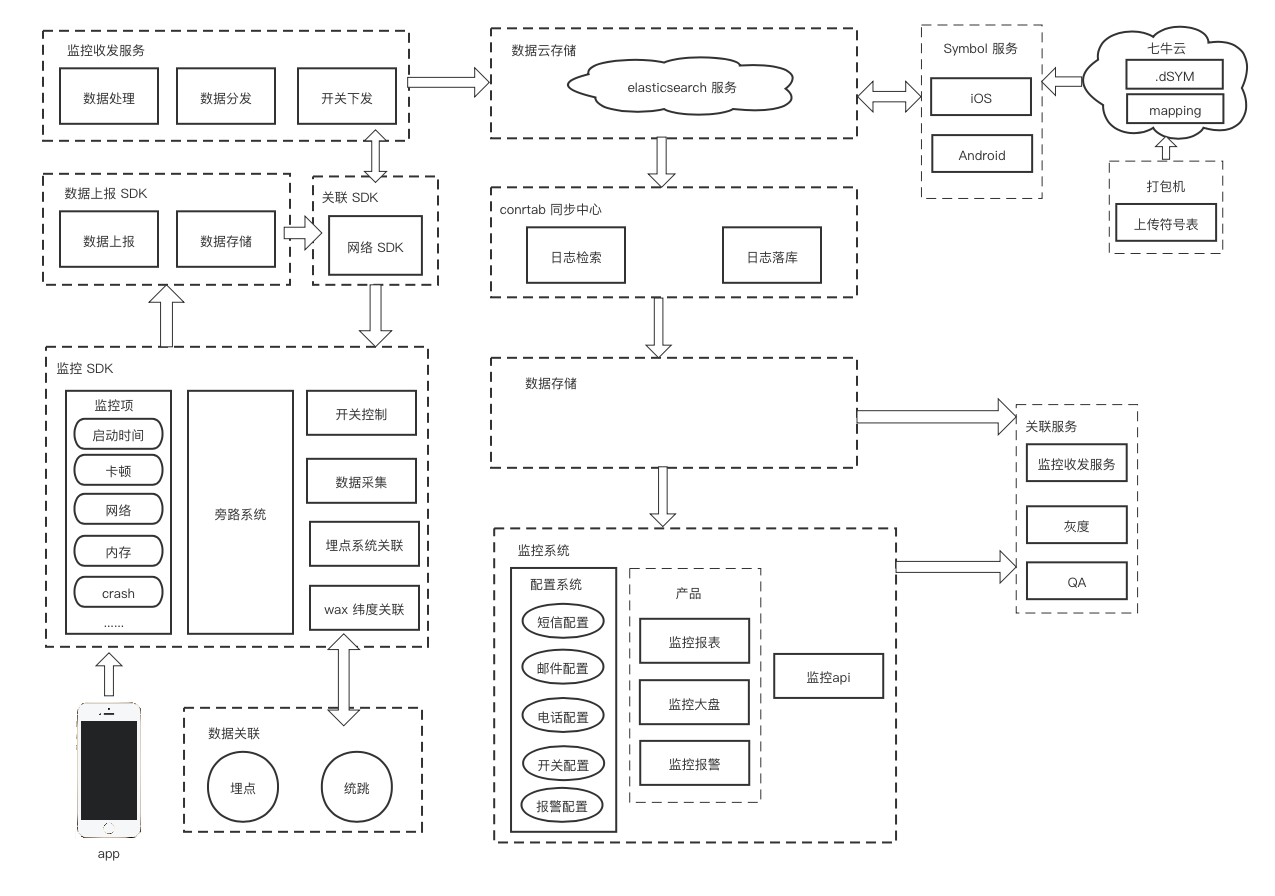
explain:
- Embed SDK, associate log data with sessionId
- Wax, as described above, is a multi terminal project management mode, and each wax project has basic information
- APM technology scheme itself is constantly adjusted and upgraded with the technical means and analysis requirements. The structure diagrams in the above figure are of earlier versions. At present, the upgrading and structure adjustment are carried out on this basis, and several keywords are proposed: Hermes, Flink SQL, and InfluxDB.
reference material
- iOS's skill of keeping the interface smooth
- Call Stack
- Personal understanding of call stack
- Getting the call stack of any thread
- iOS boot time optimization
- WWDC2019 start time and Dyld3
- Apple-libmalloc
- Apple-XNU
- OOM exploration: XNU memory state management
- Reducing FOOMs in the Facebook iOS app
- Research on the principle of iOS memory abort(Jetsam)
- iOS wechat memory monitoring
- iOS stack information resolution (function address and symbol Association)
- Apple-CFNetwork Programming Guide
- MDN-HTTP Messages
- DWARF and symbolization

