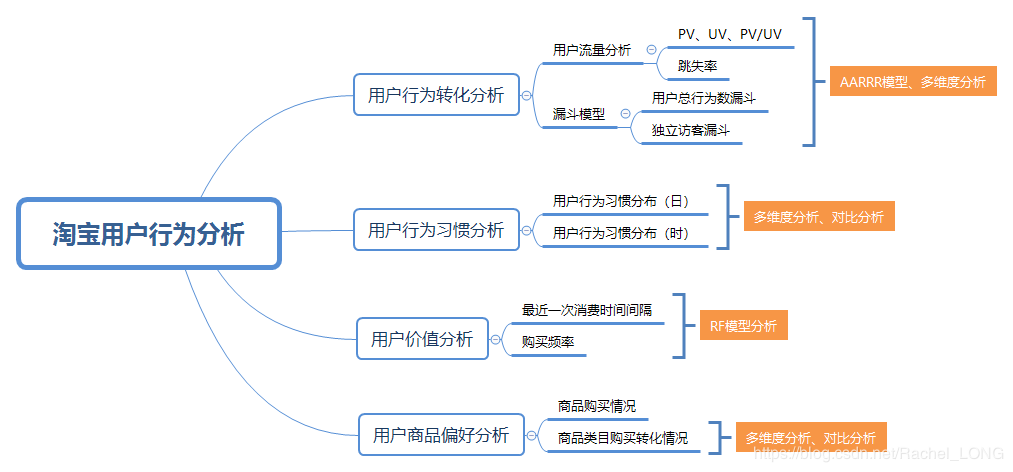
- Overall user shopping
What are pv (total visits), average daily visits, uv (total number of users), the number of users with purchase behavior, the shopping situation of users and the repurchase rate?
- User behavior transformation funnel
How about the conversion rate of click Add shopping cart purchase links? What is the abandonment rate of shopping carts and how to improve it?
-
Understand user behavior based on time dimension
-
User analysis based on RFM model
Data import
Using Navicat
New database
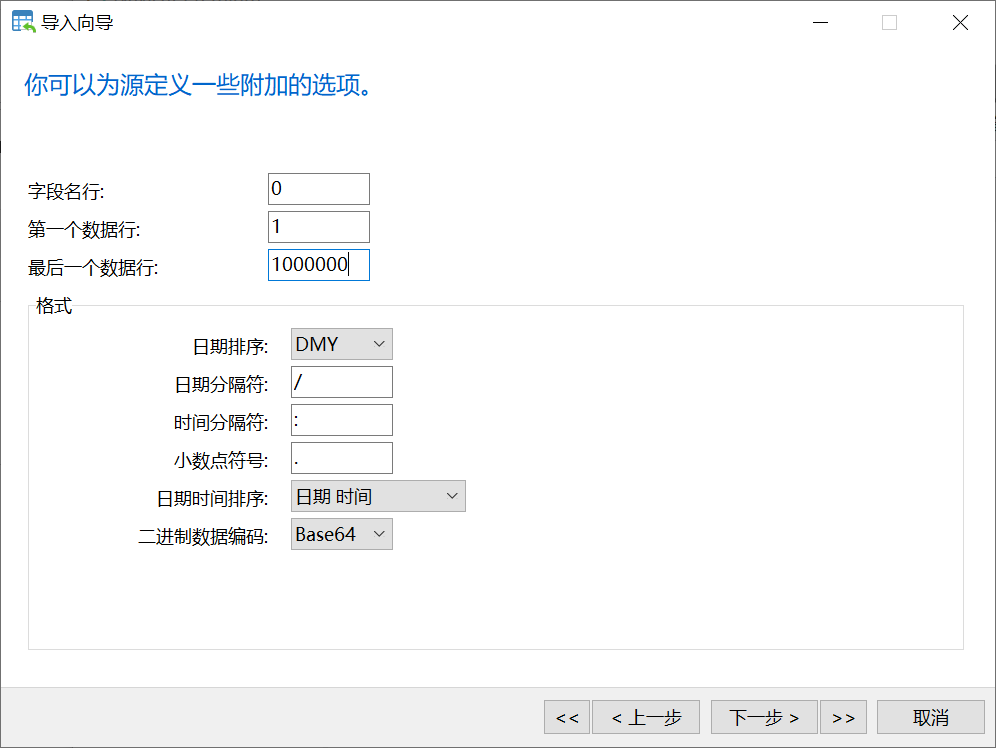
Run the Import Wizard
1000000 rows of data before import
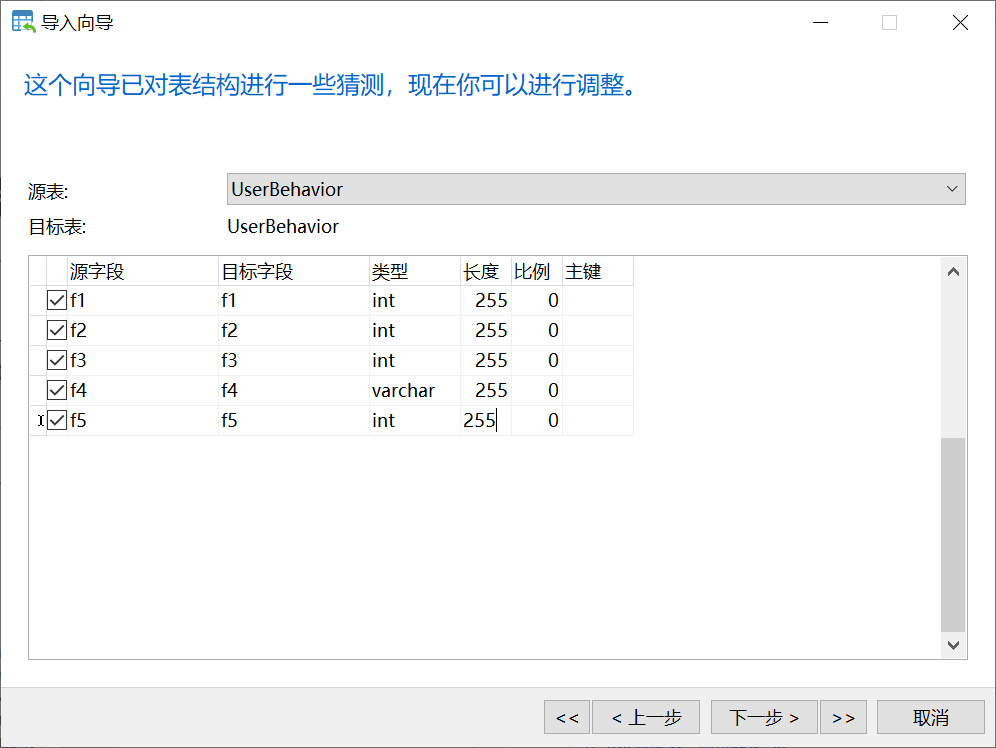
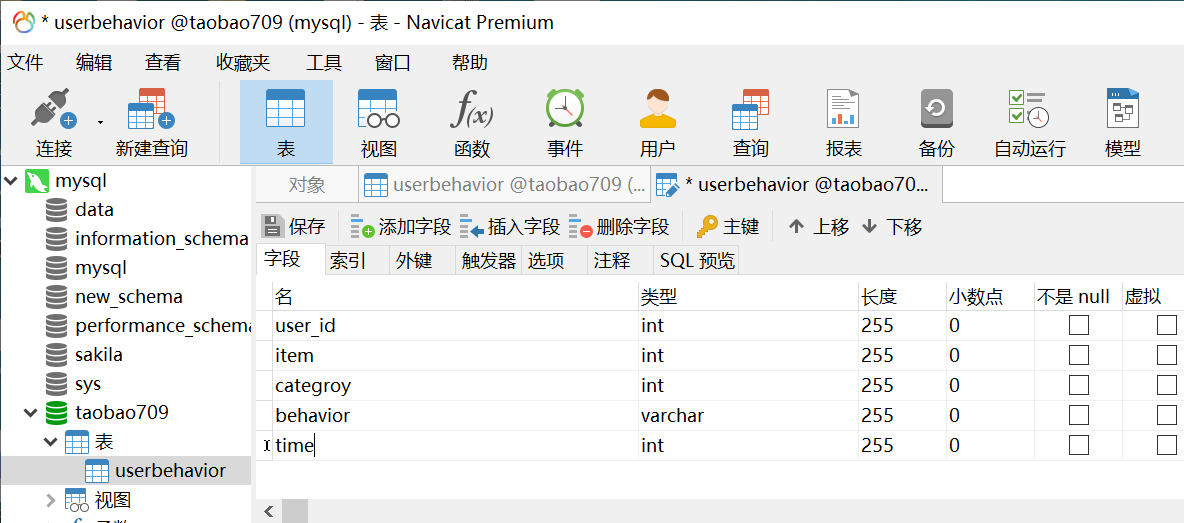
Modify field name

Data cleaning
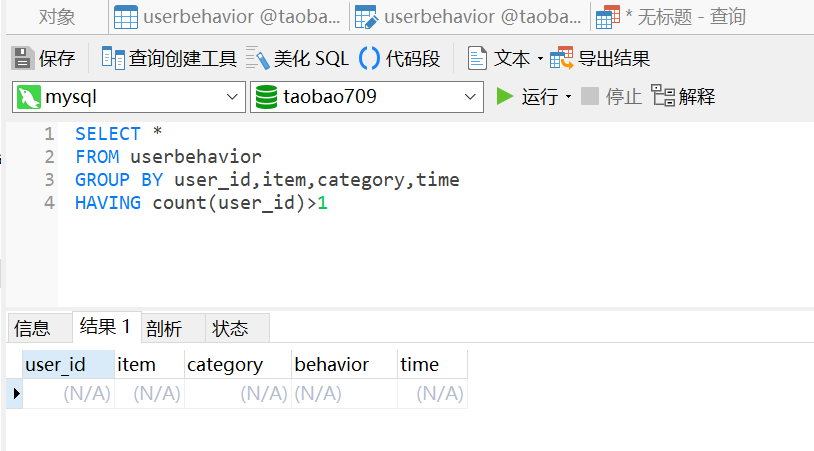
Delete duplicate values
SELECT *
FROM userbehavior
GROUP BY user_id,item,category,time
HAVING count(user_id)>1
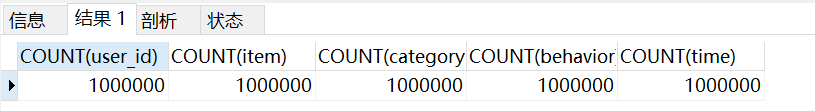
#Statistical missing value
SELECT COUNT(user_id),COUNT(item),COUNT(category),COUNT(behavior),COUNT(time)
FROM userbehavior
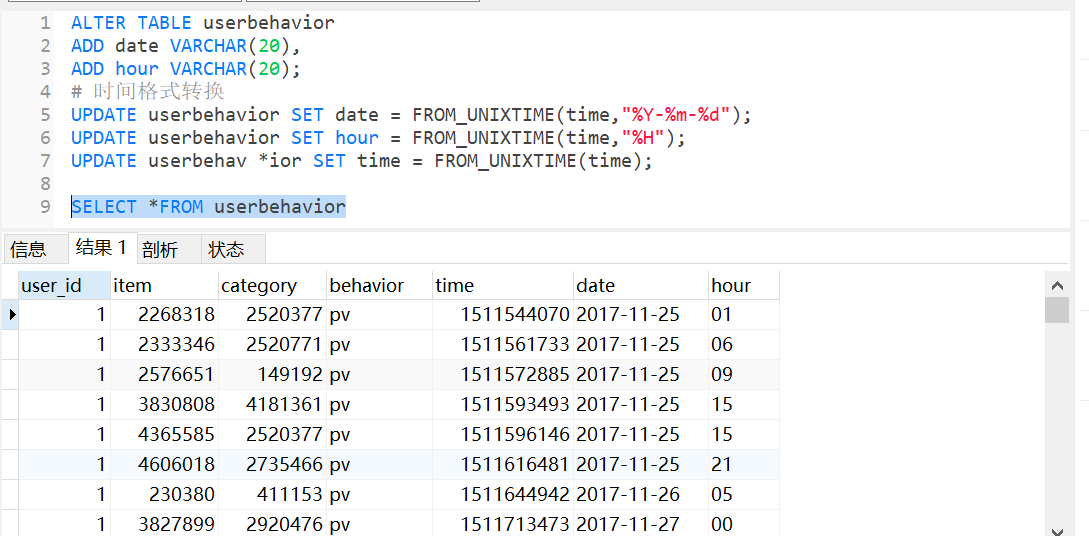
Time format conversion
Add data and hour time fields
Outlier handling
Check whether the date and time are within the specified range. November 25, 2017 to December 3, 2017.
SELECT
 MAX(Date),
 MIN(Date),
 MIN(hour),
 MAX(hour)
FROM
userbehavior;
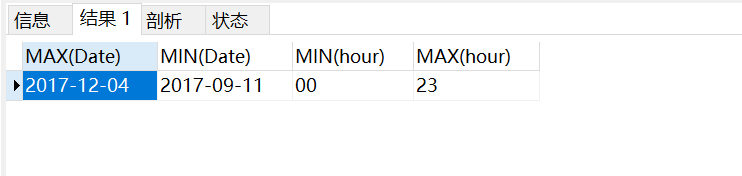
There are data not within the specified range in the discovery date
DELETE
FROM
userbehavior
WHERE
date < '2017-11-25' OR date > '2017-12-03';
Deletion of abnormal data: a total of 470 rows of data whose date is not within the specified range are found, and all these abnormal data have been deleted.
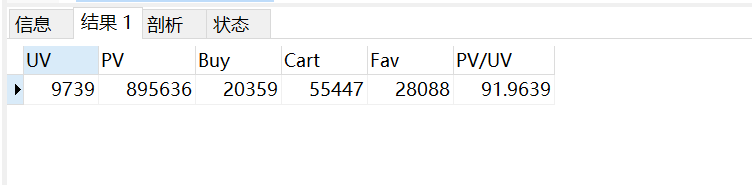
SELECT count(DISTINCT user_id) as UV,
	   sum(case when behavior='pv' then 1 else 0 end) as PV,
	   sum(case when behavior='buy' then 1 else 0 end) as Buy,
	   sum(case when behavior='cart' then 1 else 0 end) as Cart,
	   sum(case when behavior='fav' then 1 else 0 end) as Fav,
	   sum(case when behavior='pv' then 1 else 0 end)/count(DISTINCT user_id) as 'PV/UV'
FROM userbehavior;
Repurchase rate
Definition of repurchase rate: the proportion of repeat consumption users (users who consume twice or more) in the total consumption users within a certain time window (non de duplication by day)
# Repurchase rate
SELECT
sum(case when buy_amount>1 then 1 else 0 end) as "Total number of repurchase",
count(user_id) as "Total number of buyers",
sum(case when buy_amount>1 then 1 else 0 end)/count(user_id) as "Repurchase rate"
FROM
(SELECT *,count(behavior) as buy_amount
FROM userbehavior
WHERE behavior = 'buy'
GROUP BY user_id) a;

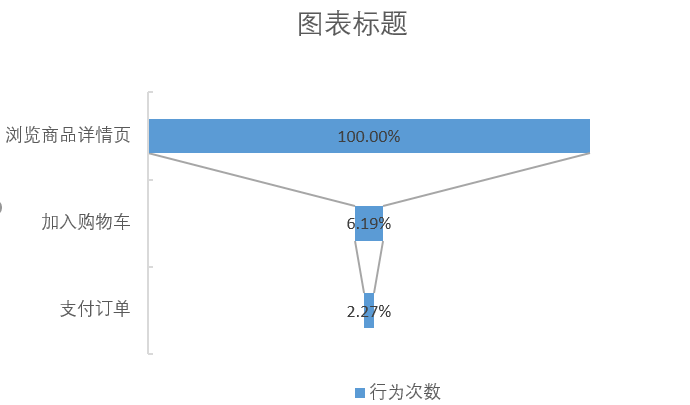
This data set only contains the data of product detail page (pv), add to shopping cart (CART) and pay order (buy). Therefore, the funnel model is simplified to: product detail page - add to shopping cart - pay order.
Transformation funnel of total user behavior (PV)
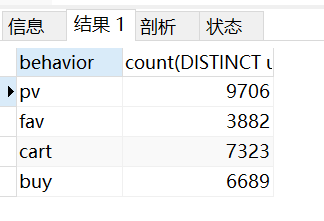
SELECT behavior,COUNT(*)
FROM userbehavior
GROUP BY behavior
order by behavior desc;
Conversion funnel for independent visitors (UV)
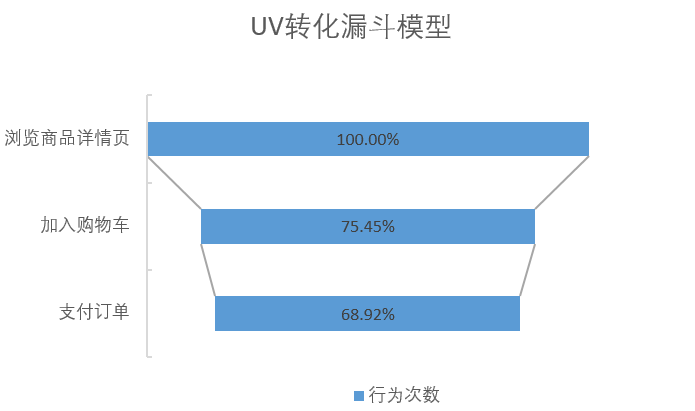
By combining the funnel chart of total user behavior transformation and the funnel chart of independent visitor transformation, it can be found that:
(1) The conversion rate from browsing the product details page PV to having purchase intention is only 6.19%, but the conversion rate from browsing the product details page UV to having purchase intention is 75.46%, which means that users will click the browse product details page (pv/buy=895636/20359=44 times) for comparison and screening before purchasing goods. This link is the key link of index improvement, and try to make accurate recommendations, Reduce the cost of users looking for information.
(2) The number of payment order users accounts for 68.92% of the number of users browsing the commodity details page, reflecting the high purchase conversion rate of Taobao APP users, that is, the commodities on Taobao APP can meet the purchase needs of most users.
Suggestions for improving conversion rate in the above links:
(1) Optimize the search matching degree and recommendation strategy of e-commerce platform, actively recommend relevant commodities according to user preferences, optimize the accuracy and aggregation ability of commodity search, and optimize the ranking priority of search results.
(2) Highlight the key information concerned by users on the display of product details page, simplify the presentation of information flow, and reduce the cost of users looking for information.
Analyze user behavior from time dimension
SELECT
	date,
	count(DISTINCT user_id) as 'Number of users per day',
	sum(case when behavior='pv' then 1 else 0 end) as 'Number of views',
	sum(case when behavior='cart' then 1 else 0 end) as 'Additional purchases',
	sum(case when behavior='fav' then 1 else 0 end) as 'Number of collections',
	sum(case when behavior='buy' then 1 else 0 end) as 'Number of purchases'
FROM userbehavior
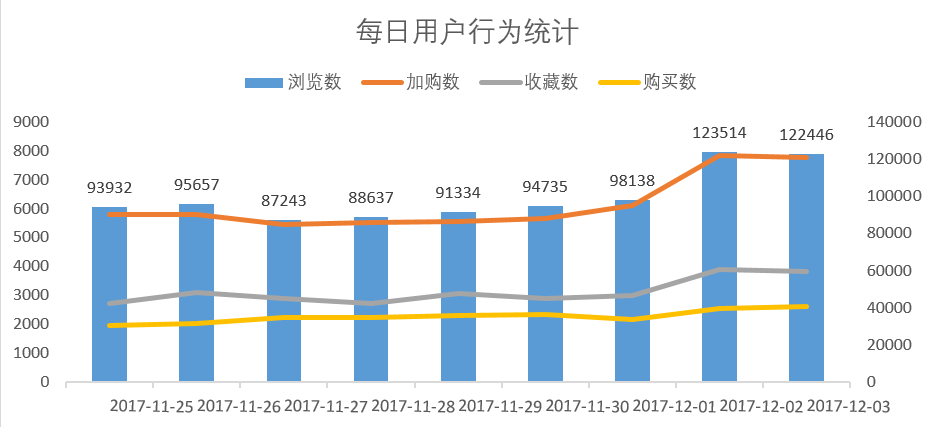
November 25-26 and December 2-3 are weekends. Through the daily user behavior data change curve, it can be analyzed that from November 25 to December 1, the data fluctuation range is very small. From December 2 to 3 (weekend), various data indicators rise significantly, higher than those in the previous 7 days. Since there was no significant increase in various data indicators over the last weekend (November 25-26), it is speculated that the increase in data indicators on December 2-3 may be related to Taobao's double 12 warm-up activities.
User behavior analysis at each time
SELECT
	hour,
	count(DISTINCT user_id) as 'Users per hour',
	sum(case when behavior='pv' then 1 else 0 end) as 'Number of views',
	sum(case when behavior='cart' then 1 else 0 end) as 'Additional purchases',
	sum(case when behavior='fav' then 1 else 0 end) as 'Number of collections',
	sum(case when behavior='buy' then 1 else 0 end) as 'Number of purchases'
FROM userbehavior
GROUP BY hour;
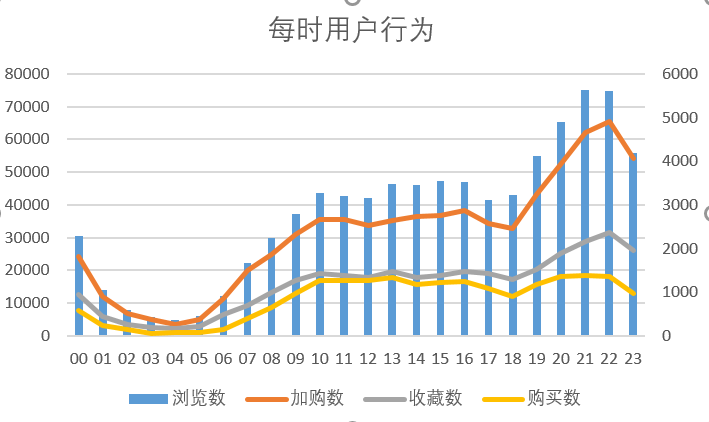
At about 2-5 a.m., various data indicators enter a trough period; Between 9 and 18 points, the data showed a small peak with little fluctuation; Between 20 and 23 o'clock, each data index presents a big peak, and reaches the maximum peak of daily data around 21 o'clock. The change trend of data is more in line with the work and rest law of normal users. When formulating the operation strategy, you can use this law to generate income, and choose to launch various interactive marketing means such as live broadcasting of online stores and live delivery in the most active time period of users every day.
Commodity ranking analysis
Top 10 commodity sales
SELECT item, count(behavior) as 'Number of purchases'
FROM userbehavior
WHERE behavior='buy'
GROUP BY item
ORDER BY count(behavior) DESC
limit 10;
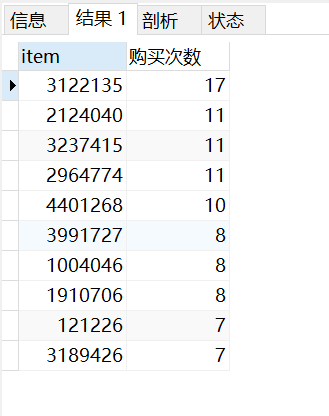
It can be found from the commodity sales ranking that among the 17565 commodities ordered, the sales volume of a single commodity does not exceed 17 times at most, and only 5 commodities have sold more than 10 times, reflecting that there are no hot commodities in the analysis data set.
Top 10 product views
Top 10 product views
SELECT item, count(behavior) as 'Number of views'
FROM userbehavior
WHERE behavior='pv'
GROUP BY item
ORDER BY count(behavior) DESC
limit 10;
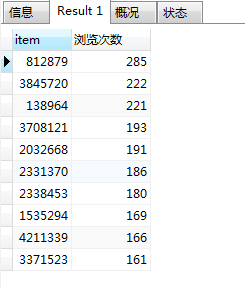
Connect the top 10 items in sales volume with the top 10 items in browsing volume:
Connection between commodity sales list and browsing list
SELECT a.item,a.`Number of purchases`,b.`Number of views`
FROM
(SELECT item, count(behavior) as 'Number of purchases'
FROM userbehavior
WHERE behavior='buy'
GROUP BY item
ORDER BY count(behavior) DESC
LIMIT 10) a
LEFT JOIN
(SELECT item, count(behavior) as 'Number of views'
FROM userbehavior
WHERE behavior='pv'
GROUP BY item
ORDER BY count(behavior) DESC
limit 10) b on a.item=b.item;
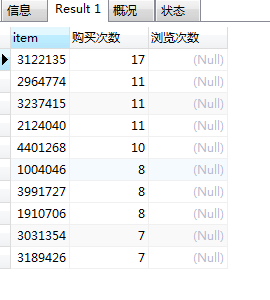
The results show that the correspondence between the commodity sales list and the commodity browsing list is poor (only two commodity sales and browsing enter the top 20 lists at the same time), which reflects that the sales volume of commodities with high browsing volume is not necessarily high, and the browsing volume of commodities with high sales volume is not necessarily high
The loyalty of Taobao users is high, and the repurchase rate is as high as 66.21%. The conversion rate from browsing the product details page PV to having purchase intention is only 6.19%. This link is the key link of index improvement. Try to make accurate recommendations and reduce the cost of users looking for information.
Suggestions for improving conversion rate in the above links:
(1) Optimize the search matching degree and recommendation strategy of e-commerce platform, actively recommend relevant commodities according to user preferences, optimize the accuracy and aggregation ability of commodity search, and optimize the ranking priority of search results.
(2) Highlight the key information concerned by users on the display of product details page, simplify the presentation of information flow, and reduce the cost of users looking for information.
2. Various behavioral data indicators of users have little difference on weekends and weekdays, but are greatly affected by large platform activities such as double 12. The time period between 20-23 o'clock every night is the time period with the highest user activity. Each data index presents a big peak, and reaches the maximum peak of daily data around 21 o'clock. When formulating the operation strategy, you can use this law to generate income, and choose to launch various interactive marketing means such as live broadcasting of online stores and live delivery in the most active time period of users every day.
3. The correlation between commodity sales volume and commodity browsing volume is poor. The sales volume of commodities with high browsing volume is not necessarily high, and the browsing volume of commodities with high sales volume is not necessarily high,
4. Through the RFM model, the users are stratified, the users with high RF score are found as high-value users, and different operation strategies are adopted for different types of users.