A single normal population
Two normal populations
three Interval estimation of (0-1) parameters
one A normal population
The values here are the upper alpah quantile
| Parameters to be estimated | Other parameters | Distribution of pivot amount | Bilateral confidence interval | Unilateral upper limit | Unilateral lower limit | |
| u |  Known Known |  |  |  |  | |
| u | unknown |  |  |  |  | |
| u unknown |  |  |  |  |
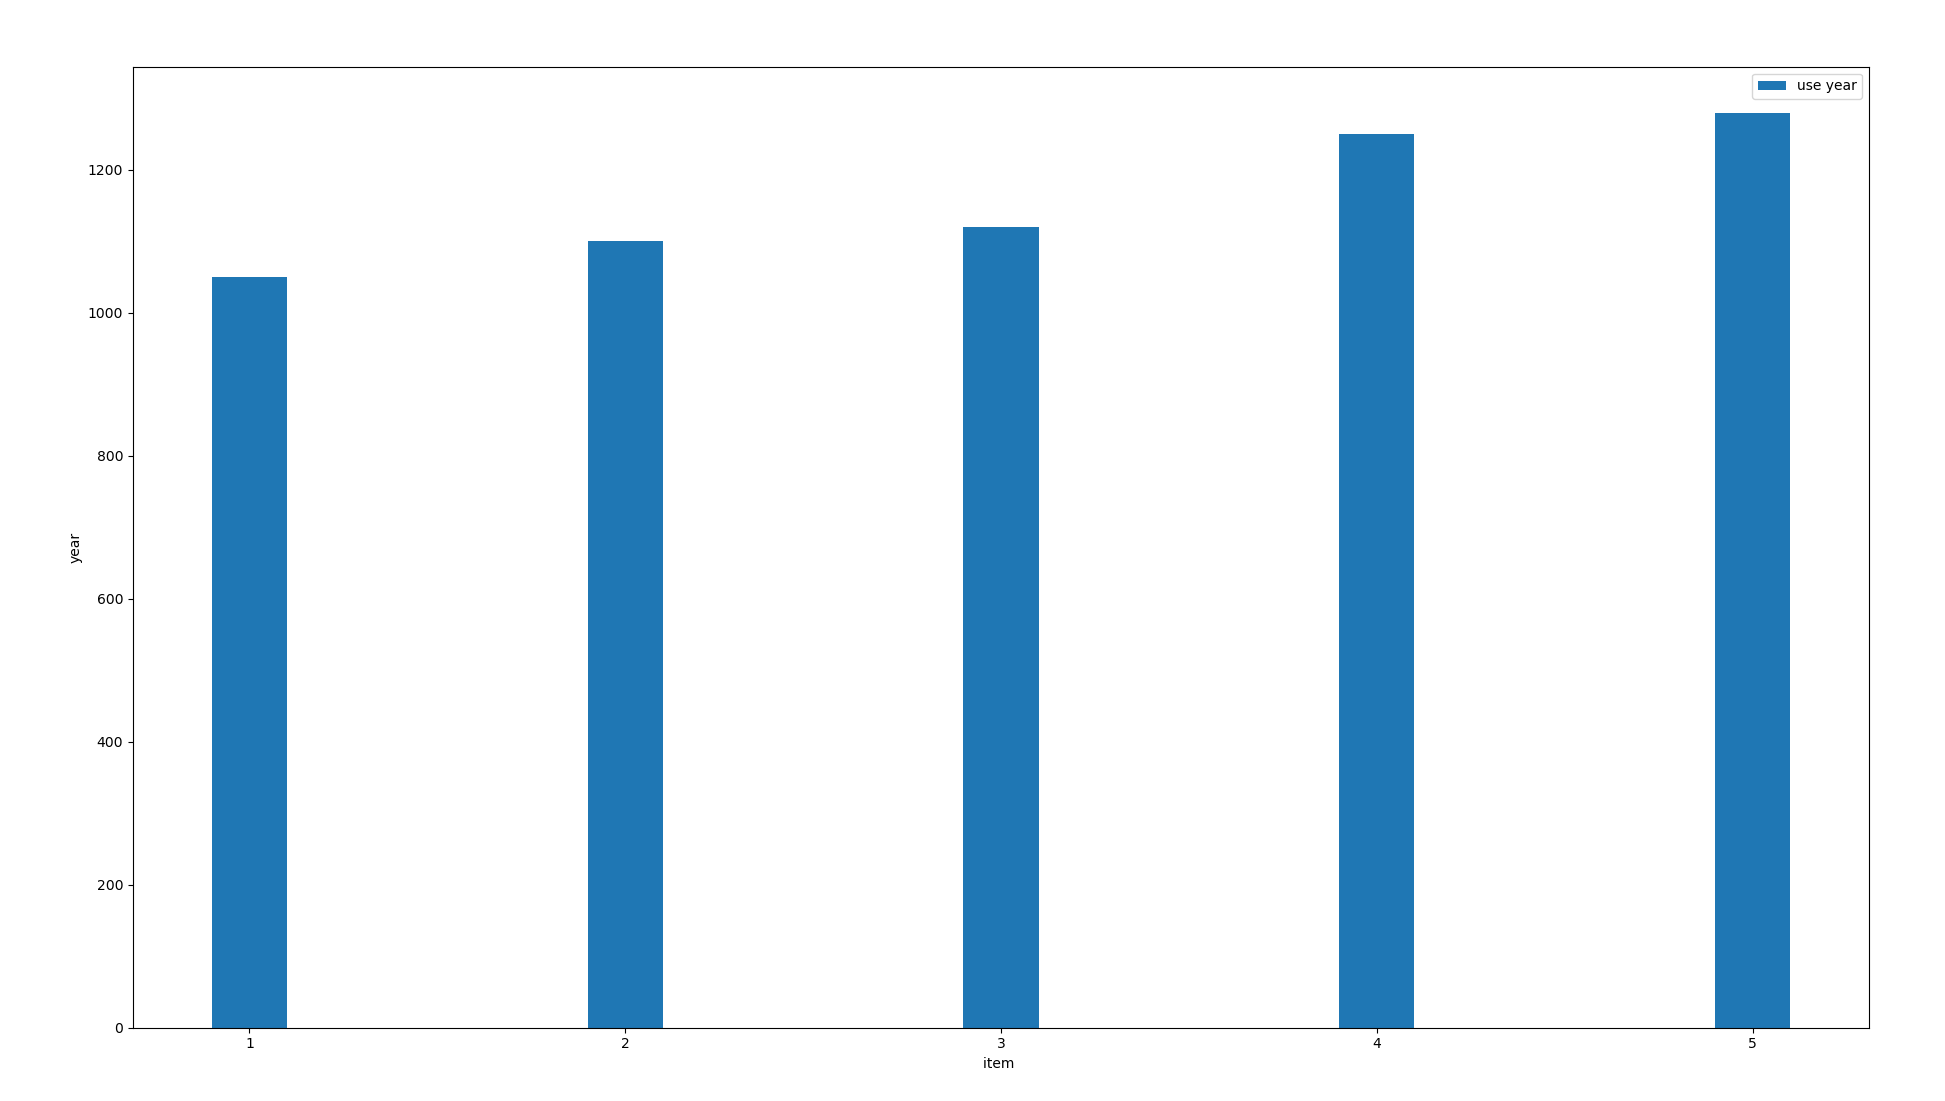
Example: Five bulbs are randomly selected from a batch of bulbs for life test, and the life is measured
1050 1100 1120 1250 1280
Let the bulb obey the normal distribution, and find the lower limit of one-sided confidence interval with the average confidence level of 0.95
# -*- coding: utf-8 -*-
"""
Created on Sat Nov 20 20:54:34 2021

@author: cxf
"""
import numpy as np
from scipy.stats import t
import matplotlib.pyplot as plt


class Confidence():

    def GetData(self):

        data =[1050, 1100,1120,1250,1280]

        x = np.arange(1,len(data)+1)

        plt.bar(x, data,width=0.2, label='use year')
        plt.xlabel("item ")
        plt.ylabel("year")
        plt.legend()
        plt.show()
        return data


    def __init__(self):
        self.alpha = 0.05 #The confidence interval was 0.95


    '''
    ddof= 1 Is the sample standard deviation, otherwise it is the overall standard deviation
    '''
    def GetConfidence(self):

        data = self.GetData()
        n = len(data)
        x_bar = np.mean(data)
        s = np.std(data,ddof=1)


        v = t.isf(self.alpha,n-1)
        print("\n Sample mean %5.2f  ,Sample standard deviation %5.2f  Number of samples %d , upper alpha Quantile%5.2f "%(x_bar, s,n,v))
        low = x_bar-s/np.sqrt(n)*v

        print("\n Lower limit of unilateral confidence interval u %5.2f"%low)


if __name__ == "__main__":

    Co = Confidence()

    Co.GetConfidence()
=======================================

 Sample mean 1160.00  ,Sample standard deviation 99.75  Number of samples 5 , upper alpha Quantile 2.13

 Lower limit of unilateral confidence interval u 1064.90
Two normal populations
| Parameters to be estimated | Other parameters | Distribution of pivot amount | Bilateral confidence interval | Unilateral upper limit | Unilateral lower limit |
| u1-u2 |  Known Known |  |  |  |  |
| u1-u2 |  unknown unknown |  |  |  |  |
 |  unknown unknown |  |  |  |  |
three Interval estimation of (0-1) distribution parameters
Sample mean u, variance p(1-p)
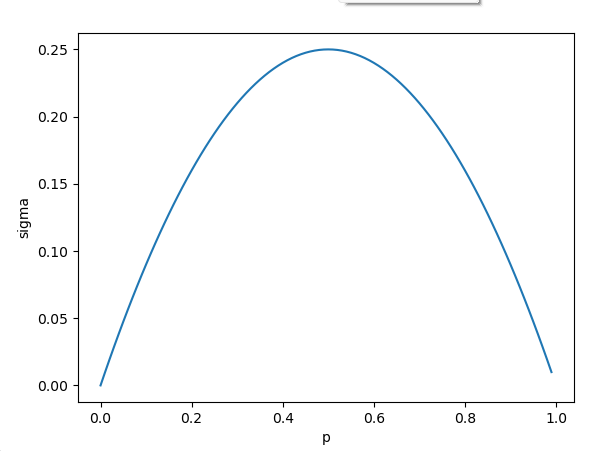
Distribution of pivot amount:


confidence interval

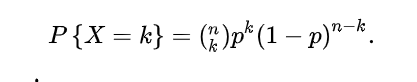
Binomial distribution is
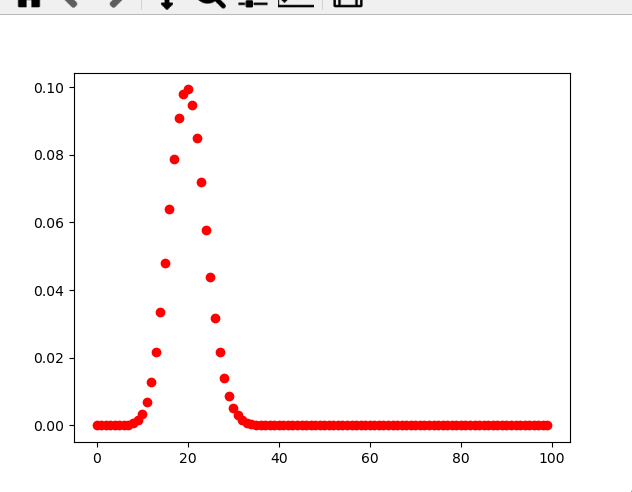
In probability theory and statistics, binomial distribution is a discrete probability distribution of the number of successes in n independent success / failure tests, in which the success probability of each test is p. Such a single success / failure test is also called Bernoulli test . In fact, when n=1, the binomial distribution is Bernoulli distribution.
For example, in the KNN algorithm, the general algorithm does not stipulate that we finally take several K numbers from N numbers.
Because the number of K is closest to the Euclidean distance of the sample, D(Xk)=0 is expected to be a type.
For example, if the label type of the sample is 5, the probability of selecting a random sample in k and the label value p of the data itself is
1/N.
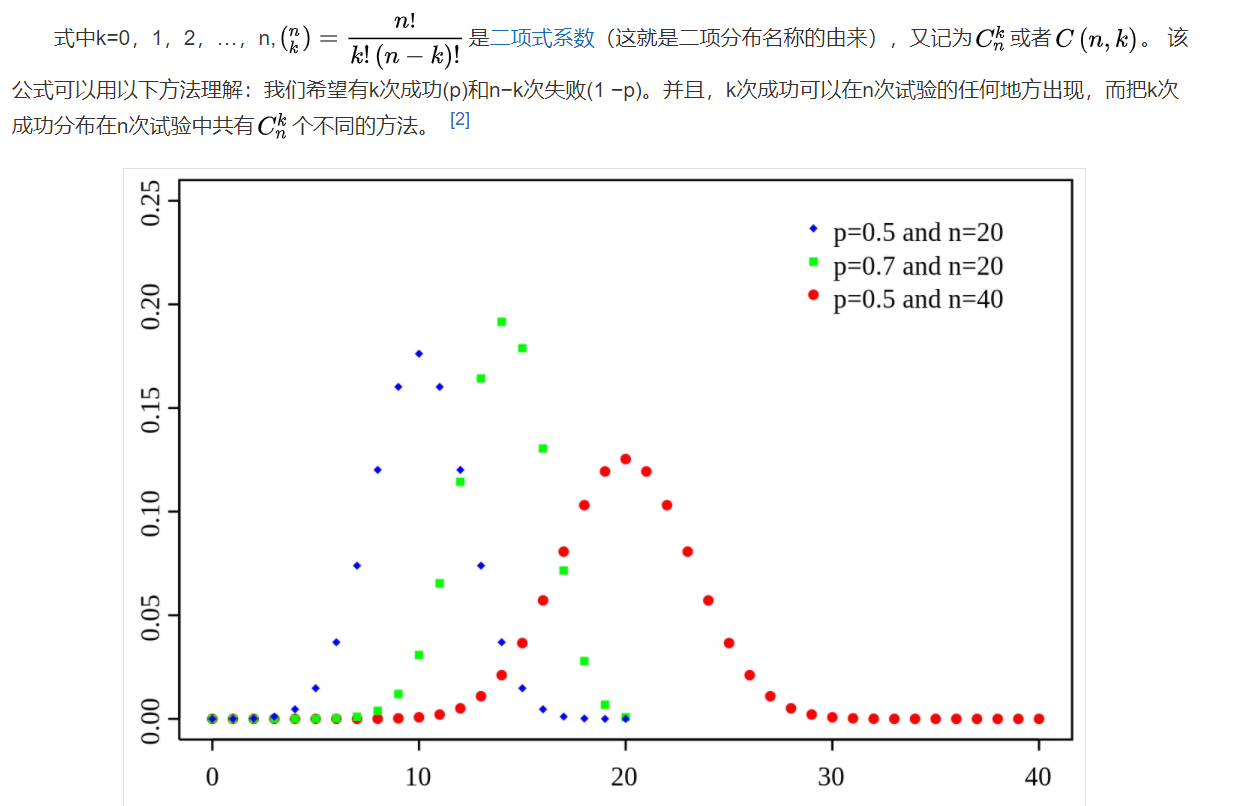
As can be seen from Fig. 1, for fixed n and P, when k increases, the probability P{X=k} first increases until it reaches the maximum, and then decreases monotonically. It can be proved that the general binomial distribution also has this property, and: [1]
-
When (n+1) P is not an integer, the binomial probability P{X=k} reaches the maximum when k=[(n+1)p]; [1]
-
When (n+1) P is an integer, the binomial probability P{X=k} reaches the maximum when k=(n+1)p and k=(n+1)p-1.
example
# -*- coding: utf-8 -*-
"""
Created on Sun Nov 21 16:08:06 2021

@author: cxf
"""

import matplotlib.pyplot  as plt
import numpy as np
import scipy.misc as ms
from scipy.special  import comb ,perm

def GetP(p,m,n,cb):

    a = cb*np.power(p,n)*np.power(1-p,m-n)
    return a

def GetData(m,p):
    y =[]
    x = np.arange(0,m)

    for  n in range(m):
         a = comb(m,n) #Permutation and combination
         b = np.power(p,n)
         c = np.power(1.0-p,m-n)
         #print("cb ",False)
         d = a*b*c
         y.append(d)

         print("prob ",p)
    plt.scatter(x,y,c='r')
    plt.show()

def DrawTwo():
     a= 0

     GetData(100,0.2)

DrawTwo()