It's just a fluke. I think of a project XX market independently developed last year. There is a trend chart of individual stocks. It's based on android custom view, reflecting the complete process of custom view, analyzing the general process and part of the implementation code
New rules, first effect
Timesharing chart
The effect picture is as follows (no moving picture has been recorded yet) 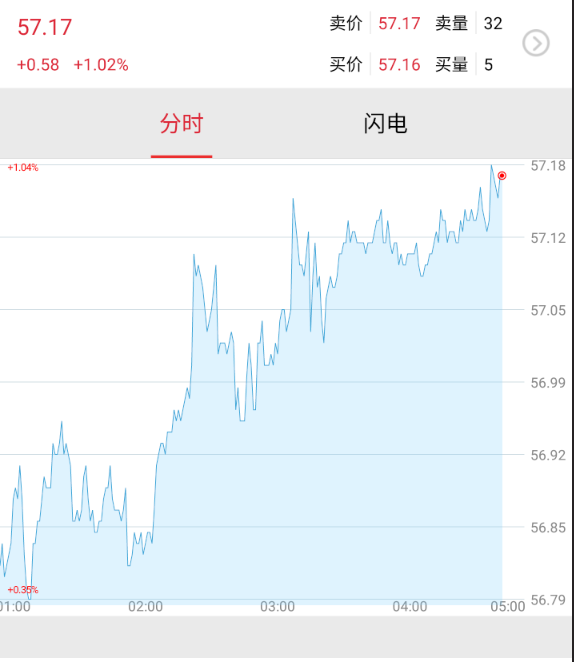
Implementation steps:
1. Customize related properties: attrs.xml Statement in
<declare-styleable name="MinView">
       <attr name="pathColor" format="reference|color"/>
       <attr name="textDColor" format="reference|color"/>
       <attr name="lineColorr" format="reference|color"/>
       <attr name="fillPathColorr" format="reference|color"/>
       <attr name="textSizz" format="dimension"/>
   </declare-styleable>
2. Reference in layout
3. Get properties
4. Set the size of view
/**
  * Get the width and height of view according to the measurement mode
  * @param widthMeasureSpec
  * @param heightMeasureSpec
  */
 @Override
 protected void onMeasure(int widthMeasureSpec, int heightMeasureSpec) {
     super.onMeasure(widthMeasureSpec, heightMeasureSpec);
     measuredWidth = getMeasuredWidth();
     measuredHeight = getMeasuredHeight();
     int widhtSpecMode = MeasureSpec.getMode(widthMeasureSpec);
     int heightSpecMode = MeasureSpec.getMode(heightMeasureSpec);
     mChartLeftMargin = getLeft() + getPaddingLeft();
     mChartRightMargin = getPaddingRight();

     if (widhtSpecMode == MeasureSpec.EXACTLY) {
         mViewWidth = measuredWidth - mChartRightMargin - mChartLeftMargin;//Width of view
     }
     if (heightSpecMode == MeasureSpec.EXACTLY) {
         mViewHeight = measuredHeight - getPaddingBottom() - getPaddingTop() - mTextHeight;//Height of view
         mBottomTextTop = mChartHeight + mTextMargin;
     }

 }
5. Drawing
//Draw view background
canvas.drawRect(0, 0, measuredWidth, measuredHeight, mPaintBg);
//Draw dotted line
drawDashLine(canvas);
//Draw right text
drawRText(canvas);
//Draw the trend path
if (futures != null && futures.size() > 0)
   drawPath(canvas);

/**
* Draw a horizontal line
* @param canvas
*/
private void drawDashLine(Canvas canvas) {
   startY = mTextMargin;
   mPath.reset();
   if (datas == null)
       throw new RuntimeException("data is null");
   for (int index = 0; index < mLineNum; index++) {
       mPath.moveTo(0, startY);
       mPath.lineTo(0 + mLineWidth, startY);
       startY += mLineSpaceX;
   }
   canvas.drawPath(mPath, mAxisPaint);
}

/**
 * When drawing the text on the right coordinate, please note that the initialization no data is 0.0 by default
 * @param canvas
 */
private void drawRText(Canvas canvas) {
    startY = mTextMargin;
    for (int index = 0; index < mLineNum; index++) {
        if (datas == null)
            break;
        if (futures != null && futures.size() > 0)
            canvas.drawText(datas.get(index), mChartWidth - mTextWidth, startY + mTextHeight / 2, mTextPaint);
        else
            canvas.drawText(datas.get(index), mChartWidth - mTextWidth, startY + mTextHeight / 2, mTextPaint);
        startY += mLineSpaceX;
    }
}

/**
 * Realize trend chart and draw data path through path
 */
private void drawPath(Canvas canvas) {
    mPath1.reset();//Reset the path to avoid excessive memory consumption due to excessive path data
    mPath2.reset();
    mLastX = 0;
    mLastY = getActualY(futures.get(0).getCurrent());

    mPath1.moveTo(mLastX, mLastY);
    mPath2.moveTo(mLastX, mChartHeight);
    mPath2.lineTo(mLastX, mLastY);

    for (int i = 0; i < futures.size(); i++) {
        toY = getActualY(futures.get(i).getCurrent());
        mPath1.lineTo(mLastX, toY);
        mPath2.lineTo(mLastX, toY);
        mLastX = i * mAxisIndex;
    }
    canvas.drawPath(mPath1, mPathPaint);//Open line path
    canvas.drawPath(mPath2, mFillPaint);//Closed area and background of axis
}
The above is the core code for drawing the time-sharing chart, in which the market data used is inconvenient to provide, and other variables such as the brush are easy to initialize and set, which can be set by yourself.
It should be noted that when using path to draw a large number of data, it is easy to leak memory, resulting in drawing stuck. The processing method code has been given, just pay attention.
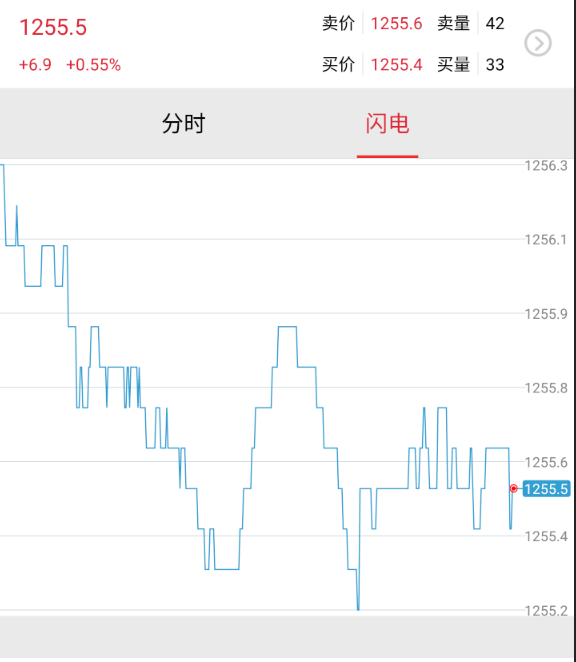
Lightning chart
The trend data moves backward in turn, as the current moves
- Lightning Atlas
-
Lightning diagram
The drawing method of lightning graph is the same as that of lightning graph. The difference lies in the movement of canvas canvas.translate(-translateX, 0); moving the canvas to the left has the effect of the above figure, which can be learned and implemented by yourself.