How to calculate user retention problems with sql
1, Retained
1. Meaning of retention:
Retained: refers to the number of users who arrive at the APP on the base date and return to the APP on the next n days;
Retention rate = number of users returned on the day n days after the base date / number of users on the base date * 100%
Or refers to the number of users who generate a behavior on the base date on the first day, the second day, the third day... The nth day after that.
2. Meaning of retention
Retention represents a user's willingness to use your product again; A product that can be reused by users means that the product can meet the long-term needs of users and make users produce a certain sticky product.
Nowadays, most Internet products are free products, which rely on continuous advertising transformation, continuous purchase transformation of users and continuous member payment of users to maintain revenue.
So, how can we achieve continuous advertising transformation? Continuous purchase conversion? Continuous member payment?
We all need users to complete advertising transformation, purchase and member payment. For continuous advertising transformation, purchase and member payment, we need a certain number of users to complete the above process every day, that is, we need our products to have active users every day.

From the composition of active users, we know how to maintain the scale of our active users: on the one hand, new users continue to flow in, on the other hand, retained users continue to remain;
So why is it important to retain users? Some students with working experience should know that there are few natural new users of products. If we only rely on the natural users of products to grow, our active users will be very small. Although we can obtain income, this part of income may not be able to support our company; However, if we want to obtain a continuous large-scale user pool by purchasing new users, it will incur relatively large costs, which is easy to lose money. Therefore, we need to add and retain both hands; Try every means to retain our new users and make them produce value in our products for a long time. This is better in cost and effect than just adding new users.
3. Practical application of retained
There are two main application scenarios:
One is the continuous retention of the overall perspective of the product; That is, we need to regularly analyze whether the retention of users in the product is maintained in a normal range, whether there is a sudden rise and fall, if so, where the problem is, why such a problem occurs, and how to solve the problem of abnormal retention. When encountering such problems, we first need to determine whether it is the retention exception of the whole user or the retention exception of individual groups of users. If it is the retention exception of the whole user, we need to analyze whether our products are abnormal, and we can determine the location of abnormal products through the user's behavior path; If it is a reserved exception of an individual user, it is necessary to locate the abnormal user group through user disassembly, and then analyze the cause of the problem through the characteristics of such users;
One is the retention of each batch of new users from the perspective of new users. Generally, it appears in the scenario of calculating the ROI, that is, how much revenue we can bring by putting in a group of users. We will calculate our ROI by removing the "revenue that can be brought by the whole life cycle" (LTV) of these users and using the "expenditure at the time of launch"“ The "revenue generated in the whole life cycle" calculates all the revenue generated by a group of new users when they are completely lost. However, sometimes we need to estimate the income that new users can bring in the whole life cycle in advance. We need to first estimate the user's life cycle with retention, and then use the estimated life cycle to calculate the income that users can bring in the whole life cycle.
**4. What enterprises do not care about retention**
Enterprises that need users to be continuously active, continuously transformed and continuously consumed are concerned about the retention of users. So, what kind of enterprise doesn't care about user retention?
Some offline enterprises are difficult to obtain data, so they pay less attention to retention. For example, in offline shopping malls, unless users have purchase behavior, it is difficult to find out under what circumstances users return;
Some enterprises that buy and sell with one hammer do not care much about retention. For example, users will no longer have subsequent purchase or value transformation after buying out goods at one time, and such enterprises do not pay much attention to retention. For example, PC stand-alone games; For example, one-time payment tool products (this is the case for both online and offline tools);
Question:
1. Calculate the daily retained data of an APP. Use SQL to decompose the retention calculation. In each step, use the view to establish (90 points) how to calculate the retention:
First of all, our purpose is to establish the following retention table: "user daily retention rate statistics table"
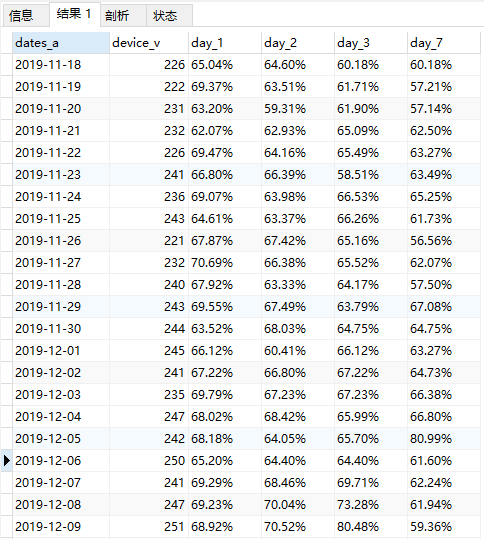
You can see that the retention table consists of the following fields:
dates_a calculate the base date of retention. This base date can be any day. If the base date is today, that is, there is no data of "the first day after", "the second day after"... And other days, the retention of those days can be replaced by 0 or null value;
device_v number of active users on the base date. Active users of different products have different definitions. Here, we define active users as users who have opened the APP on the same day;
day_1 the retention rate of the next day, that is, the return visit proportion of users on the "first day after the base date".
day_ 2-day retention rate, that is, the return visit proportion of users on the "second day after the base date".
day_ 3-day retention rate, that is, the return visit proportion of users on the "third day after the base date".
day_ 7-day retention rate, that is, the return visit proportion of users on the "seventh day after the base date".
In other words, this table expresses the number of active users per day and the corresponding retention rates of secondary users, 2-day users, 3-day users and 7-day users per day. From this table, we can see the user activity of our products and the short-term and long-term stickiness of our products to the active users on that day.
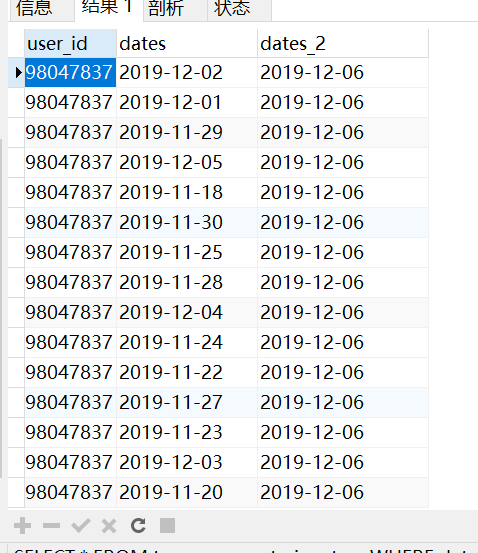
Our original data looks like this:
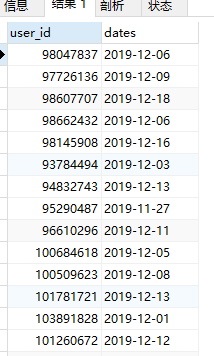
Is a table of daily app active users. Its fields are divided into two columns:
user_id is the id of the active user on that day
dates is the date when the user is active
How can we make the above "user daily retention rate statistics table" according to the "daily activity table"?
Two key steps:
\1. We need to connect the daily active user data with the active data of the user in the next few days; So we can know this
The day after which the user has a return visit;
\2. Through the data concatenation function of SQL, that is, the method of "aggregate function (case when condition)", the "first time after base date" will be met
The user data of "day", "the second day after the base date"... Are counted, and finally the number of users retained on the base date is calculated
Rate;
The following assignment is to guide the students how to realize the above two processes.
1.0. Establish user activity date table (5 points)
Table name: temp_user_act
Field:
Field name field type field description
user_id int user id
dates date active date
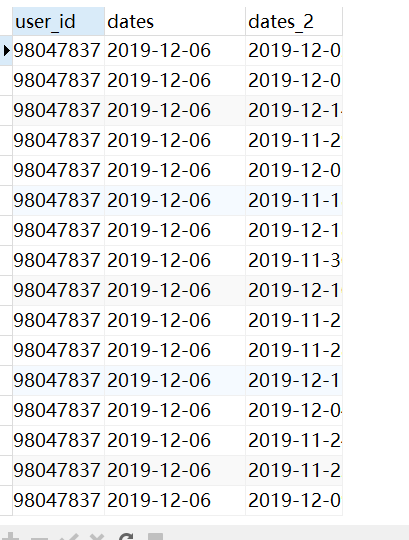
1.1. Use the user active date table as the self connection. The connection method uses the left connection. The connection field uses the "user id" field. Keep the user id of the two tables and the date of the two tables (20 points)
/*
1.1.The user active date table is used as the self connection, the connection method is left connection, the connection field is "user id", and the user id of the two tables and the date of the two tables are retained (20 points)
 */


DROP TABLE if EXISTS temp_user_act;
CREATE TABLE temp_user_act(
user_id int COMMENT 'user id',

dates date COMMENT  'Active date'

);

--
CREATE VIEW temp_user_act_view_tem as
SELECT a.*,b.dates  dates_2 FROM temp_user_act a
LEFT JOIN temp_user_act  b on a.user_id=b.user_id;
1.2. Filter out the content whose date in the right table is greater than or equal to the date in the left table (20 points)
-- 1.2.Filter out the content whose date in the right table is greater than or equal to the date in the left table (20 points)
CREATE VIEW temp_user_act_view_tem_2 as
SELECT * FROM temp_user_act_view_tem
WHERE dates_2>dates;
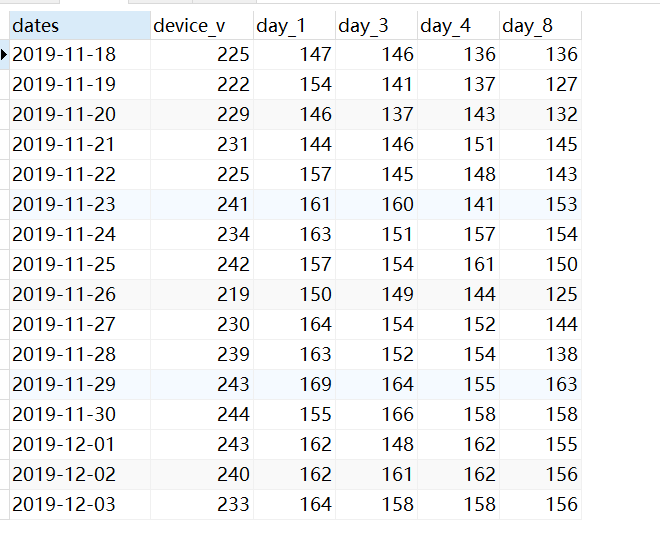
1.3. Calculate the number of users on the current day, the second day, the third day, the fourth day and the eighth day based on the date in the left table( (20 points)
Tips
Tips:
datediff(B,A)=1 means that date B is the day after date A.
count(distinct case when datediff(B,A)=1 then uid else null end) or count (distinct if)(
datediff(B,A)=1,uid,null)) is to calculate the number of users whose "date B is the first day after base date A"
SELECT
dates,
count(user_id) device_v,
count(distinct case when datediff(dates_2,dates)=1 then
user_id else null end) day_1,
count(distinct case when datediff(dates_2,dates)=2 then
user_id else null end) day_3,
count(distinct case when datediff(dates_2,dates)=3 then
user_id else null end) day_4,
count(distinct case when datediff(dates_2,dates)=7 then
user_id else null end) day_8

FROM  temp_user_act_view_tem_2
GROUP BY dates ORDER BY dates;
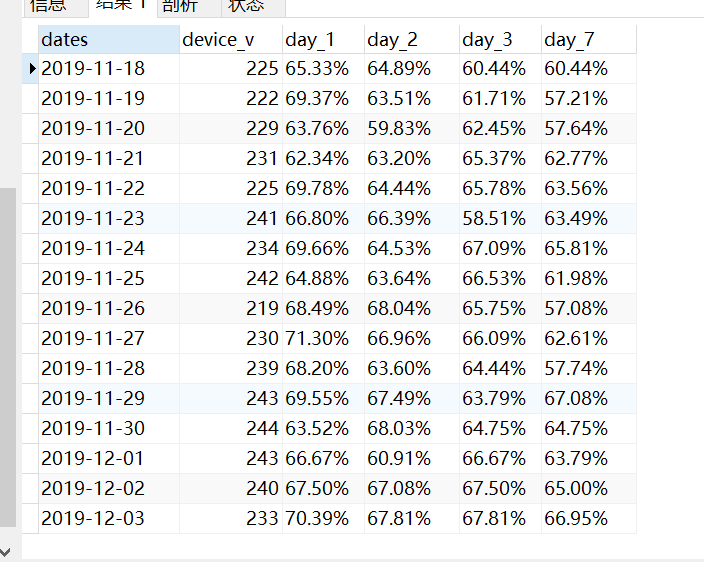
1.4. Use the above data to calculate the number of users of the day and the retention rate of the next day, the retention rate of the second day, the retention rate of the third day and the retention rate of the seventh day (the results need to be expressed in percentage)( 20 points) (in the next part of the case, we will introduce a one-time retention calculation method to deepen your impression of retention calculation.)
SELECT dates,device_v,
CONCAT(ROUND((day_1/device_v)*100,2),"%") day_1,
CONCAT(ROUND((day_3/device_v)*100,2),"%") day_2,
CONCAT(ROUND((day_4/device_v)*100,2),"%") day_3,
CONCAT(ROUND((day_8/device_v)*100,2),"%") day_7
FROM temp_user_act_view_tem_3;
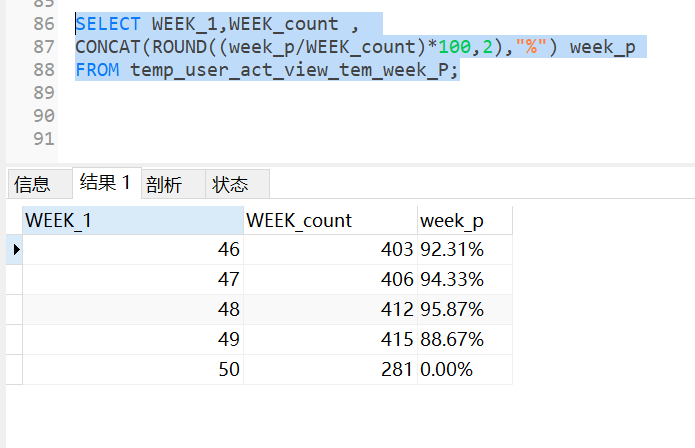
1.5 (tall question) *. Calculate the weekly ratio of daily secondary retention to secondary retention( (5 points)
Note:
Week on month ratio: the week on month ratio is applicable to the data that changes in a weekly cycle. It is used to observe the change of daily data compared with the data on the same day last week.
Most of the existing Internet data changes on a weekly basis, and each day of the week has its own characteristics:
Such as work APP,Monday will be the peak of each week, then gradually decrease to Friday, and there will be a sharp decrease from Friday to Saturday
 Cheng, Sunday and Saturday tend to be flat;

Such as entertainment APP,Monday will decrease sharply compared with the weekend, and then gradually decrease to Thursday. There will be a jump process on Friday and again on Saturday
 Jump, Sunday will be lower than Saturday;
Generally, in case of such a change trend, it is easy to draw wrong conclusions by simply analyzing the change of each day compared with the previous day. Therefore, when we analyze periodic data, we must extract the cycle first. Using the cycle comparison data for analysis will draw more valuable and accurate conclusions.
1. Calculation method:
If today is Monday, the week on week ratio = (data of this Monday - data of last week) / data of last week * 100%
2. The part without data corresponding to last week's date can be blank;
--  If today is Monday, then week on week=(Data of this Monday - Last Monday data) / Last Monday data * 100%
CREATE VIEW temp_user_act_view_tem_week_1 as
SELECT *,WEEK(dates) week_1,WEEK(dates_2) week_2 FROM  temp_user_act_view_tem_2;


CREATE VIEW temp_user_act_view_tem_week_P as
SELECT
WEEK_1,
count(DISTINCT user_id) WEEK_count  ,
count(distinct case when week_2-week_1=1 then
user_id else null end) week_p
FROM temp_user_act_view_tem_week_1
GROUP BY WEEK_1 ORDER BY week_1
;

SELECT WEEK_1,WEEK_count ,
CONCAT(ROUND((week_p/WEEK_count)*100,2),"%") week_p
FROM temp_user_act_view_tem_week_P;
II (Advanced questions) * *. * * author's active behavior statistics (10 points)
Most content apps today operate in a platform mode.
What is platform mode?
For example, most of the content products we can touch now are "jitter", "Bilibili", "micro-blog", "today's tiktok" and so on. The APP we use is provided by the APP production company, that is, the APP will have several main pages. How each page guides users to enter the content page, what methods to play the content, what methods to switch between contents, etc. are determined by our APP production company; and
Most of the content we see in this APP is provided by the content author.
In order to make our platform have continuous content output, we need to analyze the author's active behavior. Mainly for our authors
The battalion provided strong help. On the one hand, let's find active authors and increase policy support; On the one hand, let's find the author who is about to lose, and
Recall this part of the author and recover the loss.
The video statistics released by an author of a short video company are as follows:
Table name: temp_author_act
Field:
Field name field type field description
dates date
author_id varchar(5) author id
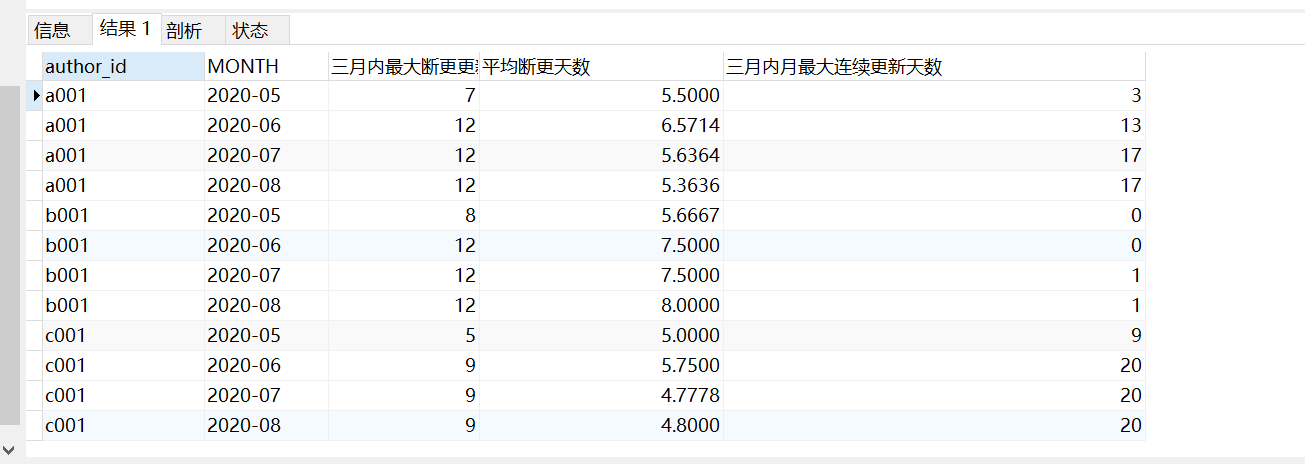
2.1. It is requested to use SQL to calculate the author's maximum outage days, average outage days and maximum continuous update days in the last three months( 5 points) explanation of terms:
Continuous update days: if an author updates every day in a certain number of days, the number of days during this period is called the continuous update days of the author.
Broken days: if an author does not update after a few days between two updates, the days in these days are called the broken days of the author
Number.
	-- 	Request use**SQL**The author's maximum break days, average break days and maximum continuous update days in the last three months(**5**(min)
DROP view if EXISTS temp_author_act_1;
CREATE view temp_author_act_1 as
SELECT
a.author_id,
dates,LEAD(dates,1) over(PARTITION by author_id ORDER BY dates) lead_1  FROM temp_author_act  as a;

DROP view if EXISTS temp_author_act_2;
CREATE view temp_author_act_2 as
SELECT
author_id,
MONTH,
max(Monthly maximum update days) over(PARTITION by author_id ORDER BY MONTH rows BETWEEN 2 preceding AND current ROW)  Maximum number of update days in three months,
sum(Sum of the maximum update days of the month) over(PARTITION by author_id ORDER BY MONTH rows BETWEEN 2 preceding AND current ROW)  /
sum(Number of update days in the month) over(PARTITION by author_id ORDER BY MONTH rows BETWEEN 2 preceding AND current ROW)  Average outage days,
max(Monthly maximum continuous update days) over(PARTITION by author_id ORDER BY MONTH rows BETWEEN 2 preceding AND current ROW)  Maximum continuous update days in three months
FROM
	(
SELECT
author_id,
MONTH,
max(case WHEN  DATED_IFF=1 then DATED_IFF_sum end) Monthly maximum continuous update days,
max(case WHEN  DATED_IFF!=1 then DATED_IFF_sum end) Monthly maximum update days,
sum(case WHEN  DATED_IFF!=1 then DATED_IFF_sum end) Sum of the maximum update days of the month,
count(case WHEN  DATED_IFF !=1 then DATED_IFF_sum end) Number of update days in the month
from
		(
		SELECT
			author_id,
			dates,
			lead_1,
			MONTH,
			DATED_IFF,
			sum(DATED_IFF) over(PARTITION by author_id,MONTH,dated_iff ORDER BY dates) DATED_IFF_sum
		FROM
		(
		SELECT
		author_id,
			dates,
			lead_1,
		LEFT(dates,7) MONTH,
		DATEDIFF( lead_1, dates ) DATED_IFF
		FROM
		temp_author_act_1 WHERE DATEDIFF( lead_1, dates ) >=1 ) a )b
		GROUP BY author_id,MONTH
		) c

		;

SELECT
author_id,
MONTH,
Maximum number of update days in three months,
Average outage days,
if(ISNULL(Maximum continuous update days in three months),0,Maximum continuous update days in three months) Maximum continuous update days in three months FROM temp_author_act_2;
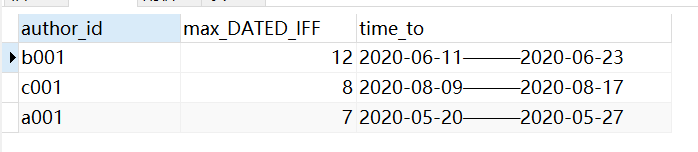
2.2. The operator needs to call the author, and you need to use SQL to calculate the corresponding date range of each author in the maximum number of days off.
Used to access the reason for the change interruption within this date( (5 points)
-- 2.2

CREATE view temp_author_act_1 as
SELECT
a.author_id,
dates,LEAD(dates,1) over(ORDER BY dates) lead_1  FROM temp_author_act  as a;


SELECT a.author_id, max_DATED_IFF ,time_to FROM
	(SELECT
		author_id,

			max(
			DATEDIFF( lead_1, dates )) max_DATED_IFF
		FROM
			temp_author_act_1
		GROUP BY
			author_id ) a
LEFT JOIN (

SELECT
	author_id,
	CONCAT(dates,'-—',lead_1) time_to,
 DATEDIFF( lead_1,dates ) DATED_IFF
FROM
	temp_author_act_1) b on a.author_id=b.author_id and a.max_DATED_IFF =b.DATED_IFF
	ORDER BY max_DATED_IFF desc;