sleuth study notes
1, Link tracking
1.1 link tracking in distributed environment
Timing information
Call information in the call link, including call time and which method,
Location link
The whole link will generate a Trac id, through which the whole upstream and downstream link calling process can be queried in the log system
Collection and display of information
report form
1.2 sleuth function
1.3 call link tracking model
-
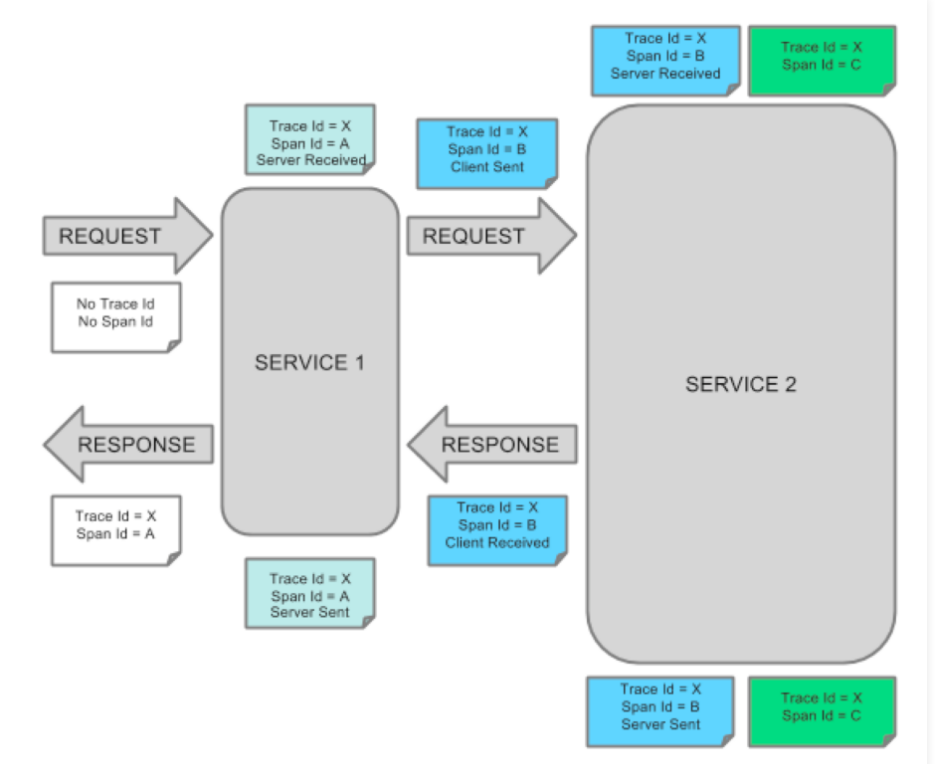
Trace: it runs through the whole process from beginning to end. We call it TraceId. It remains unchanged no matter how many nodes go through in the middle.
-
Span: represents a node or unit of work. A unique identifier (SpanId, one for each node) is used to mark its start, specific process and end to count the call time. In addition, we can also obtain the name of the event. Metadata such as request information
-
Annotation: it is used to record events over a period of time and important annotations used internally. A span can have multiple annotations, including the following:
- cs Client Sent: the client sends a request
- cr Client Received: the client has accepted a request from the server
- ss Server Sent: the server sends a Response to the client
- sr Server Receive: the server received a call from the client
How is this information transmitted between links?
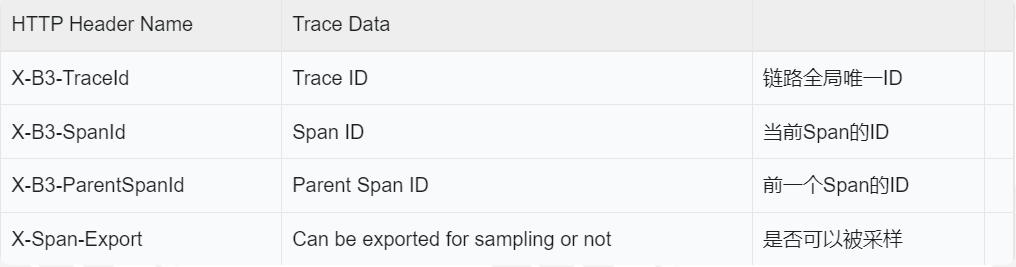
sleuth transmits information by modifying the attributes in the header through the filter. The attributes are as follows:
2, Code demonstration
A sleuth-server-a -- > sleuth-server-b -- > sleuth-server-c
2.1 taking sleuth-server-a as an example, related dependency configurations
Dependency:
<dependencies>
    <dependency>
        <groupId>org.springframework.boot</groupId>
        <artifactId>spring-boot-starter-web</artifactId>
    </dependency>
    <!--eureka modular-->
    <dependency>
        <groupId>org.springframework.cloud</groupId>
        <artifactId>spring-cloud-starter-netflix-eureka-client</artifactId>
    </dependency>

    <!--sleuth-->
    <dependency>
        <groupId>org.springframework.cloud</groupId>
        <artifactId>spring-cloud-starter-sleuth</artifactId>
    </dependency>

    <!--feign rely on-->
    <dependency>
        <groupId>org.springframework.cloud</groupId>
        <artifactId>spring-cloud-starter-openfeign</artifactId>
    </dependency>

    <dependency>
        <groupId>org.projectlombok</groupId>
        <artifactId>lombok</artifactId>
    </dependency>
</dependencies>
to configure
server:
  port: 8901

spring:
  application:
    name: sleuth-server-a
eureka:
  client:
    register-with-eureka: true # Whether to register yourself on eureka without configuration. The default is true
    fetch-registry: true # Whether to pull service information from eureka service is not configured. The default is true
    serviceUrl:
      defaultZone: http://localhost:7005/eureka / # register with eureka service.
Test class
API
@FeignClient("sleuth-server-b")
public interface FeignApiA {

    @GetMapping("/sendMsgB")
    String sendMsg(@RequestParam("msg") String msg);

}
@RestController
@Slf4j
public class TestController {
    private final FeignApiA feignApiA;

    public TestController(FeignApiA feignApiA) {
        this.feignApiA = feignApiA;
    }

    @GetMapping("sendMsg")
    public String sendMsg(@RequestParam("msg") String msg){

        log.info("I am SleuthServerA,I received a message:{}",msg);
        return feignApiA.sendMsg(msg);

    }
The code is relatively simple, bc will not be created one by one.
2.2 log analysis of three machines
2021-11-02 21:09:42.176  INFO [sleuth-server-a,8424c5a64eba998d,8424c5a64eba998d] 3708 --- [nio-8901-exec-1] c.z.sleuth.a.controller.TestController   : I am SleuthServerA,I received a message: Hello

## List of important information
INFO [sleuth-server-a,8424c5a64eba998d,8424c5a64eba998d] 3708
INFO [sleuth-server-b,8424c5a64eba998d,953c369b5cbc1530] 12004
INFO [sleuth-server-c,8424c5a64eba998d,f8043aa027fdfb4b] 16764

In the logs of the three machines, 8424 c5a64eba998d by tracId Throughout the call, the latter one is spanId One in each machine
3, sleuth's good partner zipkin
zipkin is mainly used to analyze the call and facilitate troubleshooting. elk can be used to view specific logs.
3.1 it is mainly composed of four parts
-
Collector: it is the daemon of zipkin server. It is mainly used to verify the link data sent by the client and establish an index in the storage
-
Stronger: zpikin supports es and mysql as log link collection and storage
-
Search engine: provides json API interface to query log information
-
Dashboard: log monitoring
3.2 build a Zipkin server
Version: spring boot 2.1.5.release
zipkin 2.8.4
3.2.1 dependency
<dependencies>
    <!--eureka modular-->
    <dependency>
        <groupId>org.springframework.cloud</groupId>
        <artifactId>spring-cloud-starter-netflix-eureka-client</artifactId>
    </dependency>

    <!--New version zipkin Without this architecture, it directly provides a start-up jar Package mode-->
    <dependency>
        <groupId>io.zipkin.java</groupId>
        <artifactId>zipkin-server</artifactId>
        <version>2.8.4</version>
    </dependency>
    <!--Console,Foreground query page-->
    <dependency>
        <groupId>io.zipkin.java</groupId>
        <artifactId>zipkin-ui</artifactId>
        <version>2.8.4</version>
    </dependency>
</dependencies>
3.2.2 configuration
server:
  port: 8904

spring:
  application:
    name: zipkin-server
  main:
    allow-bean-definition-overriding: true # Allow override for classes with the same name
management:
  metrics:
    web:
      server:
        request:
          autotime:
            enabled: false
eureka:
  client:
    register-with-eureka: true # Whether to register yourself on eureka without configuration. The default is true
    fetch-registry: true # Whether to pull service information from eureka service is not configured. The default is true
    serviceUrl:
      defaultZone: http://localhost:7005/eureka / # register with eureka service.
3.2.3 startup
@SpringBootApplication
@EnableDiscoveryClient
@EnableZipkinServer
public class ZipKinServerApp {

    public static void main(String[] args) {
        SpringApplication.run(ZipKinServerApp.class,args);
    }
}
3.2.4 testing
Start access http://127.0.0.1:8904/zipkin/ You can see the Zipkin console page
3.2.5 summary
On November 3, 2021, I found that the higher version of spring boot 2.5.1 I used was incompatible. I went to the official website and found that the new version was 2.23.4. The integration method was not the above situation, but downloaded and ran
-
Via docker
docker run -d -p 9411:9411 openzipkin/zipkin
-
Through jar package
curl -sSL https://zipkin.io/quickstart.sh | bash -sjava -jar zipkin.jar
-
Or download the source code
# get the latest sourcegit clone https://github.com/openzipkin/zipkincd zipkin# Build the server and also make its dependencies./mvnw -DskipTests --also-make -pl zipkin-server clean install# Run the serverjava -jar ./zipkin-server/target/zipkin-server-*exec.jar
The following is post run access http://127.0.0.1:9411/zipkin/ Screenshot of
3.3 integration of sleuth and zipkin
Introduced in the calling service above
3.3.1 dependency
<!--zipkin-->
<dependency>
    <groupId>org.springframework.cloud</groupId>
    <artifactId>spring-cloud-starter-zipkin</artifactId>
    <version>2.1.1.RELEASE</version>
</dependency>
3.3.2 configuration
server:
  port: 8903

spring:
  application:
    name: sleuth-server-c
  sleuth:
    sampler:
      probability: 1 # Sampling rate 100% 0.8 sampling rate 80%
  zipkin:
    base-url: http://127.0.0.1: 9411 # Zipkin server address
eureka:
  client:
    register-with-eureka: true # Whether to register yourself on eureka without configuration. The default is true
    fetch-registry: true # Whether to pull service information from eureka service is not configured. The default is true
    serviceUrl:
      defaultZone: http://localhost:7005/eureka / # register with eureka service.
3.3.3 summary
Mainly through zipkin.base-url=http://127.0.0.1:9411 To send the log call record.
It is not a log collection tool, but records the calling relationship between services.
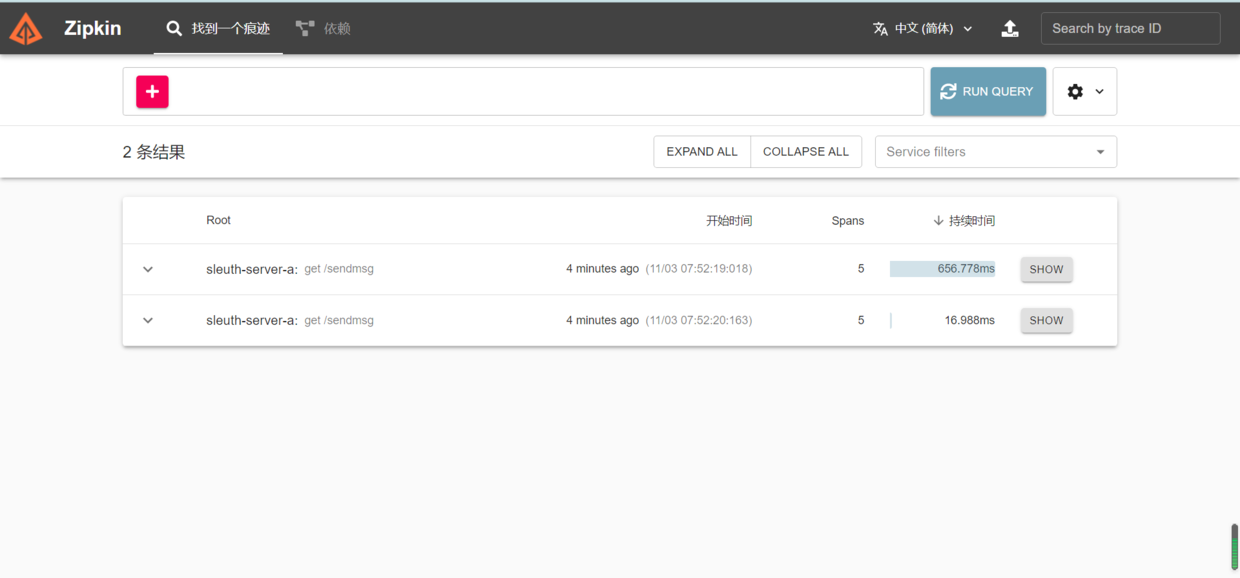
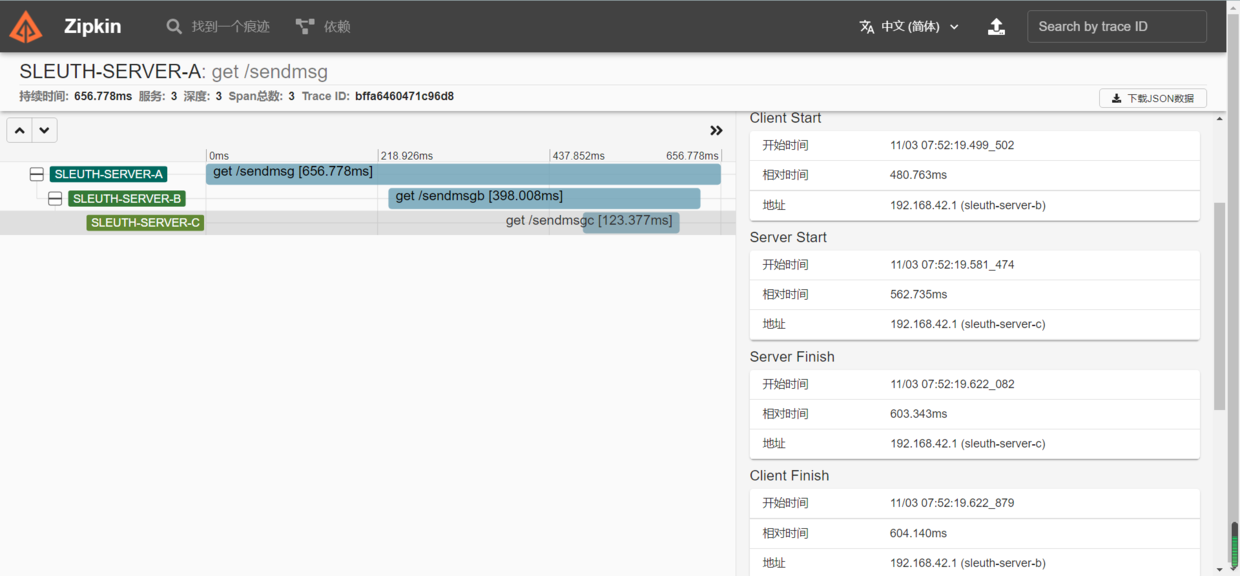
At this point, you can see your own call record on the zipkin page
Call simple screenshot
4, sleuth integrated elk log collection
Sleuth is mainly used to mark the system to facilitate link tracking. The use of elk can be completely separated from sleuth. However, if it is necessary to record traceId spanId in the printed log, sleuth can be used to mark.
4.1 installation elk
This is installed through docker
1. Download Image (take a long time and be patient):
docker pull sebp/elk

2. establish Docker Container (created only when first used)
docker run -p 5601:5601 -p 9200:9200 -p 5044:5044 -e ES_MIN_MEM=128m  -e ES_MAX_MEM=1024m -it --name elk sebp/elk

3. get into docker Container:
docker exec -it elk /bin/bash

4. Modify profile
 Location of profile:/etc/logstash/conf.d/02-beats-input.conf
 Delete all the contents and replace them with the following configuration
input {
    tcp {
        port => 5044
        codec => json_lines

    }

}
output{
    elasticsearch {
    hosts => ["localhost:9200"]

    }

}

5. restart docker Container (approx. 5 minutes)-10 Minutes, waiting for service restart)
docker restart elk

6. visit Kibana
http://localhost:5601/
4.2 configuration
Mainly with the help of logstash component
Dependency:
<!-- logstash-->
<dependency>
    <groupId>net.logstash.logback</groupId>
    <artifactId>logstash-logback-encoder</artifactId>
    <version>5.2</version>
</dependency>
logback-spring.xml configuration
LogstashTcpSocketAppender is mainly used
<?xml version="1.0" encoding="UTF-8"?>
<configuration debug="false">
    <!--Introduce color, print log with color, use%clr() Wrapped in logs-->
    <include resource="org/springframework/boot/logging/logback/defaults.xml" />
    <springProperty scope="context" name="springAppName"
                    source="spring.application.name" />
    <!--Set storage path variable-->
    <property name="LOG_HOME" value="./log"/>
    <!--Format output:%d Indicates the date,%thread Represents the thread name,%-5level: The level is displayed 5 characters wide from the left%msg: Log messages,%n Is a newline character-->
        <Property name="LOG_PATTERN" value="%d{yyyy-MM-dd hh:mm:ss.SSS} | %-5level | ${springAppName:-} | %X{X-B3-TraceId:-} | %X{X-B3-SpanId:-} | %clr(${LOG_LEVEL_PATTERN:-%5p})|%clr(${PID:- }){magenta}| [%t] |%logger{50} | %L | : %msg%n"/>

    <!--console output  appender-->
    <appender name="console" class="ch.qos.logback.core.ConsoleAppender">
        <!--Format output-->
        <encoder class="ch.qos.logback.classic.encoder.PatternLayoutEncoder">
            <!--Format output:%d Indicates the date,%thread Represents the thread name,%-5level: The level is displayed 5 characters wide from the left%msg: Log messages,%n Is a newline character-->
            <pattern>${LOG_PATTERN}</pattern>
            <!--Set encoding-->
            <charset>UTF-8</charset>
        </encoder>
    </appender>
    <!-- by logstash Output JSON Formatted Appender -->
    <appender name="logstash"
              class="net.logstash.logback.appender.LogstashTcpSocketAppender">
        <destination>192.168.0.109:5044</destination>
        <!-- Log output code -->
        <encoder
                class="net.logstash.logback.encoder.LoggingEventCompositeJsonEncoder">
            <providers>
                <timestamp>
                    <timeZone>UTC</timeZone>
                </timestamp>
                <pattern>
                    <pattern>
                        {
                        "datetime":"%d{yyyy-MM-dd hh:mm:ss.SSS}",
                        "level": "%-5level",
                        "serviceName": "${springAppName:-}",
                        "trace": "%X{X-B3-TraceId:-}",
                        "span": "%X{X-B3-SpanId:-}",
                        "code":"${LOG_LEVEL_PATTERN:-%5p}",
                        "pid": "${PID:-}",
                        "thread": "%thread",
                        "class": "%logger{50}",
                        "message": "%message"
                        }
                    </pattern>
                </pattern>
            </providers>
        </encoder>
    </appender>

    <!--Specifies the underlying log output level-->
    <root level="INFO">
        <!--appender Will be added to this loger-->
        <appender-ref ref="console"/>
        <appender-ref ref="logstash" />
    </root>
</configuration>
< destination > 192.168.0.109:5044 < / destination > specify the address of logstash, and the rest are automatically synchronized to es displayed in kibana by elk.
Everything is ready, start calling
Log printing.

Visit Kibana and enter the discover page

The configuration of service A here is different from that of service B.
It can be seen that we can transfer a single information to the es, or package and record all the information to the es. But a single information record is more suitable for searching.