sklearn.datasets module mainly provides some methods of importing, downloading online and generating datasets locally. You can view them through dir or help command. We will find that there are three main forms: load < dataset name >, fetch < dataset name > and make < dataset
① Datasets. Load < datasets ﹤ name >: small datasets of sklearn package
- In [2]: datasets.load_*?
- datasets.load_boston#Boston house price data set
- datasets.load_breast_cancer#Breast cancer data set
- datasets.load_diabetes#Diabetes data set
- datasets.load_digits#Handwritten digit data set
- datasets.load_files
- datasets.load_iris#Iris data set
- datasets.load_lfw_pairs
- datasets.load_lfw_people
- datasets.load_linnerud#Fitness training data set
- datasets.load_mlcomp
- datasets.load_sample_image
- datasets.load_sample_images
- datasets.load_svmlight_file
- datasets.load_svmlight_files
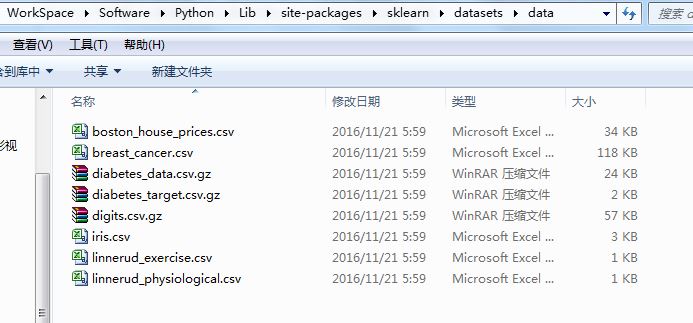
The dataset file is under datasets\data in the sklearn installation directory
② Datasets. Fetch < dataset ﹤ name >: large datasets, mainly used for testing and solving practical problems, supporting online download
- In [3]: datasets.fetch_*?
- datasets.fetch_20newsgroups
- datasets.fetch_20newsgroups_vectorized
- datasets.fetch_california_housing
- datasets.fetch_covtype
- datasets.fetch_kddcup99
- datasets.fetch_lfw_pairs
- datasets.fetch_lfw_people
- datasets.fetch_mldata
- datasets.fetch_olivetti_faces
- datasets.fetch_rcv1
- datasets.fetch_species_distributions
The downloaded data is saved in ~ / scikit ﹣ learn ﹣ data folder by default. You can modify the path by setting the environment variable scikit ﹣ learn ﹣ data, and obtain the download path by datasets. Get ﹣ data ﹣ home()
- In [5]: datasets.get_data_home()
- Out[5]: 'G:\\datasets'
③ datasets.make?: construct datasets
- In [4]: datasets.make_*?
- datasets.make_biclusters
- datasets.make_blobs
- datasets.make_checkerboard
- datasets.make_circles
- datasets.make_classification
- datasets.make_friedman1
- datasets.make_friedman2
- datasets.make_friedman3
- datasets.make_gaussian_quantiles
- datasets.make_hastie_10_2
- datasets.make_low_rank_matrix
- datasets.make_moons
- datasets.make_multilabel_classification
- datasets.make_regression
- datasets.make_s_curve
- datasets.make_sparse_coded_signal
- datasets.make_sparse_spd_matrix
- datasets.make_sparse_uncorrelated
- datasets.make_spd_matrix
- datasets.make_swiss_roll
Take the make ou expression() function as an example. First, look at the function syntax:
make_regression(n_samples=100, n_features=100, n_informative=10, n_targets=1, bias=0.0, effective_rank=None, tail_strength=0.5, noise=0.0, shuffle=True, coef=False, random_state=None)
Parameter Description:
n_samples: number of samples
N? Features: number of features (number of independent variables)
N ﹐ informative: the number of relevant features (the number of relevant independent variables) is the number of features involved in building the model
n_targets: number of dependent variables
bias: deviation (intercept)
Coef: output coef ID or not
- In [7]: data = datasets.make_regression(5,3,2,2,1.0,coef=True)
- ...: data
- ...:
- Out[7]:
- (array([[-0.64470031, 2.24028402, -2.26147027],
- [-0.09554589, 1.4653344 , -0.8882202 ],
- [-1.36214673, 0.08935031, 0.66733545],
- [-1.30553824, 1.62553382, 0.65693763],
- [-0.81528358, 0.81659886, 1.32412053]]),
- array([[ 177.32114822, -42.34640341],
- [ 127.51997766, -1.98105497],
- [ -37.82547178, -104.69214796],
- [ 100.19123506, -95.62163254],
- [ 45.35860387, -59.94143654]]),
- array([[ 34.3135368 , 77.79161196],
- [ 88.57943632, 3.03795085],
- [ 0. , 0. ]]))
The above output results: the three arrays in the tuple correspond to input data X, output data y and coef respectively