Cell type annotation is a very important link in single cell research, which can be roughly divided into artificial annotation and software annotation.
(1) Manual annotation needs the help of literature retrieval marker or combined with common annotation database-
cellMarker(http://biocc.hrbmu.edu.cn/CellMarker/),
PanglaoDB(https://panglaodb.se/),
CancerSEA( http://biocc.hrbmu.edu.cn/CancerSEA/ )The advantage is that the accuracy is relatively good.
(2) Software automation annotation generally uses the built-in data set of the software for annotation, and the operation is relatively simple. However, the accuracy will be relatively poor, but it can be used as a good auxiliary annotation means.
There are many automatic annotation software. This time, I will briefly share how to use singleR for automatic annotation.
SingleR is an R package for automatic annotation of cell types for single-cell RNA SEQ sequencing (scrna SEQ) data (Aran et al.2019). The cells in the test data set are labeled and annotated according to the cell samples with known type labels as the reference data set.
A built-in database
The easiest way to use singler is to annotate cells with built-in references. Singler comes with 7 reference data sets, of which 5 are human data and 2 are mouse data: Blueprint encodedata blueprint (Martens and stunnenberg 2013) and encode (the encode project consortium 2012) (person) Databaseimmunecellexpressiondata the database for immunecell expression (/ eQTLs / epigenomics) (schmiedel et al. 2018) (person) Human primary cell atlas data the human primary cell Atlas (Mabbott et al. 2013) (person) Monaco immune data, Monaco immune cell data - gse107011 (Monaco et al. 2019) (person) Novershtern hematopoietic data novershtern hematopoietic cell data - gse24759 (person) ImmGenData the murine ImmGen (Heng et al. 2008) (rat) MouseRNAseqData a collection of mouse data sets downloaded from GEO (Benayoun et al. 2019)
II. Database, R package
2.1 installation of singler package
#if (!requireNamespace("BiocManager", quietly = TRUE))#    install.packages("BiocManager")

BiocManager::install("SingleR")
BiocManager::install("Seurat")
2.2 loading dataset, data
Loading the database may be slow. It is recommended to download the database and save it.
library(SingleR)library(celldex)
library(Seurat)
library(pheatmap)
##Download annotation database
hpca.se <- HumanPrimaryCellAtlasData()
hpca.se

#Directly load the downloaded database load("HumanPrimaryCellAtlas_hpca.se_human.RData")load("BlueprintEncode_bpe.se_human.RData")
2.3 viewing seurat results
use Single cell toolbox | Seurat official website standard process The obtained seurat results of pbmc,
(1) View seuret clustering results
load("pbmc_tutorial.RData")pbmc

meta=pbmc@meta.data #The meta file of pbmc contains the clustering results of seurat
head(meta)
                 orig.ident nCount_RNA nFeature_RNA percent.mt percent.HB RNA_snn_res.0.5 seurat_clusters   labelsAAACATACAACCAC-1     pbmc3k       2419          779  3.0177759          0               0               0  T_cellsAAACATTGAGCTAC-1     pbmc3k       4903         1352  3.7935958          0               3               3   B_cellAAACATTGATCAGC-1     pbmc3k       3147         1129  0.8897363          0               2               2  T_cellsAAACCGTGCTTCCG-1     pbmc3k       2639          960  1.7430845          0               1               1 MonocyteAAACCGTGTATGCG-1     pbmc3k        980          521  1.2244898          0               6               6  NK_cellAAACGCACTGGTAC-1     pbmc3k       2163          781  1.6643551          0               2               2  T_cells
(2) View umap and tsne diagrams
plot1 <- DimPlot(pbmc, reduction = "umap", label = TRUE)
plot2<-DimPlot(pbmc, reduction = "tsne",
               label = TRUE)
plot1 + plot2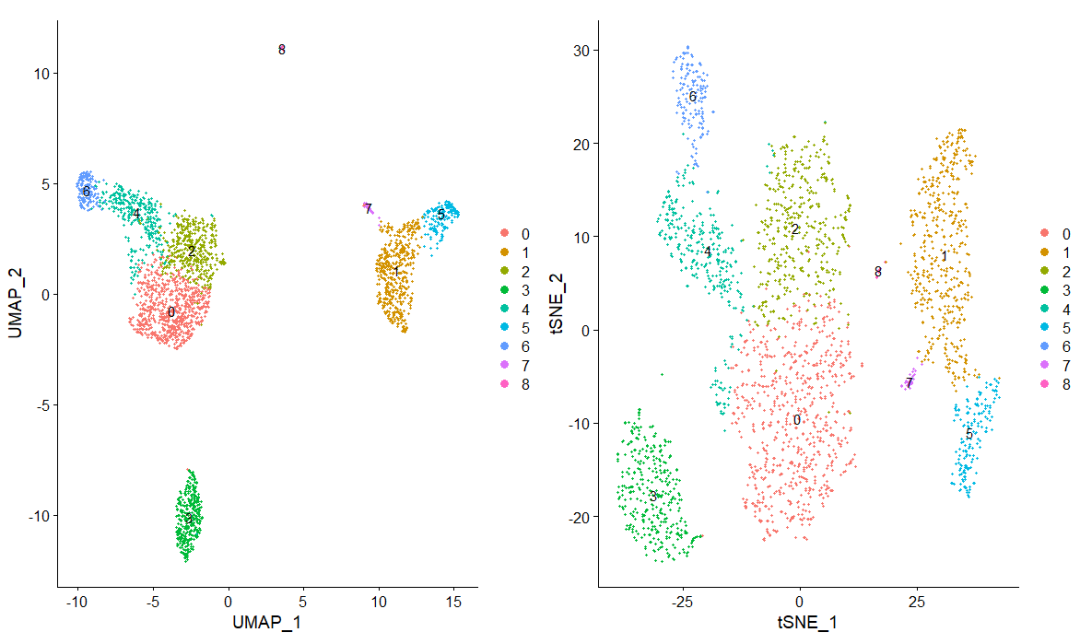
III. singleR notes
3.1 single r uses built-in dataset annotation
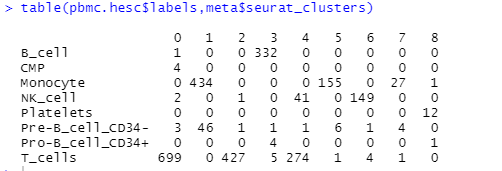
#Single r annotation
pbmc_for_SingleR <- GetAssayData(pbmc, slot="data") ##Get standardization matrix
pbmc.hesc <- SingleR(test = pbmc_for_SingleR, ref = hpca.se, labels = hpca.se$label.main) #
pbmc.hesc

#table of seurat and singleR
table(pbmc.hesc$labels,meta$seurat_clusters)
3.2 drawing umap/tsne diagram
pbmc@meta.data$labels <-pbmc.hesc$labels
print(DimPlot(pbmc, group.by = c("seurat_clusters", "labels"),reduction = "umap"))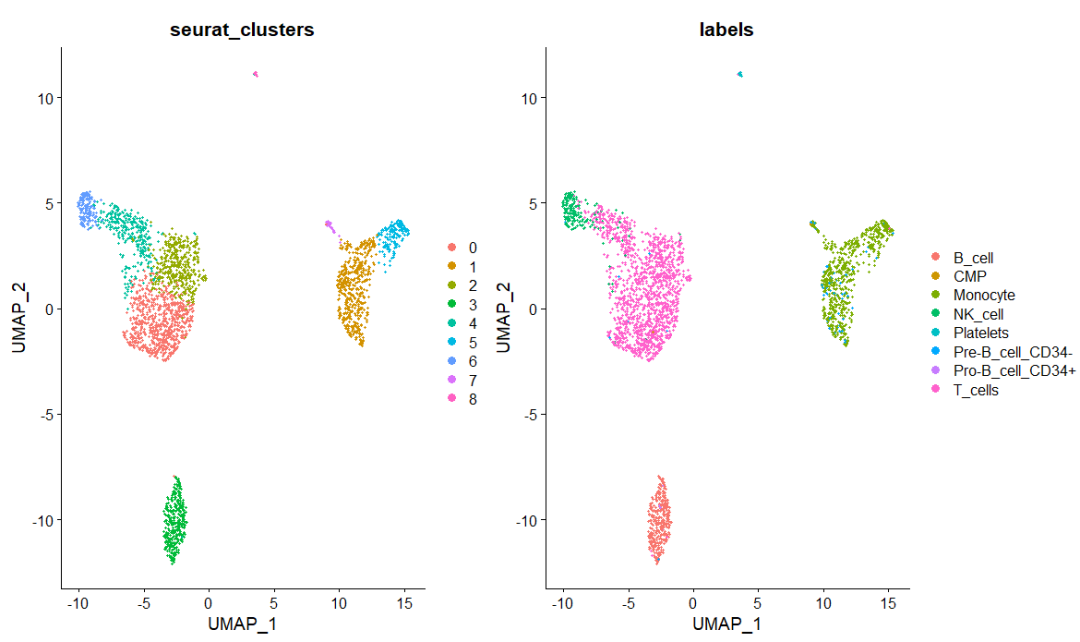
3.3 using multiple database annotations
The BP and HPCA databases are used for comprehensive annotation, and the list function is used to read multiple databases
pbmc3 <- pbmcpbmc3.hesc <- SingleR(test = pbmc_for_SingleR, ref = list(BP=bpe.se, HPCA=hpca.se),
                      labels = list(bpe.se$label.main, hpca.se$label.main))
table(pbmc3.hesc$labels,meta$seurat_clusters)

pbmc3@meta.data$labels <-pbmc3.hesc$labels

print(DimPlot(pbmc3, group.by = c("seurat_clusters", "labels"),reduction = "umap"))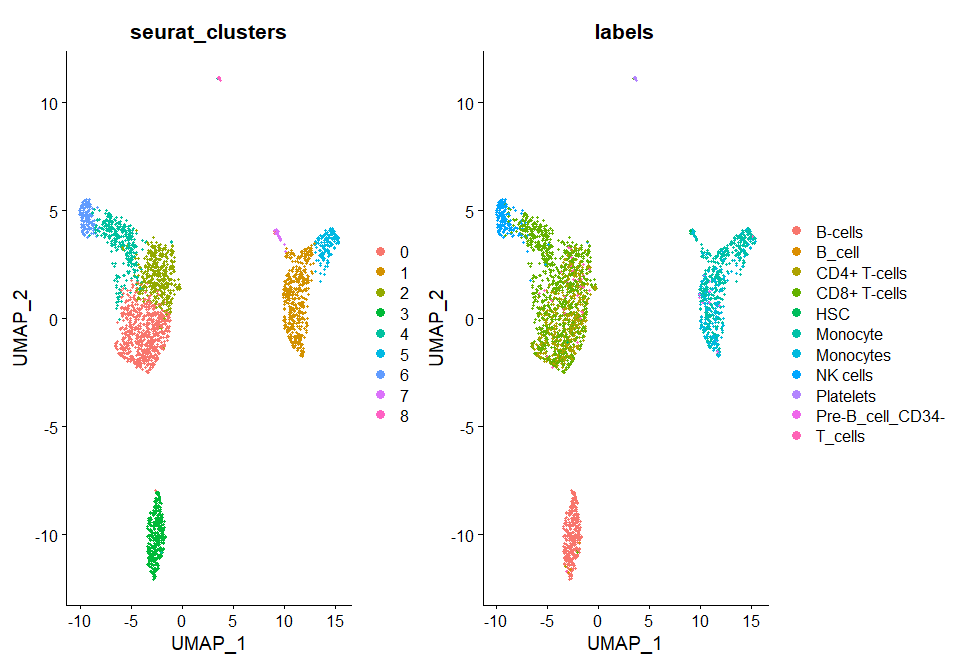
You can see more cell types that hpca doesn't notice.
IV. annotation result diagnosis
4.1 based on scores within cells
print(plotScoreHeatmap(pbmc.hesc))
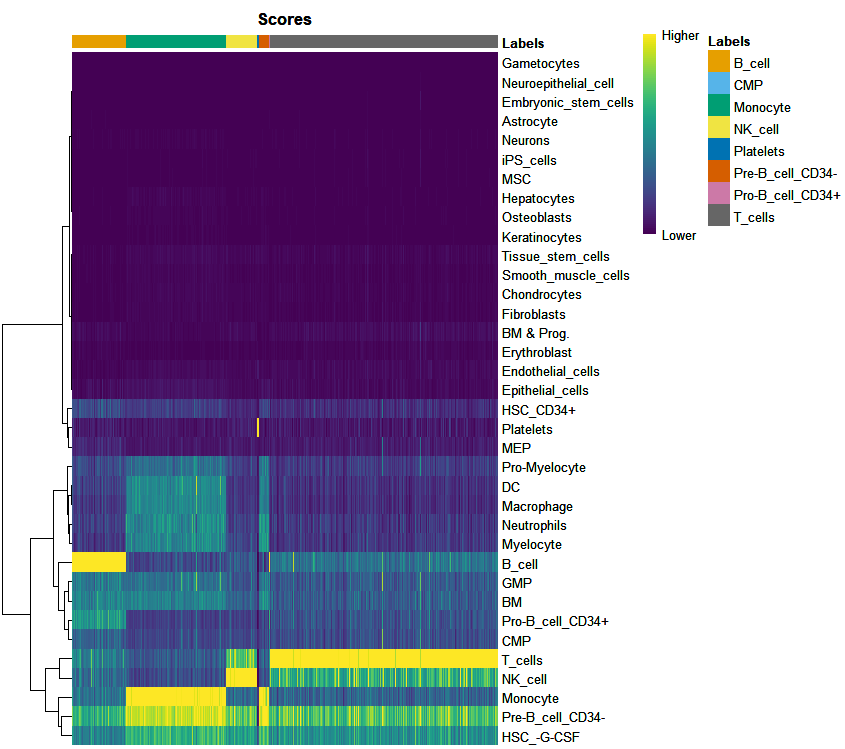
The score of cells in one label is significantly higher than that in other labels, and the annotation results are clear.
4.2 per cell "deltas" based diagnosis
plotDeltaDistribution(pbmc.hesc, ncol = 3)
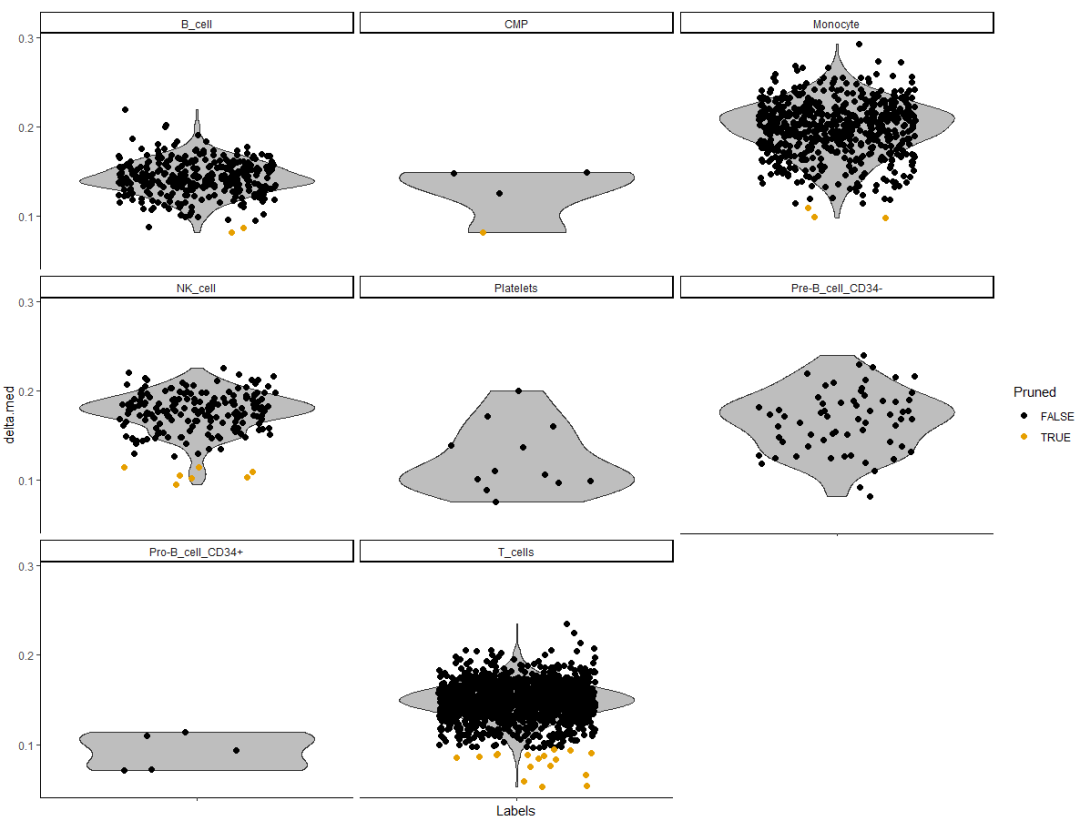
The Delta value is low, indicating that the annotation result is not very clear.
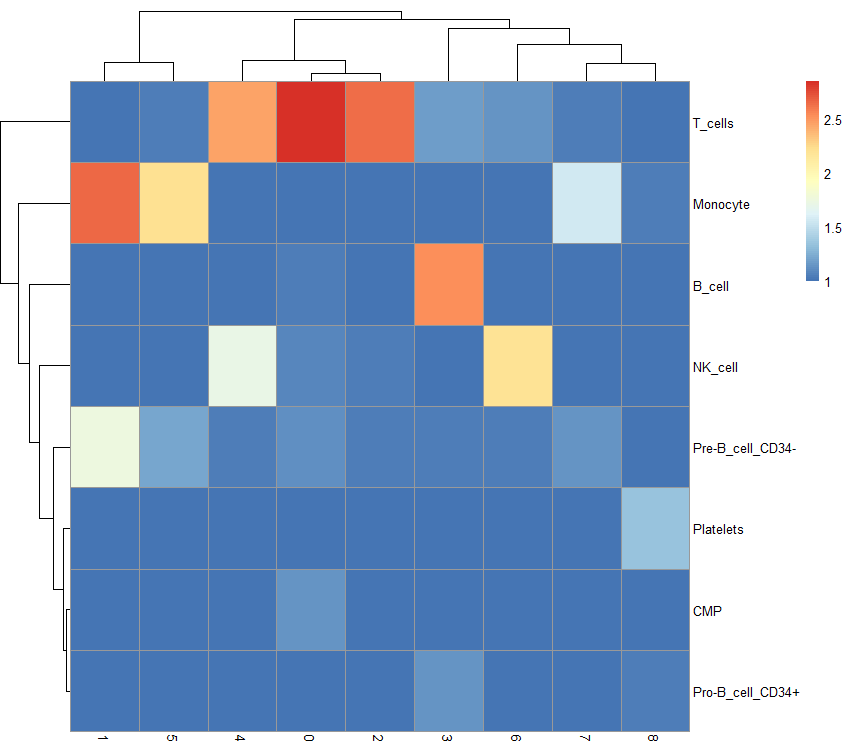
4.3 comparison with cluster results
tab <- table(label = pbmc.hesc$labels,             cluster = meta$seurat_clusters)

pheatmap(log10(tab + 10))
reference material:
https://www.bioconductor.org/packages/release/bioc/vignettes/SingleR/inst/doc/SingleR.html