1, Analysis of current architecture problems
1.1 problem analysis
Our current architecture is shown in the figure below. Eureka is used for service discovery service registration, and Ribbon is used for load balancing. Now let's assume that if the service provider's response is very slow, the service consumer's request to the service provider will be forced to wait until the http request times out, and then an exception will be thrown. In the high load scenario, if we do not do any processing, this problem is likely to cause all threads processing user requests to be exhausted, and can not respond to further user requests.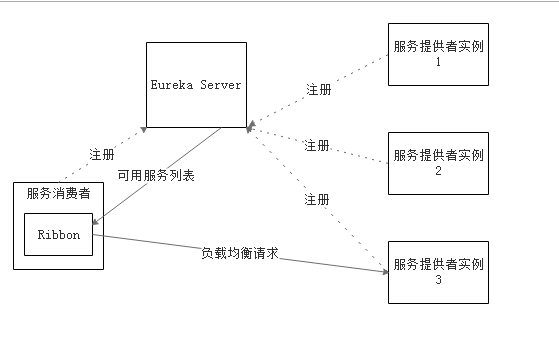
1.2 avalanche effect
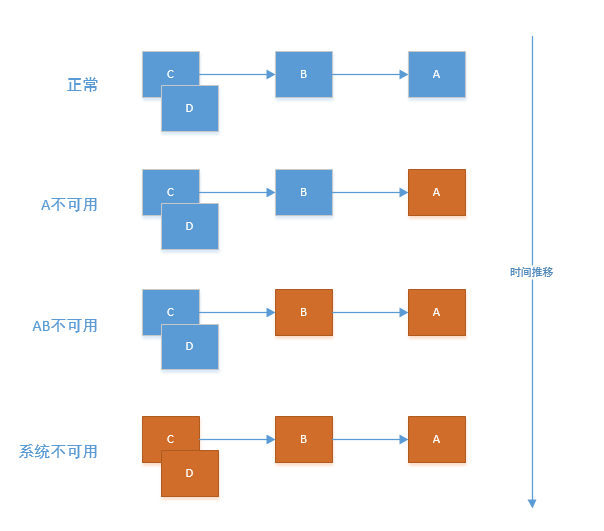
In the microservice architecture, there are usually multiple service layer calls, a large number of microservices communicate through the network, thus supporting the whole system. There are also a lot of dependencies between various micro services. However, any service is not 100% available, and the network is often vulnerable, so it is inevitable that some requests will fail. The failure of basic service leads to cascading failure, which leads to the unavailability of the whole system. This phenomenon is called service avalanche effect. Service avalanche effect describes a process in which the unavailability of service providers leads to the unavailability of service consumers, and the unavailability is gradually amplified.
As shown in the figure below, a is the service provider, B is the service consumer of a, and C and D are the service consumers of B. A unavailability causes B unavailability, and the avalanche effect is formed when the unavailability is amplified to C and d like a snowball.
1.3 solutions
1.3.1 timeout mechanism
Timeout must be set when requesting other services over the network. Normally, a remote call returns in tens of milliseconds. When dependent services are unavailable, or due to network problems, the response time will be very long (tens of seconds). In general, a remote call corresponds to a thread / process. If the response is too slow, the thread / process will not be released. Threads / processes correspond to system resources. If a large number of threads / processes are not released, and the more they accumulate, the service resources will be exhausted, resulting in the unavailability of senior services. So a timeout must be set for each request.
1.3.2 circuit breaker mode
The circuit breaker mode can be compared to the switch in the home. If there is no switch when the current is overloaded (such as excessive power, short circuit, etc.), if the circuit continues to open, the circuit will heat up, causing the circuit to burn out or fire, etc. With the switch, when the current is overloaded, it will trip automatically, so as to protect the safety of the whole circuit. When the problem of current overload is solved, as long as the switch is closed, the circuit can work normally again.
Similarly, in the server, when the dependent service (service provider) experiences a large number of timeout situations, it is no longer meaningful to let new requests access, only consuming existing resources. For example, we set the timeout to 1 second. If a large number of requests (such as 50 requests) are not responded within 1 second in a short time, it often means an exception. There is no need for more requests to access this dependency at this time. We should use circuit breakers to avoid resource waste.
The circuit breaker can realize fast failure. If it detects many similar errors (such as timeout) in a period of time, it will force its subsequent multiple calls to fail quickly, and no longer request the services it depends on, so as to prevent the application from constantly trying to perform the operations that may fail, so that the application can continue to execute without waiting for the error to be corrected, or waste C Pu time to wait for a long timeout. The circuit breaker also enables the application to diagnose whether the error has been fixed, and if so, the application attempts to invoke the operation again.
The circuit breaker consists of three states of opening, half opening and closing.
Under normal condition, it is in closed state, if abnormal circuit breaker is opened. After the circuit breaker is opened for a certain time, it will enter the half open state to detect whether the service returns to normal. If not, it will return to the open state, and it will return to the half open state after a certain time. If the service is detected to be normal, it turns off.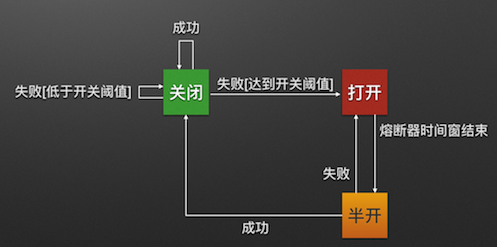
2, Introduction to Hystrix
Hystrix is a delay and fault-tolerant library, which can control the interaction between distributed services by adding delay tolerance and fault-tolerant logic. Hystrix achieves this by isolating access points between services, stopping cascading failures between services, and providing backup options, all of which can improve the overall flexibility of the system.
The role of Hystrix:
- Provides protection through a third-party client library and controls the failure of latency and failure dependencies.
- Stop cascading failures in complex distributed systems.
- Quick failure, quick recovery.
- Fallback and normal degradation where possible.
- Enables near real-time monitoring, alerting, and operational control.
How Hystrix works:
- Wrap request: wraps all calls to an external system (or "dependency") in a HystrixCommand or hystrixobservercommand object that is usually executed in a separate thread (this is an example of a command pattern).
- Resource isolation: maintains a small thread pool (or semaphore) for each dependency; if it is full, requests to that dependency will be rejected immediately, rather than queued or quickly failed.
- Real time monitoring: almost real-time monitoring of indicators and configuration changes. Measure success, failure (exception thrown by client), timeout, and thread rejection.
- Breaker: if the error percentage of a service exceeds the threshold, trip the breaker to manually or automatically stop all requests for a specific service over a period of time.
- Fallback mechanism: performs fallback logic when the request fails, is rejected, times out or is short circuited.
- Self repair: after opening the circuit breaker for a certain period of time, it will enter the half open state to detect whether the service returns to normal. If not, it will return to the open state, and it will return to the half open state after a certain period of time. If the service is detected to be normal, it turns off.
3, Hystrix in action - add hystrix to service consumers
3.1 add dependency to POM file
Find the pom file of the parent project of the service consumer and add the dependency of hystrix. (for readers with questions about project construction, please see my previous blog in spring cloud column)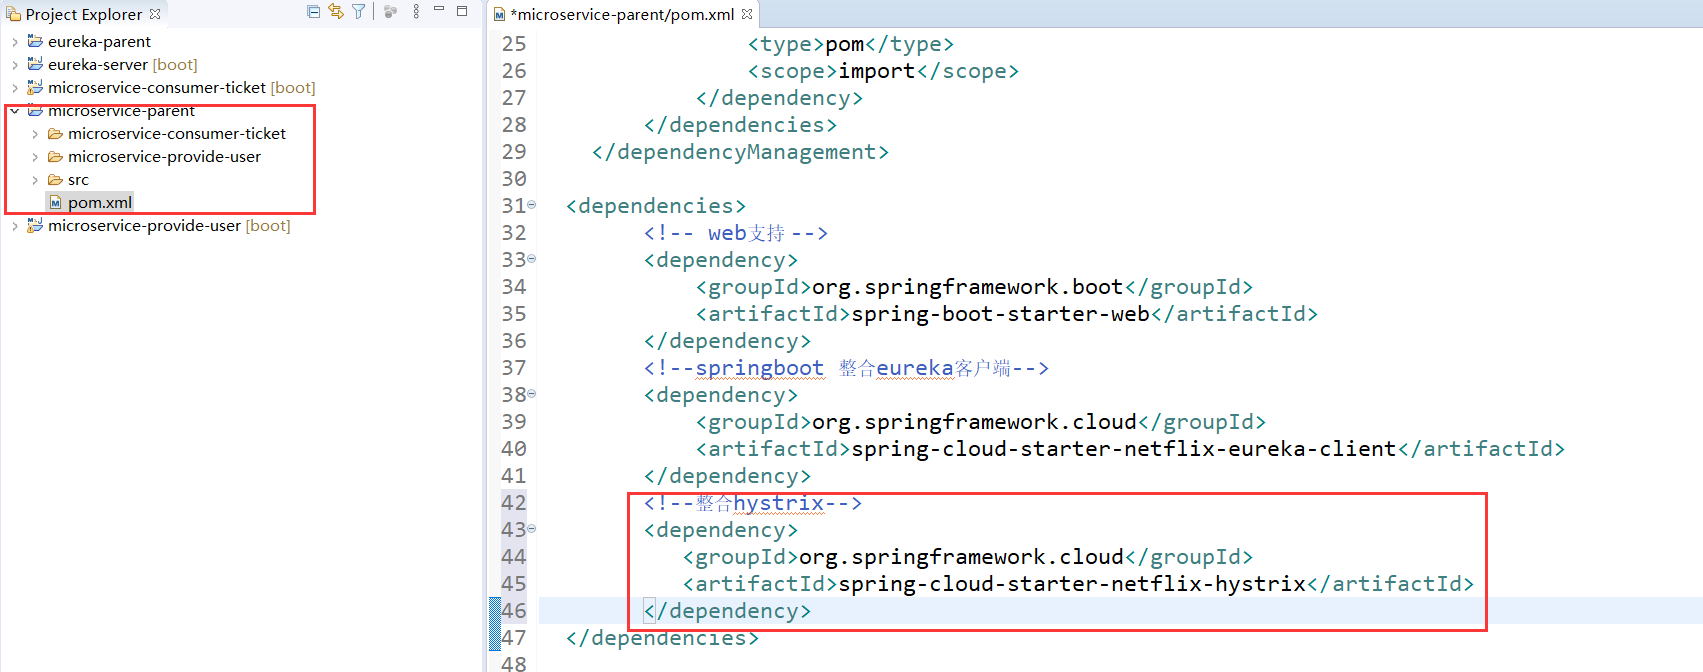
<project xmlns="http://maven.apache.org/POM/4.0.0" xmlns:xsi="http://www.w3.org/2001/XMLSchema-instance" xsi:schemaLocation="http://maven.apache.org/POM/4.0.0 https://maven.apache.org/xsd/maven-4.0.0.xsd">
  <modelVersion>4.0.0</modelVersion>
  <parent>
		<groupId>org.springframework.boot</groupId>
		<artifactId>spring-boot-starter-parent</artifactId>
		<version>2.0.3.RELEASE</version>
  </parent>

  <groupId>com.springcloud</groupId>
  <artifactId>microservice-parent</artifactId>
  <version>0.0.1-SNAPSHOT</version>
  <packaging>pom</packaging>
  <modules>
  	<module>microservice-provide-user</module>
  	<module>microservice-consumer-ticket</module>
  </modules>

  <dependencyManagement>
        <dependencies>
            <!-- Import Spring Cloud Dependency management for -->
            <dependency>
                <groupId>org.springframework.cloud</groupId>
                <artifactId>spring-cloud-dependencies</artifactId>
                <version>Finchley.SR4</version>
                <type>pom</type>
                <scope>import</scope>
            </dependency>
        </dependencies>
    </dependencyManagement>

  <dependencies>
  		<!-- web Support -->
		<dependency>
			<groupId>org.springframework.boot</groupId>
			<artifactId>spring-boot-starter-web</artifactId>
		</dependency>
		<!--springboot integration eureka Client-->
        <dependency>
            <groupId>org.springframework.cloud</groupId>
            <artifactId>spring-cloud-starter-netflix-eureka-client</artifactId>
        </dependency>
        <!--integration hystrix-->
		<dependency>
		   <groupId>org.springframework.cloud</groupId>
		   <artifactId>spring-cloud-starter-netflix-hystrix</artifactId>
		</dependency>
  </dependencies>

  <build>
	  <plugins>
		  <!-- Resource file copy plug-in -->
		  <plugin>
			  <groupId>org.apache.maven.plugins</groupId>
			  <artifactId>maven-resources-plugin</artifactId>
			  <configuration>
				  <encoding>UTF-8</encoding>
			  </configuration>
			  </plugin>
          <!-- springboot Plug-in unit -->
          <plugin>
			  <groupId>org.springframework.boot</groupId>
			  <artifactId>spring-boot-maven-plugin</artifactId>
		  </plugin>
	  </plugins>
  </build>
</project>
3.2 modify service method of service consumer (ticket micro service)
3.2.1 add annotation @ HystrixCommand
Annotate methods that require fault tolerance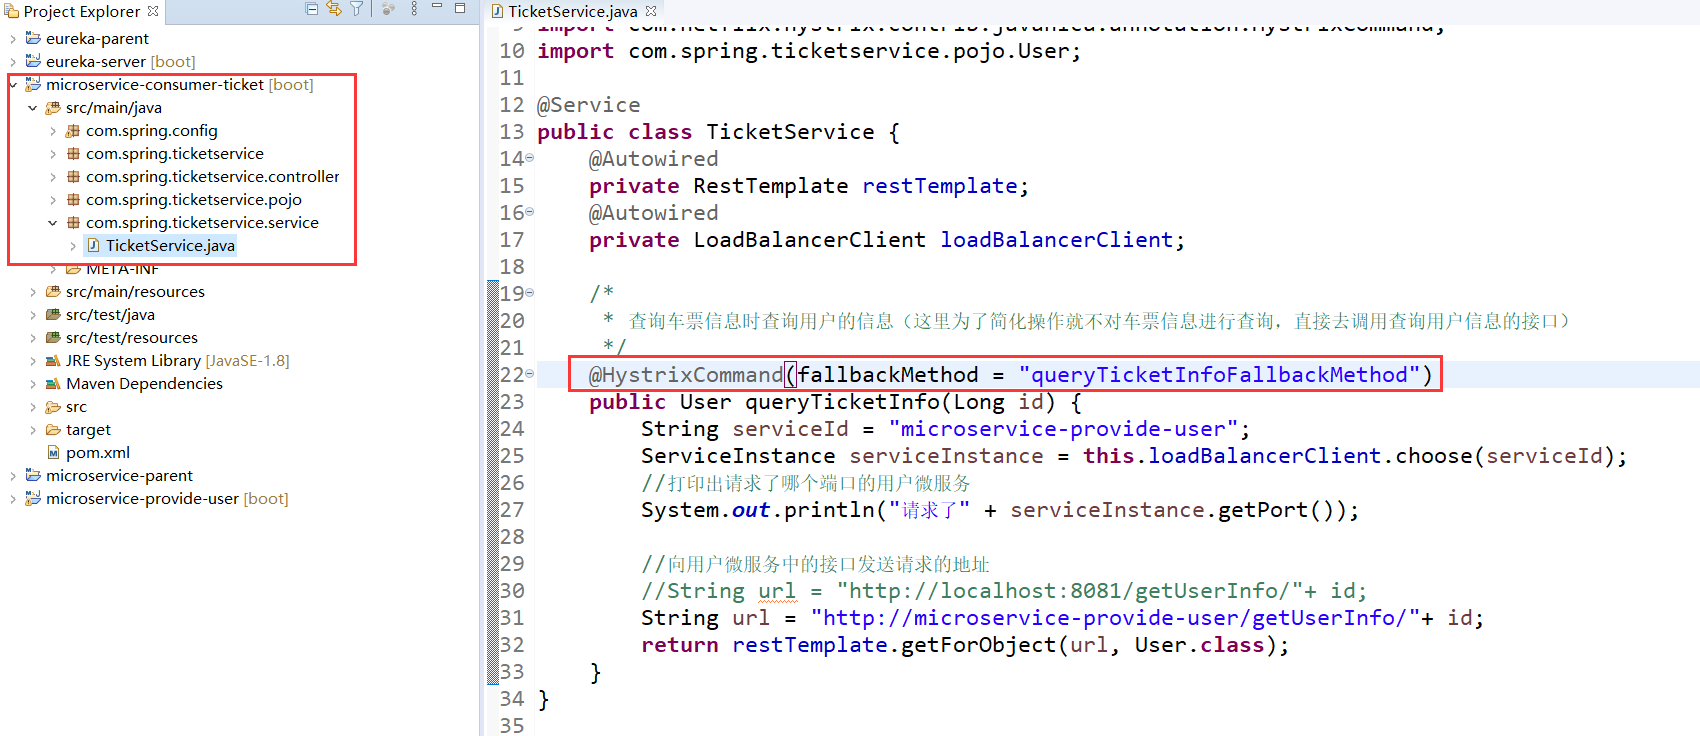
3.2.2 write a fallback method to handle errors
Note that the method name should be consistent with the method name defined in the @ HystrixCommand annotation, and the return value and pass parameter should also be consistent with the original method.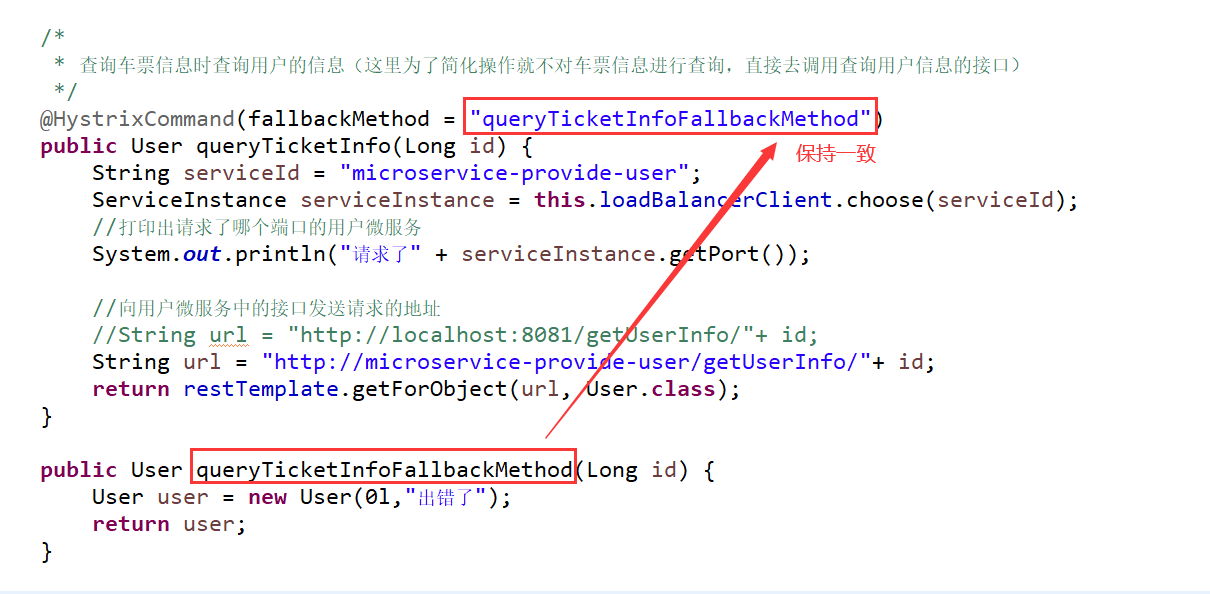
package com.spring.ticketservice.service;

import org.springframework.beans.factory.annotation.Autowired;
import org.springframework.cloud.client.ServiceInstance;
import org.springframework.cloud.client.loadbalancer.LoadBalancerClient;
import org.springframework.stereotype.Service;
import org.springframework.web.client.RestTemplate;

import com.netflix.hystrix.contrib.javanica.annotation.HystrixCommand;
import com.spring.ticketservice.pojo.User;

@Service
public class TicketService {
	@Autowired
    private RestTemplate restTemplate;
	@Autowired
	private LoadBalancerClient loadBalancerClient;

	/*
	 * Query the user's information when querying the ticket information (in order to simplify the operation, we do not query the ticket information, but directly call the interface to query the user's information)
	 */
	@HystrixCommand(fallbackMethod = "queryTicketInfoFallbackMethod")
	public User queryTicketInfo(Long id) {
		String serviceId = "microservice-provide-user";
		ServiceInstance serviceInstance = this.loadBalancerClient.choose(serviceId);
		//Print out the user microservice of which port is requested
		System.out.println("Request." + serviceInstance.getPort());

		//Address to send the request to the interface in the user microservice
		//String url = "http://localhost:8081/getUserInfo/"+ id;
		String url = "http://microservice-provide-user/getUserInfo/"+ id;
		return restTemplate.getForObject(url, User.class);
	}
	/*
	 * Method of processing request failure
	 */
	public User queryTicketInfoFallbackMethod(Long id) {
		User user = new User(0l,"Error");
		return user;
	}
}
3.3 modify the startup class of service consumers (ticket micro service)
Add annotation @ EnableCircuitBreaker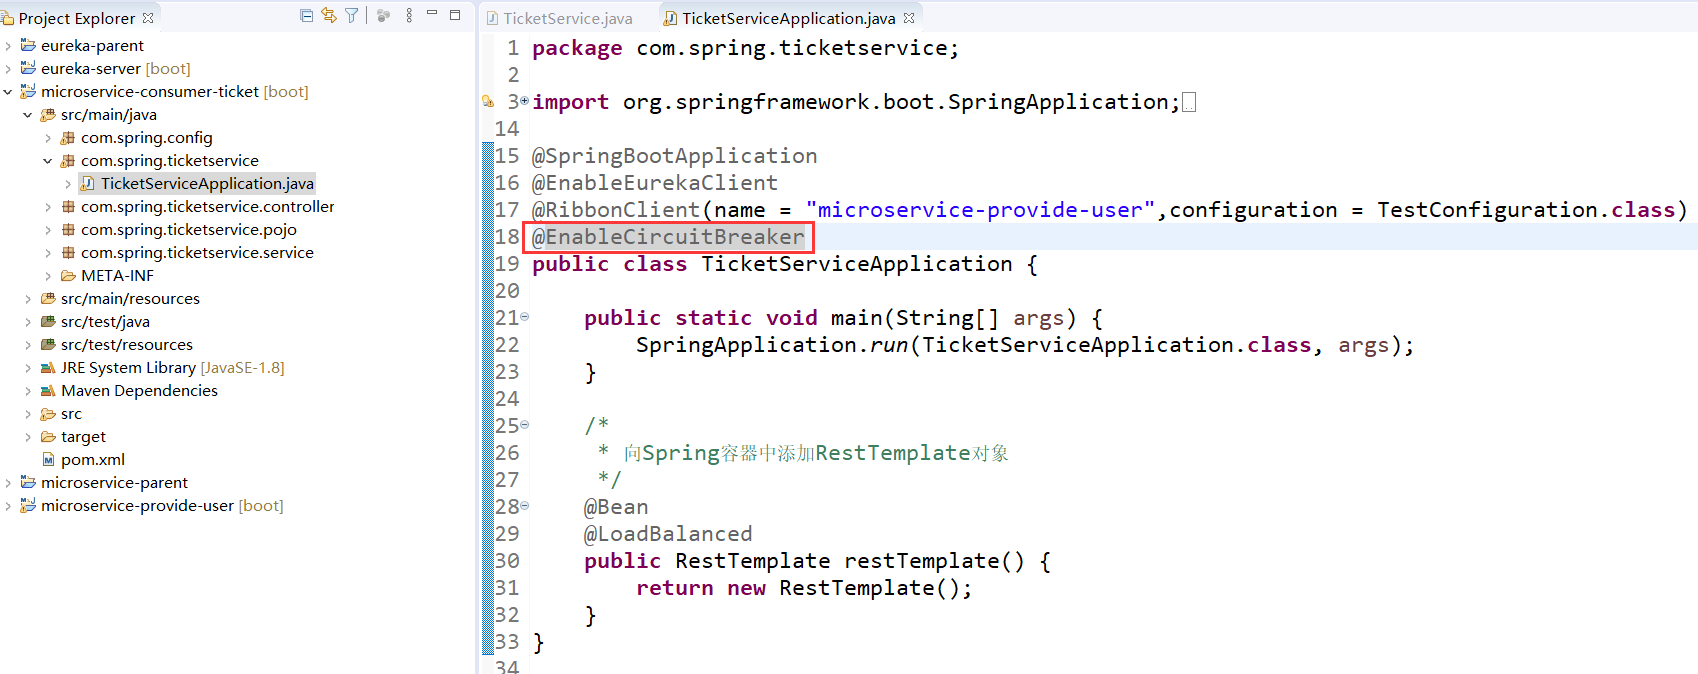
package com.spring.ticketservice;

import org.springframework.boot.SpringApplication;
import org.springframework.boot.autoconfigure.SpringBootApplication;
import org.springframework.cloud.client.circuitbreaker.EnableCircuitBreaker;
import org.springframework.cloud.client.loadbalancer.LoadBalanced;
import org.springframework.cloud.netflix.eureka.EnableEurekaClient;
import org.springframework.cloud.netflix.ribbon.RibbonClient;
import org.springframework.context.annotation.Bean;
import org.springframework.web.client.RestTemplate;

import com.spring.config.TestConfiguration;

@SpringBootApplication
@EnableEurekaClient
@RibbonClient(name = "microservice-provide-user",configuration = TestConfiguration.class)
@EnableCircuitBreaker
public class TicketServiceApplication {

	public static void main(String[] args) {
		SpringApplication.run(TicketServiceApplication.class, args);
	}

	/*
	 * Add RestTemplate object to Spring container
	 */
	@Bean
	@LoadBalanced
	public RestTemplate restTemplate() {
	    return new RestTemplate();
	}
}
3.4 start service for testing
We started Eureka service, user micro service and ticket micro service.
Visit eureka and you can see that the two services are started successfully and start testing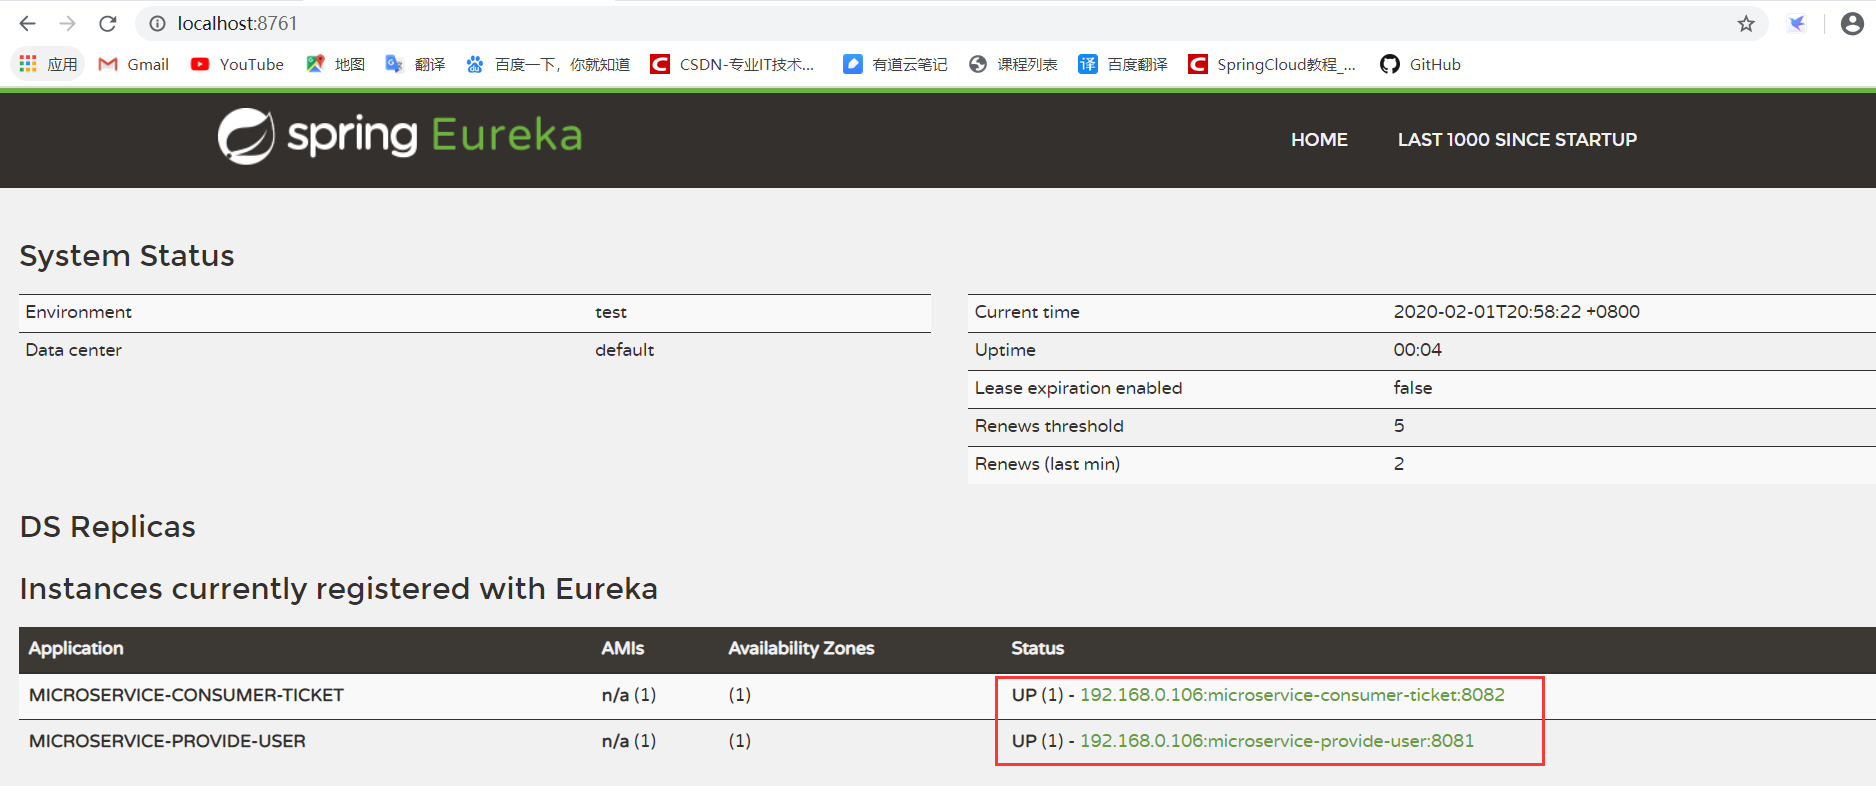
Visit the interface http://localhost:8082/getTicketInfo/1 of ticket microservice, and you can see that it is normal now.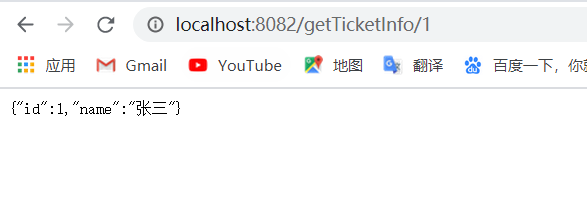
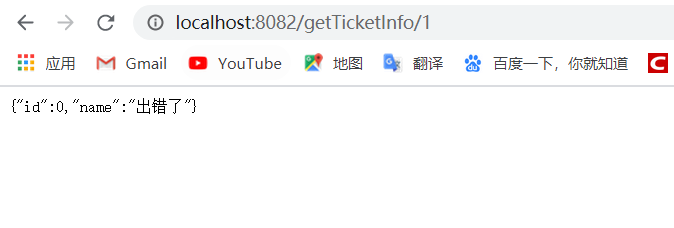
Close the user microservice and visit the interface again. You can see the execution force of our custom fallback method, which returns a user object whose name is in error. It shows that hystrix plays a role,
4, Health Indicator and Metrics Stream of Hystrix
4.1 add dependency to POM file
Find the pom file of the service consumer's parent project and add the dependency of health monitoring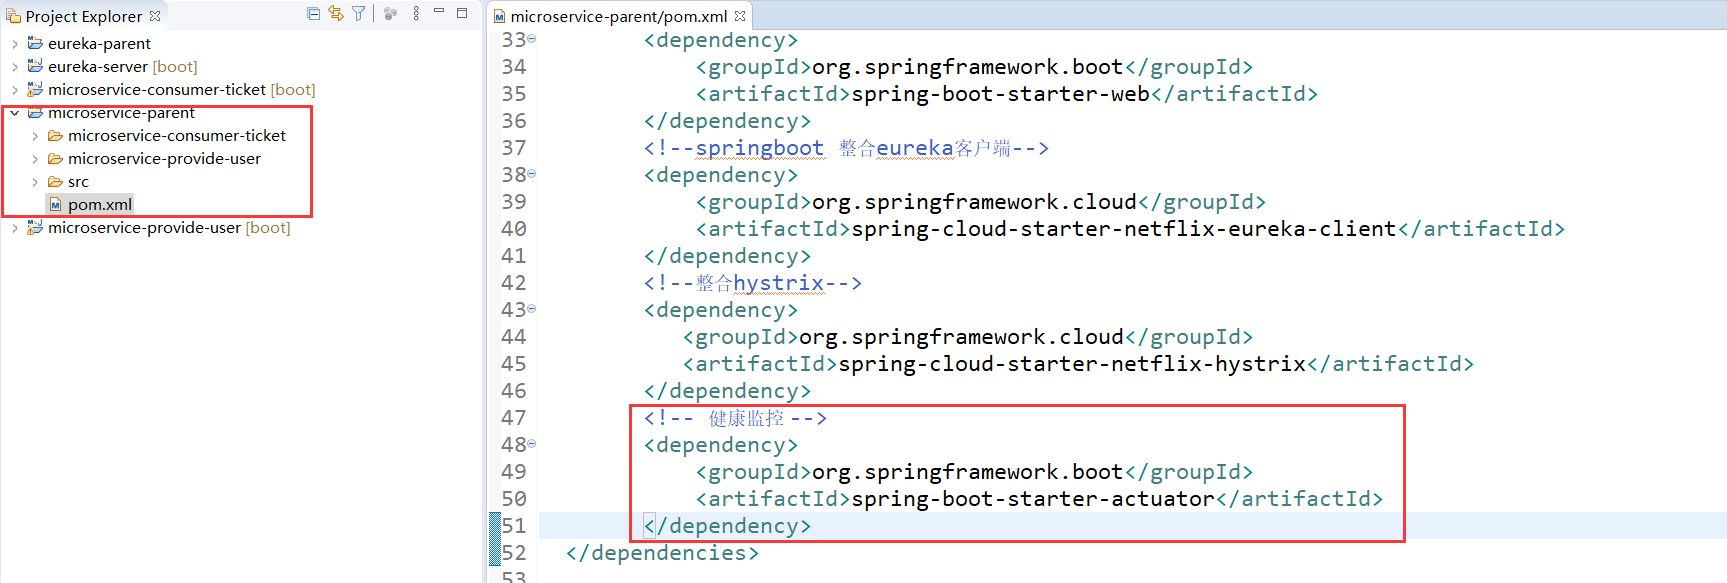
<project xmlns="http://maven.apache.org/POM/4.0.0" xmlns:xsi="http://www.w3.org/2001/XMLSchema-instance" xsi:schemaLocation="http://maven.apache.org/POM/4.0.0 https://maven.apache.org/xsd/maven-4.0.0.xsd">
  <modelVersion>4.0.0</modelVersion>
  <parent>
		<groupId>org.springframework.boot</groupId>
		<artifactId>spring-boot-starter-parent</artifactId>
		<version>2.0.3.RELEASE</version>
  </parent>

  <groupId>com.springcloud</groupId>
  <artifactId>microservice-parent</artifactId>
  <version>0.0.1-SNAPSHOT</version>
  <packaging>pom</packaging>
  <modules>
  	<module>microservice-provide-user</module>
  	<module>microservice-consumer-ticket</module>
  </modules>

  <dependencyManagement>
        <dependencies>
            <!-- Import Spring Cloud Dependency management for -->
            <dependency>
                <groupId>org.springframework.cloud</groupId>
                <artifactId>spring-cloud-dependencies</artifactId>
                <version>Finchley.SR4</version>
                <type>pom</type>
                <scope>import</scope>
            </dependency>
        </dependencies>
    </dependencyManagement>

  <dependencies>
  		<!-- web Support -->
		<dependency>
			<groupId>org.springframework.boot</groupId>
			<artifactId>spring-boot-starter-web</artifactId>
		</dependency>
		<!--springboot integration eureka Client-->
        <dependency>
            <groupId>org.springframework.cloud</groupId>
            <artifactId>spring-cloud-starter-netflix-eureka-client</artifactId>
        </dependency>
        <!--integration hystrix-->
		<dependency>
		   <groupId>org.springframework.cloud</groupId>
		   <artifactId>spring-cloud-starter-netflix-hystrix</artifactId>
		</dependency>
		<!-- Health monitoring -->
		<dependency>
        	<groupId>org.springframework.boot</groupId>
        	<artifactId>spring-boot-starter-actuator</artifactId>
    	</dependency>
  </dependencies>

  <build>
	  <plugins>
		  <!-- Resource file copy plug-in -->
		  <plugin>
			  <groupId>org.apache.maven.plugins</groupId>
			  <artifactId>maven-resources-plugin</artifactId>
			  <configuration>
				  <encoding>UTF-8</encoding>
			  </configuration>
			  </plugin>
          <!-- springboot Plug-in unit -->
          <plugin>
			  <groupId>org.springframework.boot</groupId>
			  <artifactId>spring-boot-maven-plugin</artifactId>
		  </plugin>
	  </plugins>
  </build>
</project>
4.2 modify the application.properties configuration file of the service consumer (ticket micro service)
By default, the actor / health node should be open, but in the process of my test, I found that 404 errors will be reported in the access, so I added management.endpoints.web.exposure.include = * to open all nodes.
If you only want to see the status of the hystrix circuit breaker, you do not need to configure to view the detailed health information management. Endpoint. Health. Show details = always.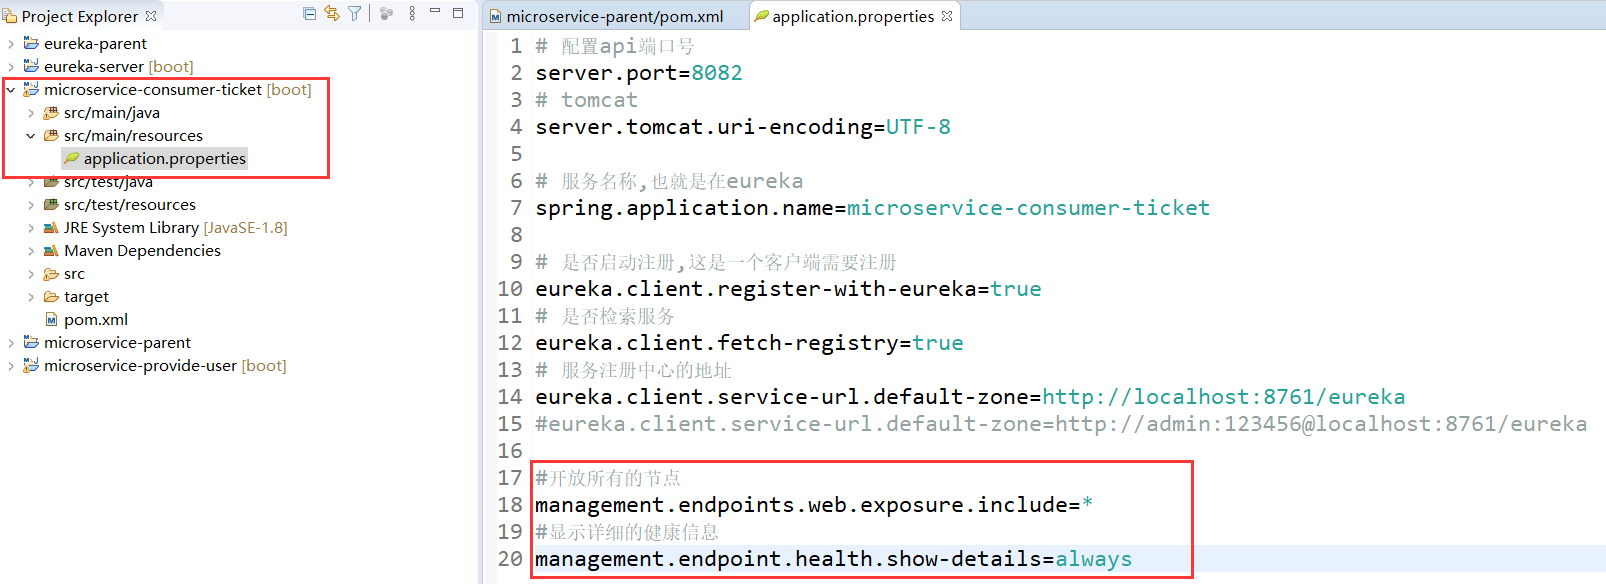
# Configure api port number
server.port=8082
# tomcat
server.tomcat.uri-encoding=UTF-8

# Service name,That is to say eureka
spring.application.name=microservice-consumer-ticket

# Start registration or not,This is a client that needs to register
eureka.client.register-with-eureka=true
# Retrieve service or not
eureka.client.fetch-registry=true
# Address of service registry
eureka.client.service-url.default-zone=http://localhost:8761/eureka
#eureka.client.service-url.default-zone=http://admin:123456@localhost:8761/eureka

#Open all nodes
management.endpoints.web.exposure.include=*
#Show detailed health information
management.endpoint.health.show-details=always
4.3 start service for testing
Launch eureka micro service and ticket micro service.
4.3.1 test Health Indicator
After accessing the ticket micro service port and adding actor / health, you can see that the detailed health information is printed out, including the operation of the service itself, whether the circuit breaker is open, etc.
4.3.2 testing Metrics Stream
Next, we visit actor / hystrix.stream to see the results. You can see that ping is always on the left. Metrics Stream is actually a monitoring of api interfaces, monitoring the status of each interface, and you can see that it has been refreshing.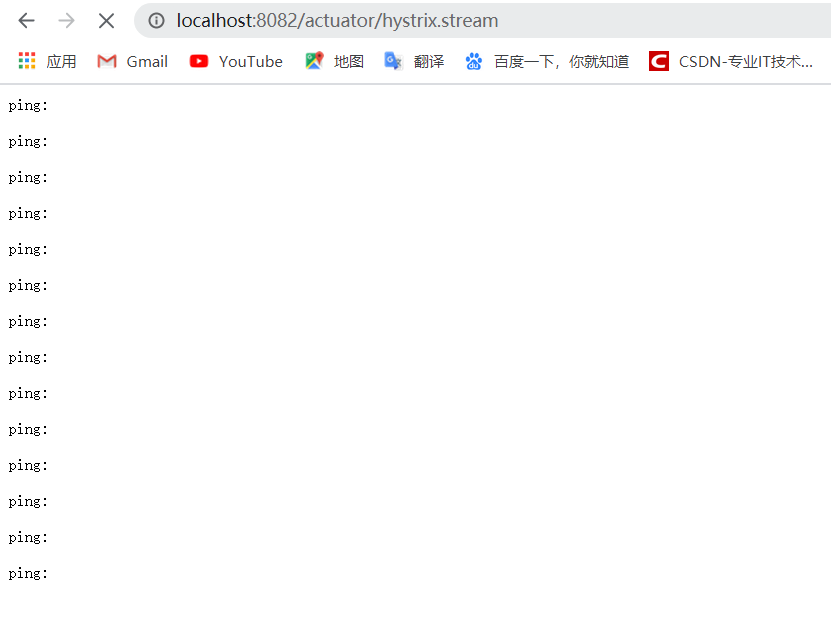
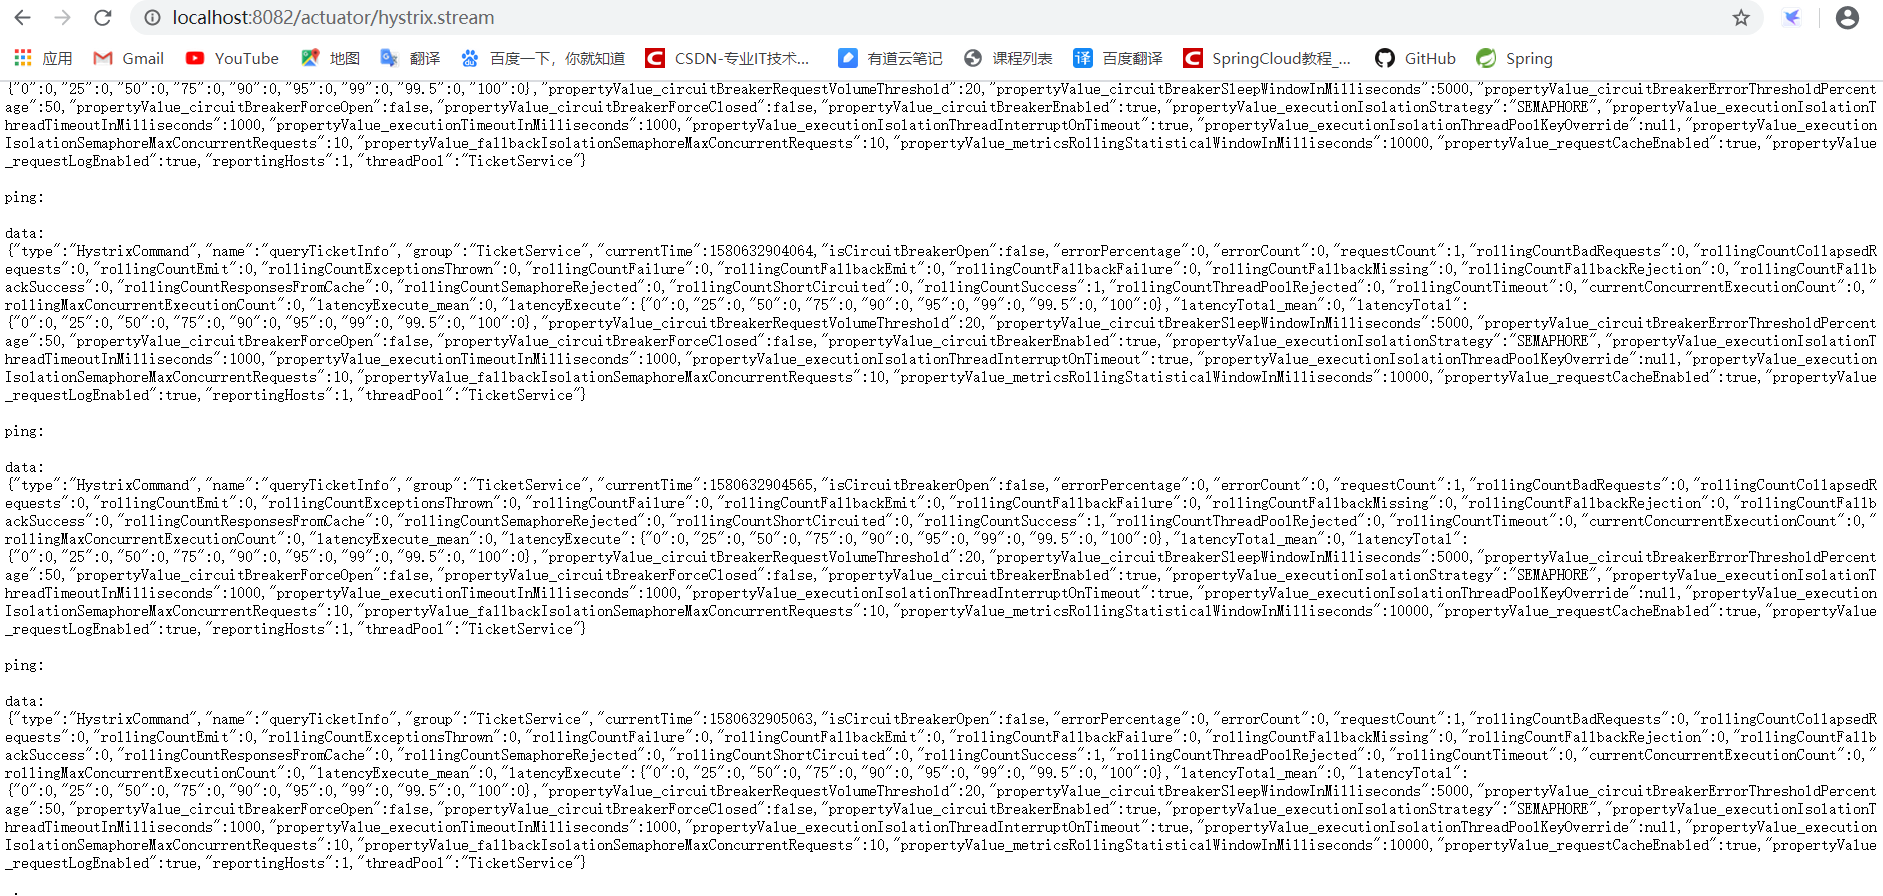
Let's do further tests, visit the interface in the ticket micro service, and then we can see that a lot of information appears on the page just now, indicating that he is monitoring.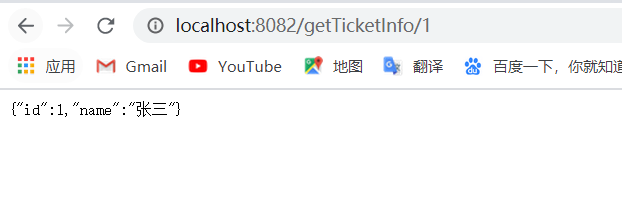
5, Hystrix Dashboard
The latest monitoring data can be seen in real time through actuator/hystrix.stream, but it seems inconvenient. All spring cloud s provide a Hystrix Dashboard, which can display these data in a graphical interface for our reading.
5.1 add dependency to POM file
Find the pom file of the parent project of the service consumer (ticket micro service), and add the dependency of dashboard.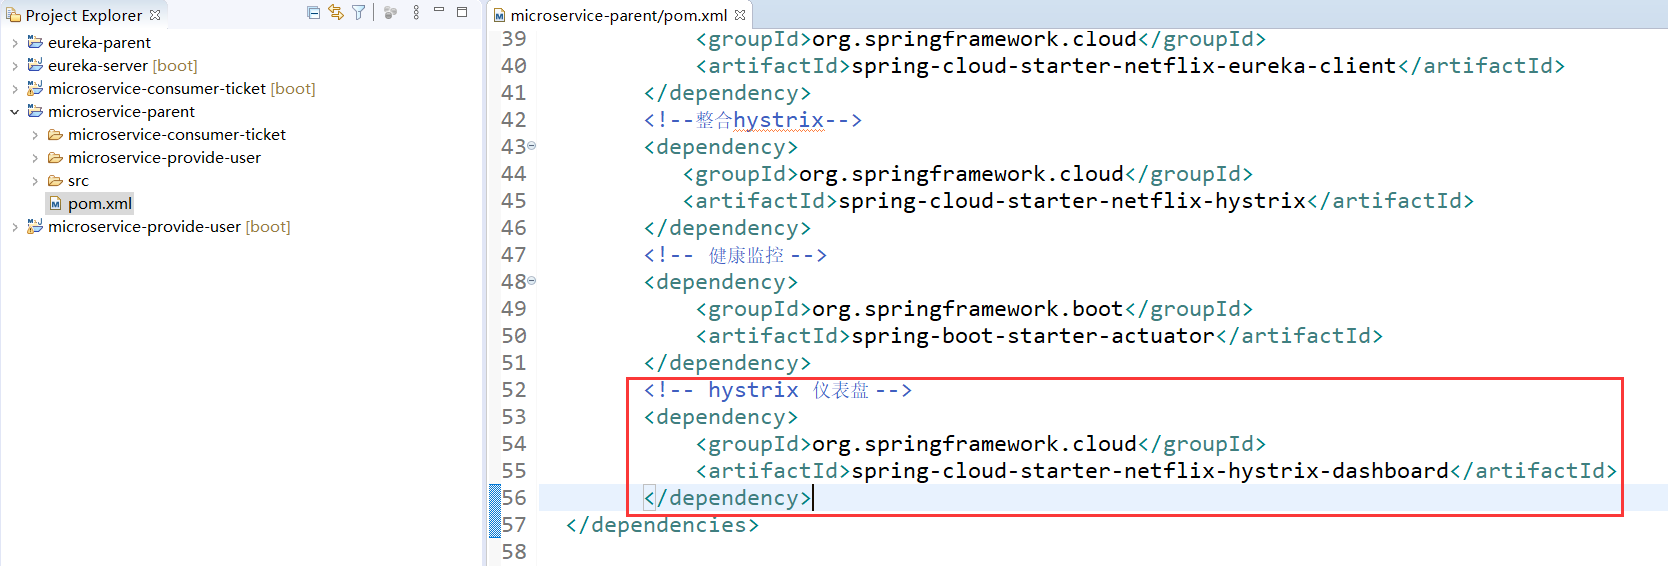
<project xmlns="http://maven.apache.org/POM/4.0.0" xmlns:xsi="http://www.w3.org/2001/XMLSchema-instance" xsi:schemaLocation="http://maven.apache.org/POM/4.0.0 https://maven.apache.org/xsd/maven-4.0.0.xsd">
  <modelVersion>4.0.0</modelVersion>
  <parent>
		<groupId>org.springframework.boot</groupId>
		<artifactId>spring-boot-starter-parent</artifactId>
		<version>2.0.3.RELEASE</version>
  </parent>

  <groupId>com.springcloud</groupId>
  <artifactId>microservice-parent</artifactId>
  <version>0.0.1-SNAPSHOT</version>
  <packaging>pom</packaging>
  <modules>
  	<module>microservice-provide-user</module>
  	<module>microservice-consumer-ticket</module>
  </modules>

  <dependencyManagement>
        <dependencies>
            <!-- Import Spring Cloud Dependency management for -->
            <dependency>
                <groupId>org.springframework.cloud</groupId>
                <artifactId>spring-cloud-dependencies</artifactId>
                <version>Finchley.SR4</version>
                <type>pom</type>
                <scope>import</scope>
            </dependency>
        </dependencies>
    </dependencyManagement>

  <dependencies>
  		<!-- web Support -->
		<dependency>
			<groupId>org.springframework.boot</groupId>
			<artifactId>spring-boot-starter-web</artifactId>
		</dependency>
		<!--springboot integration eureka Client-->
        <dependency>
            <groupId>org.springframework.cloud</groupId>
            <artifactId>spring-cloud-starter-netflix-eureka-client</artifactId>
        </dependency>
        <!--integration hystrix-->
		<dependency>
		   <groupId>org.springframework.cloud</groupId>
		   <artifactId>spring-cloud-starter-netflix-hystrix</artifactId>
		</dependency>
		<!-- Health monitoring -->
		<dependency>
        	<groupId>org.springframework.boot</groupId>
        	<artifactId>spring-boot-starter-actuator</artifactId>
    	</dependency>
    	<!-- hystrix Dashboard -->
    	<dependency>
    		<groupId>org.springframework.cloud</groupId>
    		<artifactId>spring-cloud-starter-netflix-hystrix-dashboard</artifactId>
		</dependency>
  </dependencies>

  <build>
	  <plugins>
		  <!-- Resource file copy plug-in -->
		  <plugin>
			  <groupId>org.apache.maven.plugins</groupId>
			  <artifactId>maven-resources-plugin</artifactId>
			  <configuration>
				  <encoding>UTF-8</encoding>
			  </configuration>
			  </plugin>
          <!-- springboot Plug-in unit -->
          <plugin>
			  <groupId>org.springframework.boot</groupId>
			  <artifactId>spring-boot-maven-plugin</artifactId>
		  </plugin>
	  </plugins>
  </build>
</project>
5.2 modify the startup class of service consumers
Add @ EnableHystrixDashboard annotation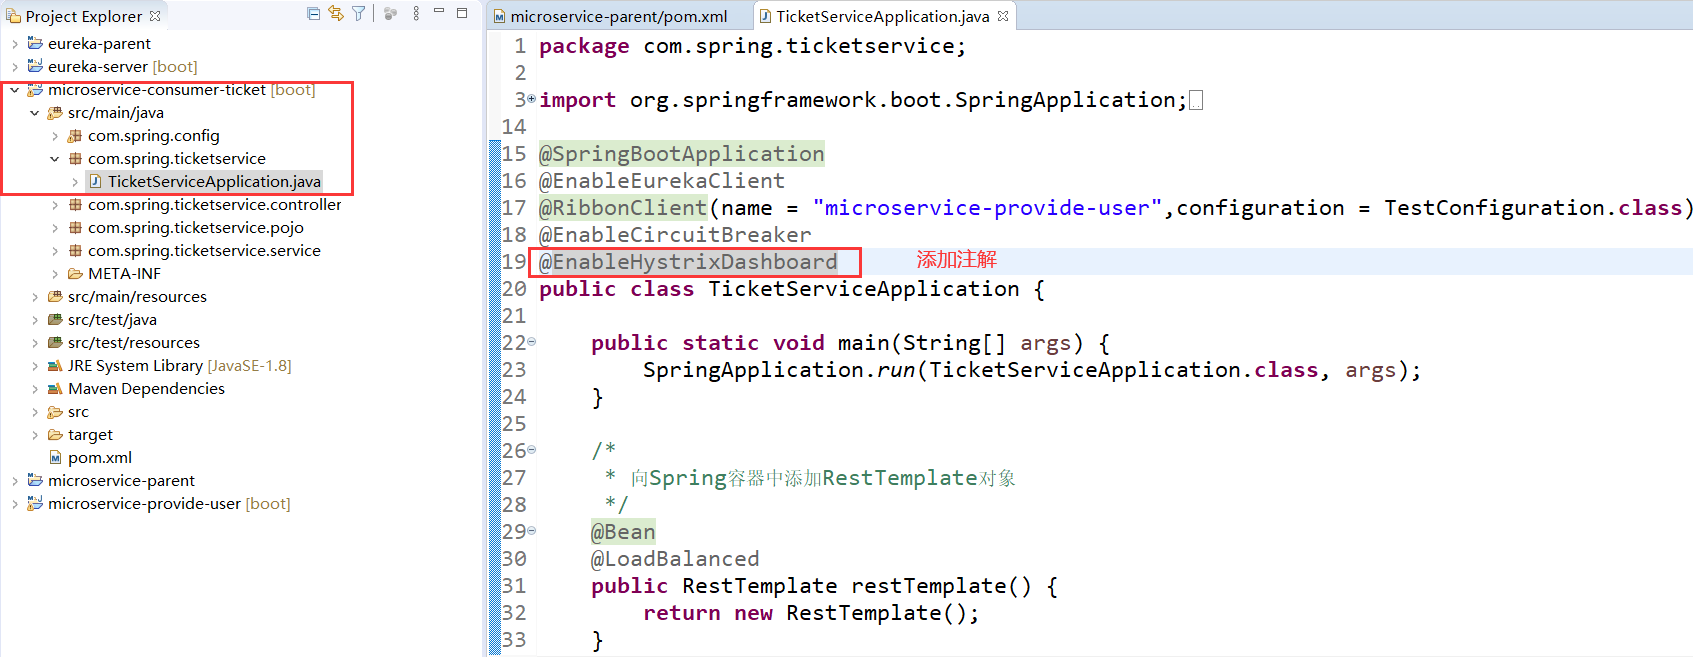
package com.spring.ticketservice;

import org.springframework.boot.SpringApplication;
import org.springframework.boot.autoconfigure.SpringBootApplication;
import org.springframework.cloud.client.circuitbreaker.EnableCircuitBreaker;
import org.springframework.cloud.client.loadbalancer.LoadBalanced;
import org.springframework.cloud.netflix.eureka.EnableEurekaClient;
import org.springframework.cloud.netflix.hystrix.dashboard.EnableHystrixDashboard;
import org.springframework.cloud.netflix.ribbon.RibbonClient;
import org.springframework.context.annotation.Bean;
import org.springframework.web.client.RestTemplate;

import com.spring.config.TestConfiguration;

@SpringBootApplication
@EnableEurekaClient
@RibbonClient(name = "microservice-provide-user",configuration = TestConfiguration.class)
@EnableCircuitBreaker
@EnableHystrixDashboard
public class TicketServiceApplication {

	public static void main(String[] args) {
		SpringApplication.run(TicketServiceApplication.class, args);
	}

	/*
	 * Add RestTemplate object to Spring container
	 */
	@Bean
	@LoadBalanced
	public RestTemplate restTemplate() {
	    return new RestTemplate();
	}
}
5.3 start service for testing
Launch eureka service, ticket micro service and user micro service.
After visiting the ticket microservice address and adding / hystrix http: / / localhost: 8082 / hystrix, you can see that you have come to the homepage of Hystrix Dashboard.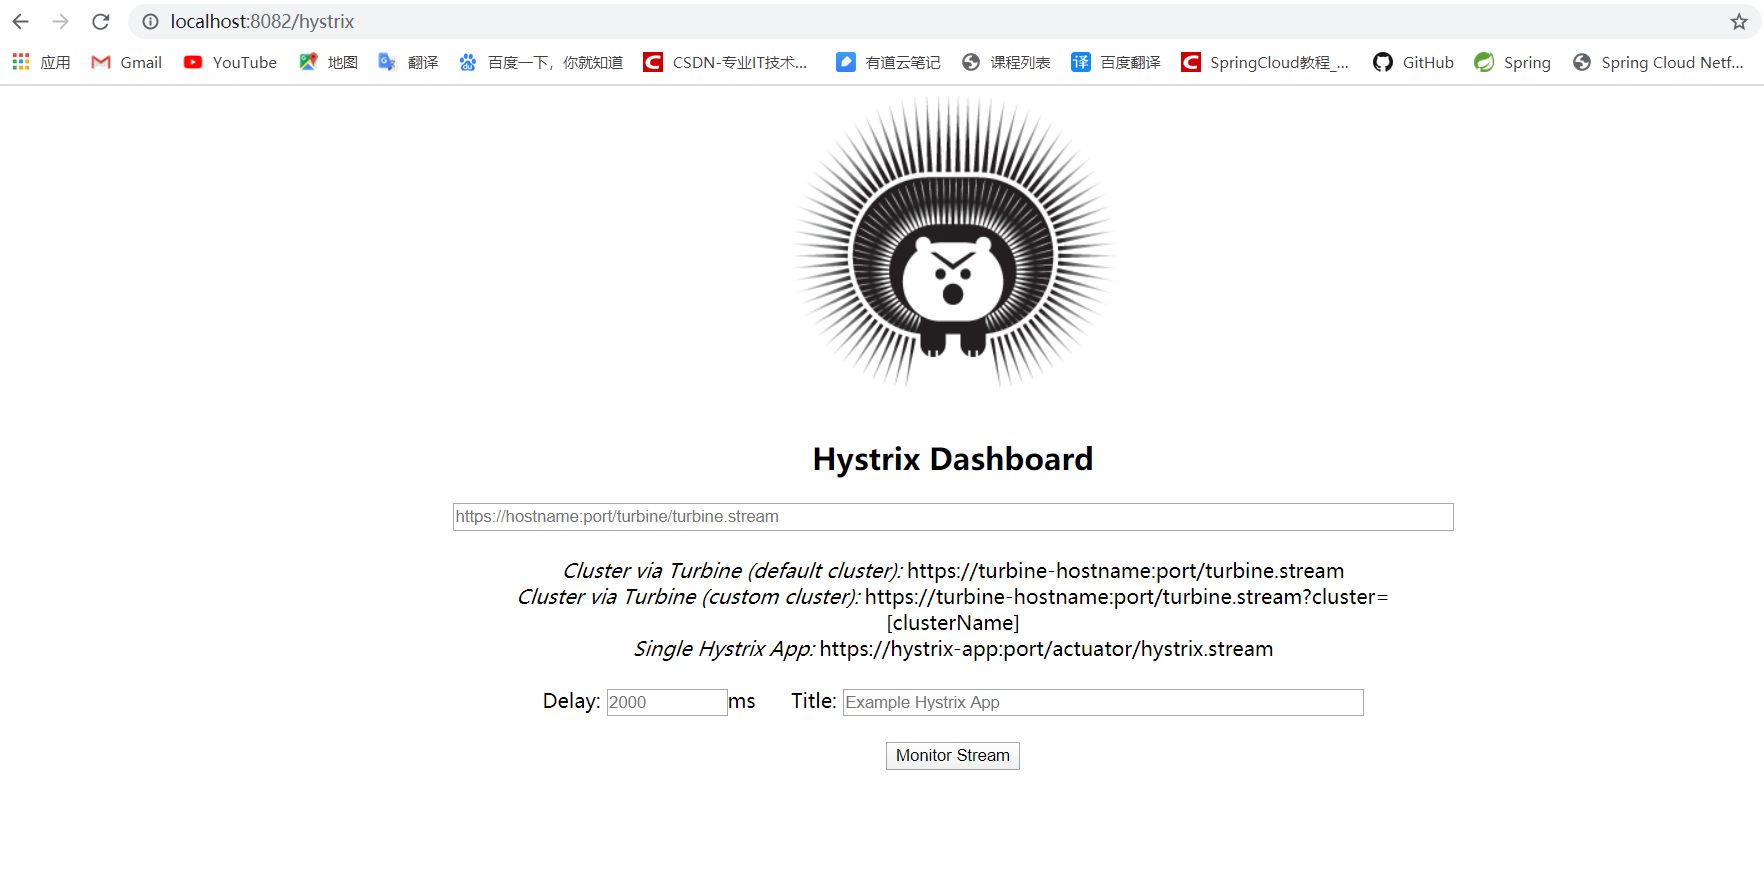
Enter the address http://localhost: 8082/actor/hystrix.stream and click Monitor Stream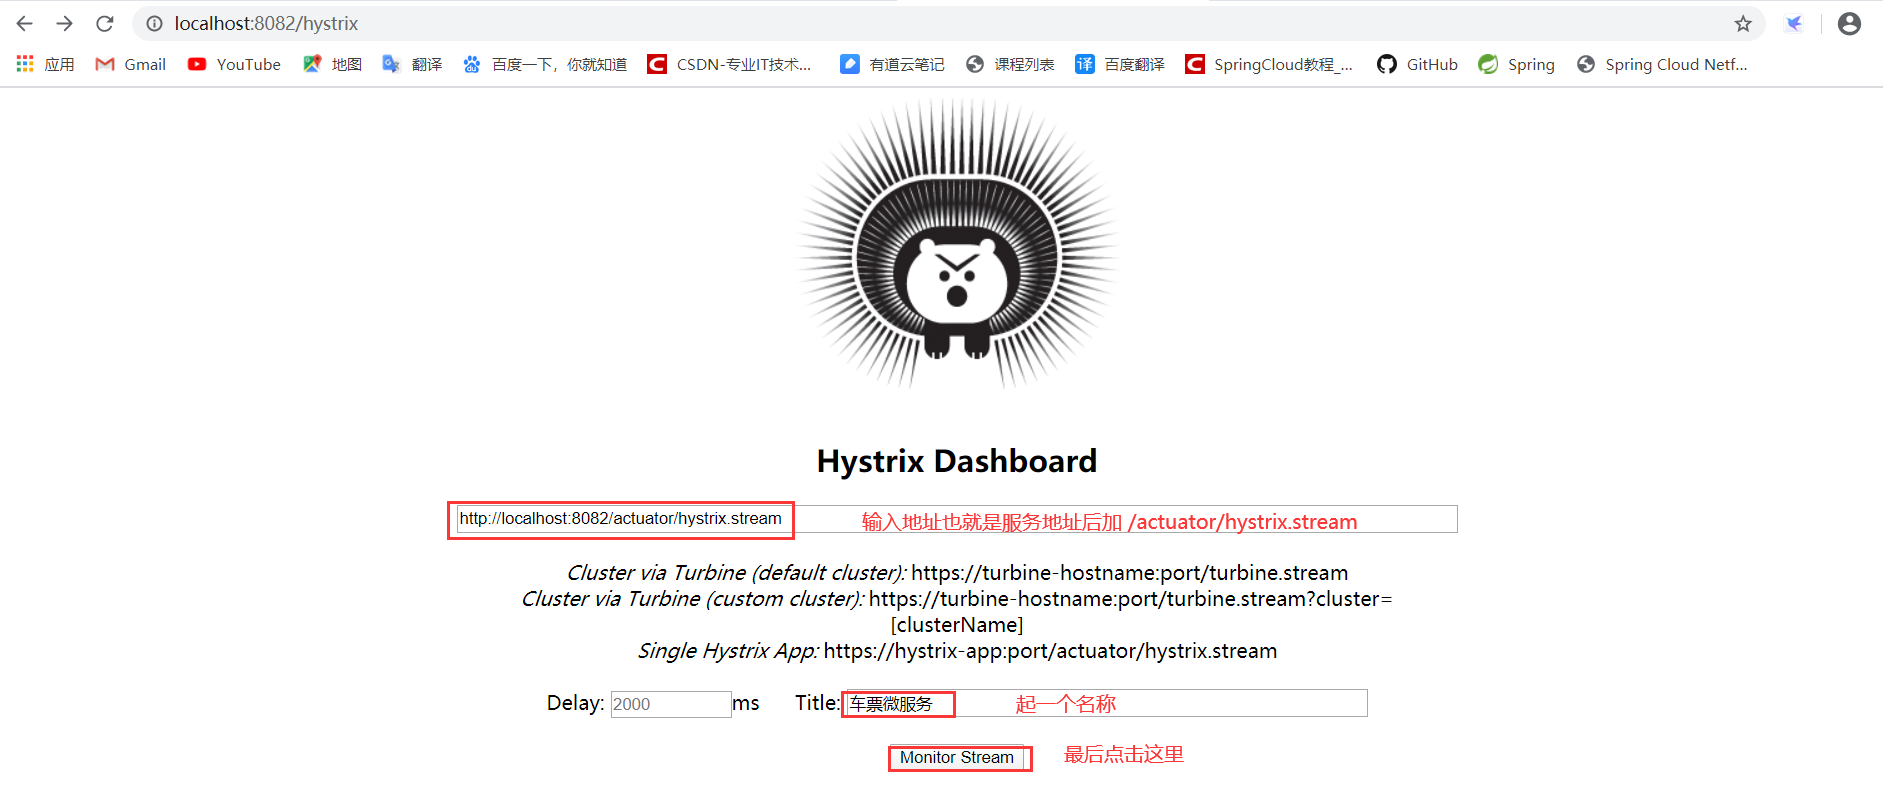
Enter the following page, and you can see the information about the queryTicketInfo interface.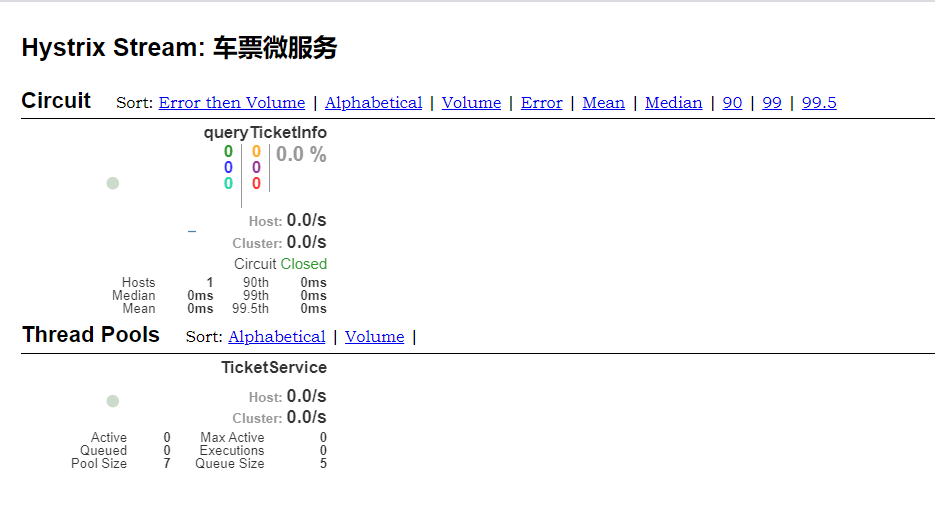
After visiting the interface of ticket microservice several times (here 6 times), you can see that the value in the page has changed, indicating that it is monitoring in real time.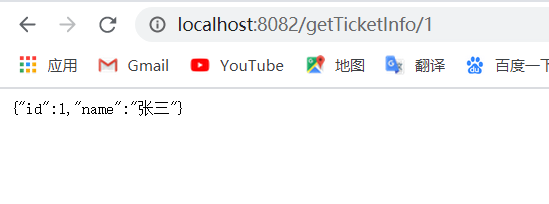
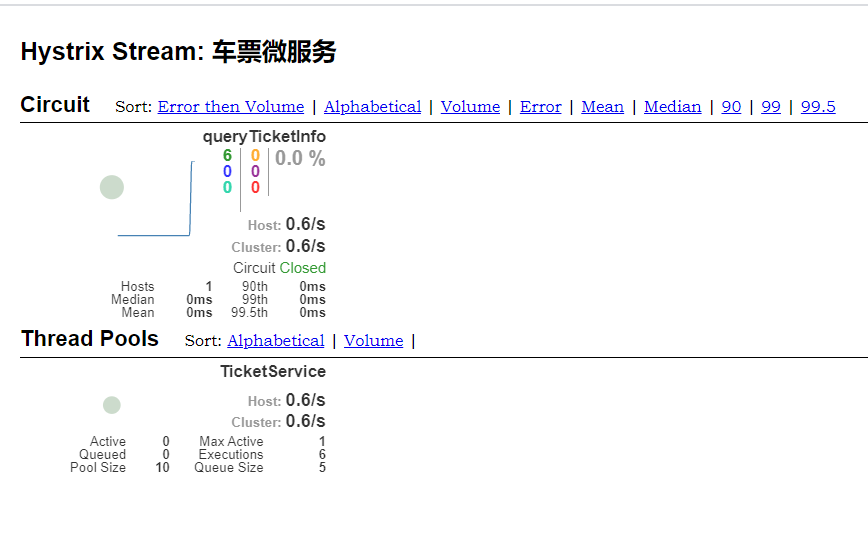
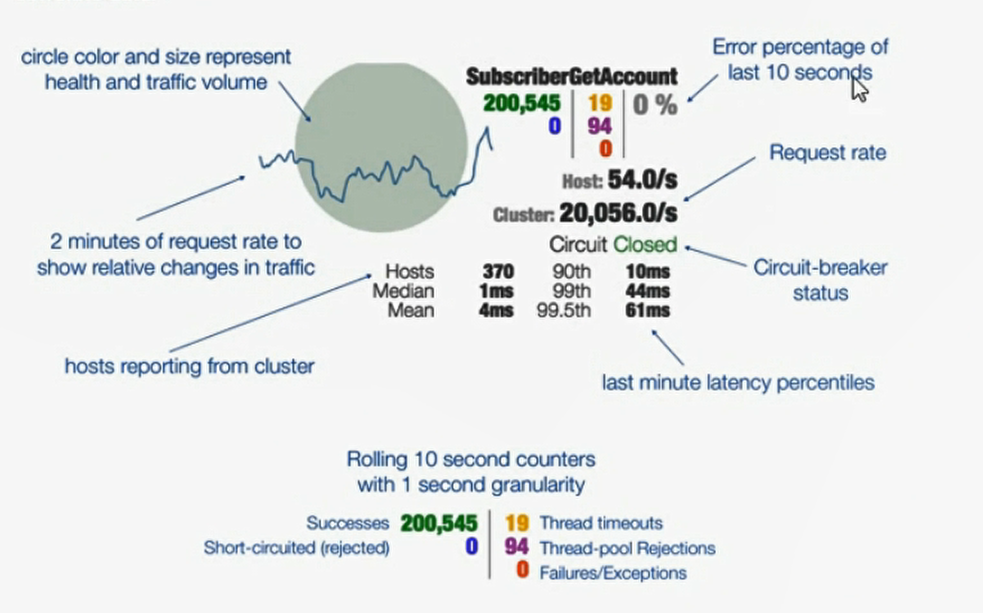
The following figure shows the meaning of each value