Blog Outline:
I. deploy the Web UI interface of dashboard
II. Deploy the web scope monitoring k8s cluster
III. deployment of Prometheus service
I. deploy the Web UI interface of dashboard
1. Download yaml file configuration and execute
#Download the project on github (the project can be found by searching the dashboard of github)
[root@master ~]# wget https://raw.githubusercontent.com/kubernetes/dashboard/v1.10.0/src/deploy/recommended/kubernetes-dashboard.yaml
[root@master ~]# vim kubernetes-dashboard.yaml
#Go to line 112, and modify the specified image as follows:
        image: registry.cn-hangzhou.aliyuncs.com/google_containers/kubernetes-dashboard-amd64:v1.10.0
#By default, the image specified is Google image, which can't be downloaded from abroad, so it needs to be changed to domestic Alibaba cloud image
#Jump to line 150, modify its corresponding service, and configure its type as NodePort, as follows:
kind: Service
apiVersion: v1
metadata:
  labels:
    k8s-app: kubernetes-dashboard
  name: kubernetes-dashboard
  namespace: kube-system
spec:
  type: NodePort  #Add NodePort as type
  ports:
    - port: 443
      targetPort: 8443
      nodePort: 30230        #The port mapped to the host is 30230
  selector:
    k8s-app: kubernetes-dashboard
#After modification, save and exit
[root@master ~]# kubectl apply -f kubernetes-dashboard.yaml    #Execute yaml file
[root@master ~]# kubectl get pod -n kube-system | grep dashboard    #Confirm its normal operation
kubernetes-dashboard-6cfb7d8f54-l6jgj   1/1     Running   0          88s
2. Client access through Firefox
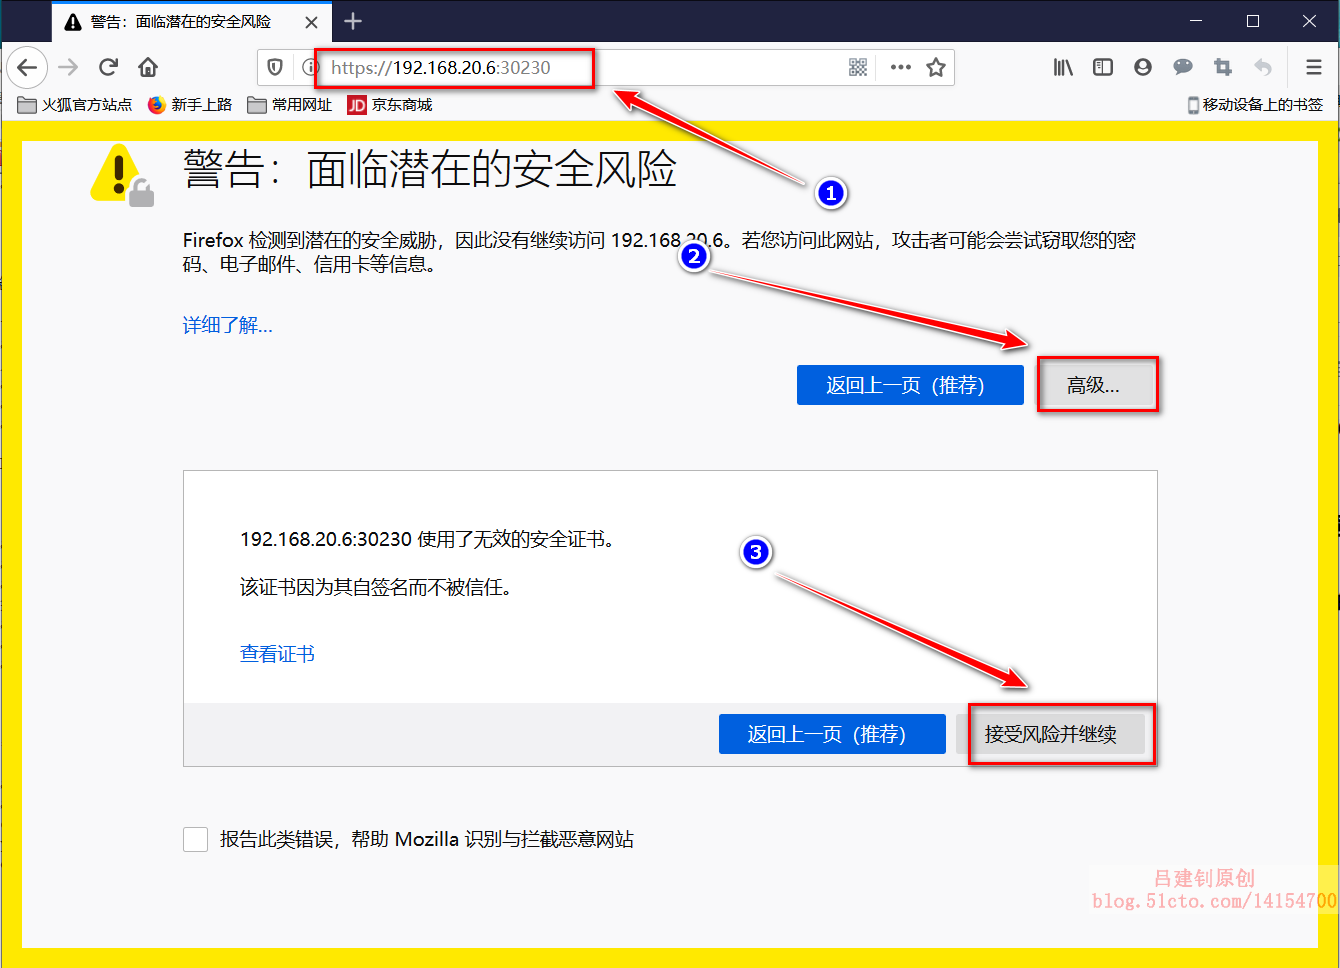
You have to use Firefox. Neither Google nor the default edge can access it.
1) visit https://192.168.20.6:30230, (192.168.20.6 is the IP address of the master, in fact, you can access any node IP+30230 port in the cluster), and then click as follows:
2) create a user at the terminal and view the login token:
[root@master ~]# kubectl create serviceaccount dashboard-admin -n kube-system #Create dashboard management user
#Bind user as administrator of cluster
[root@master ~]# kubectl create clusterrolebinding dashboard-cluster-admin --clusterrole=cluster-admin --serviceaccount=kube-system:dashboard-admin
[root@master ~]# kubectl get secrets -n kube-system | grep dashboard-admin #Get the token of the user you just created
dashboard-admin-token-97g76 kubernetes.io/service-account-token 3 15s
[root@master ~]# kubectl describe secrets -n kube-system dashboard-admin-token-97g76
#Note: the last paragraph above depends on the secret name of the user viewed above.
Name: dashboard-admin-token-97g76
Namespace: kube-system
..................#Omit part of the content
Data
====
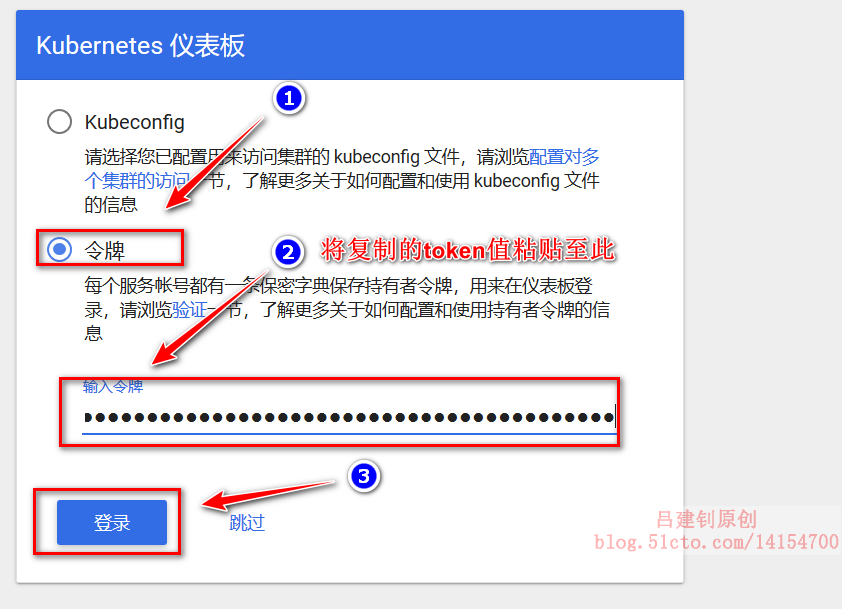
token: #Copy the value after the token field3) paste the token value below:
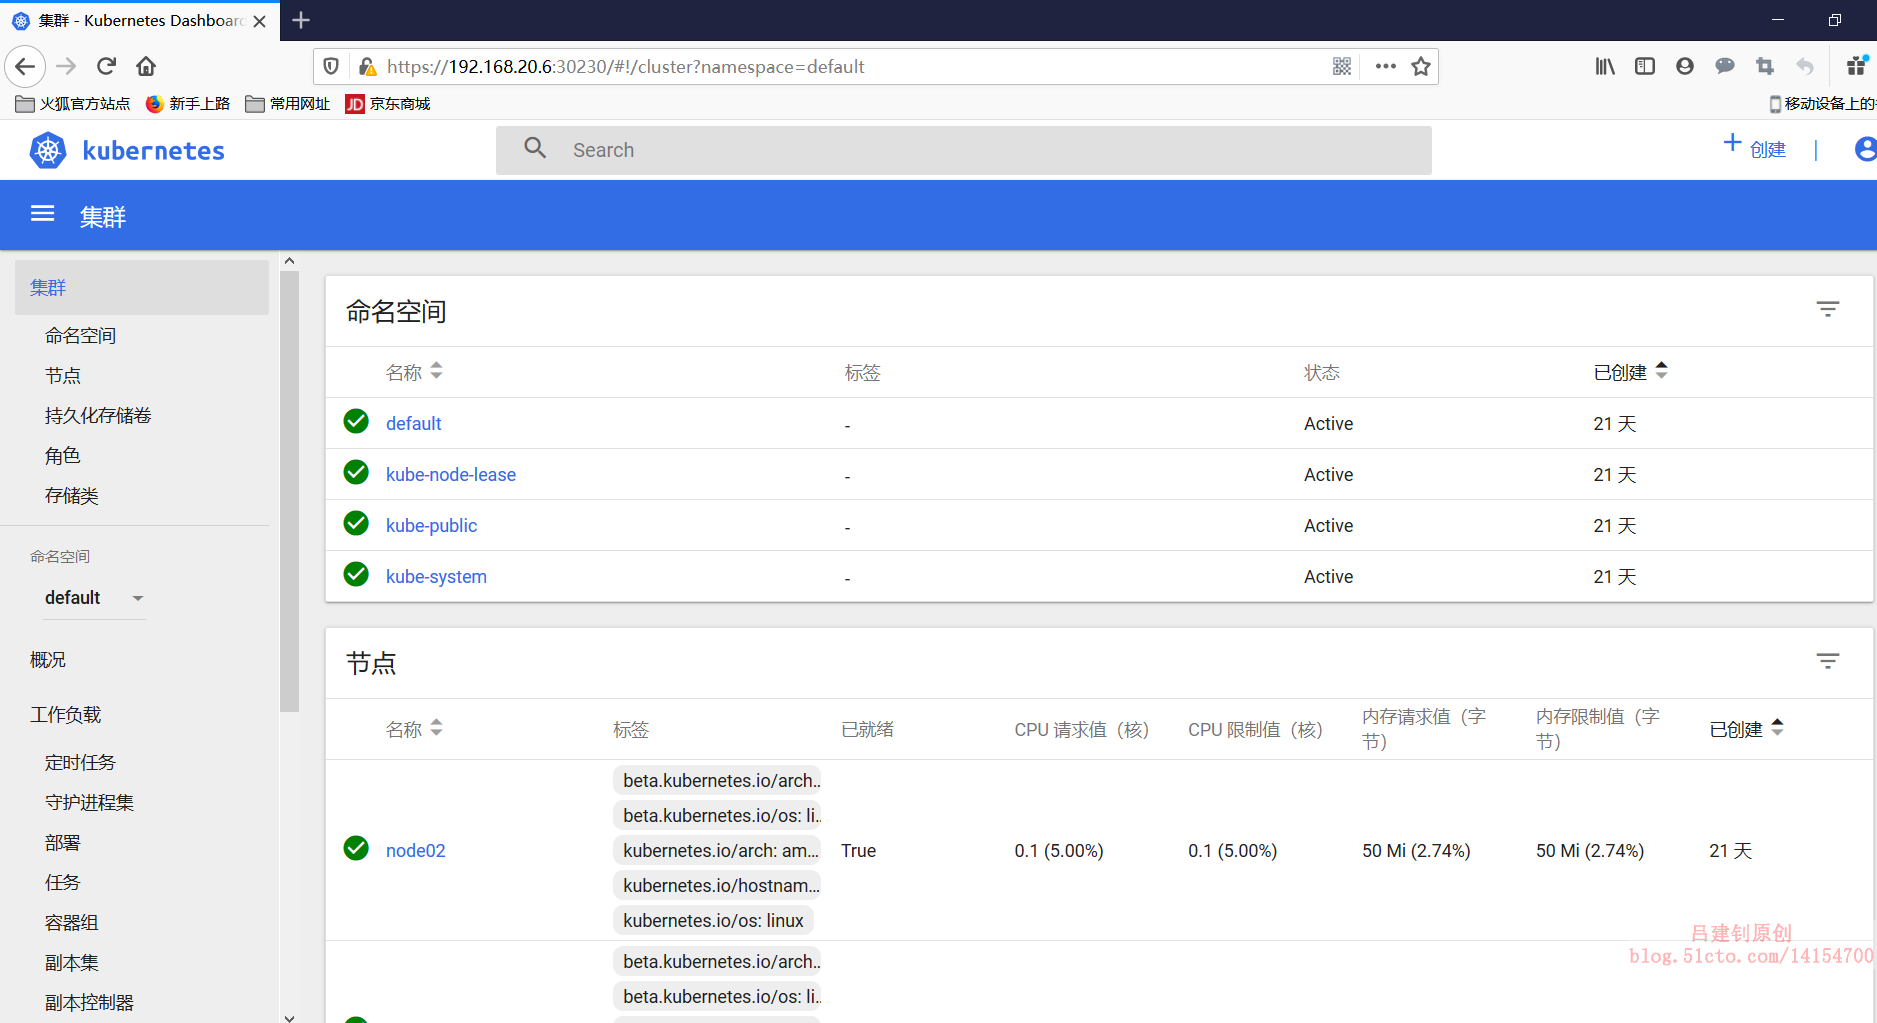
4) at this point, you can monitor the information of cluster nodes in the web interface, and create resource objects (generally, resource objects will not be created above):
II. Deploy the web scope monitoring k8s cluster
The yaml file of this service is not easy to find on github. Please attach the process of finding this link! As follows:
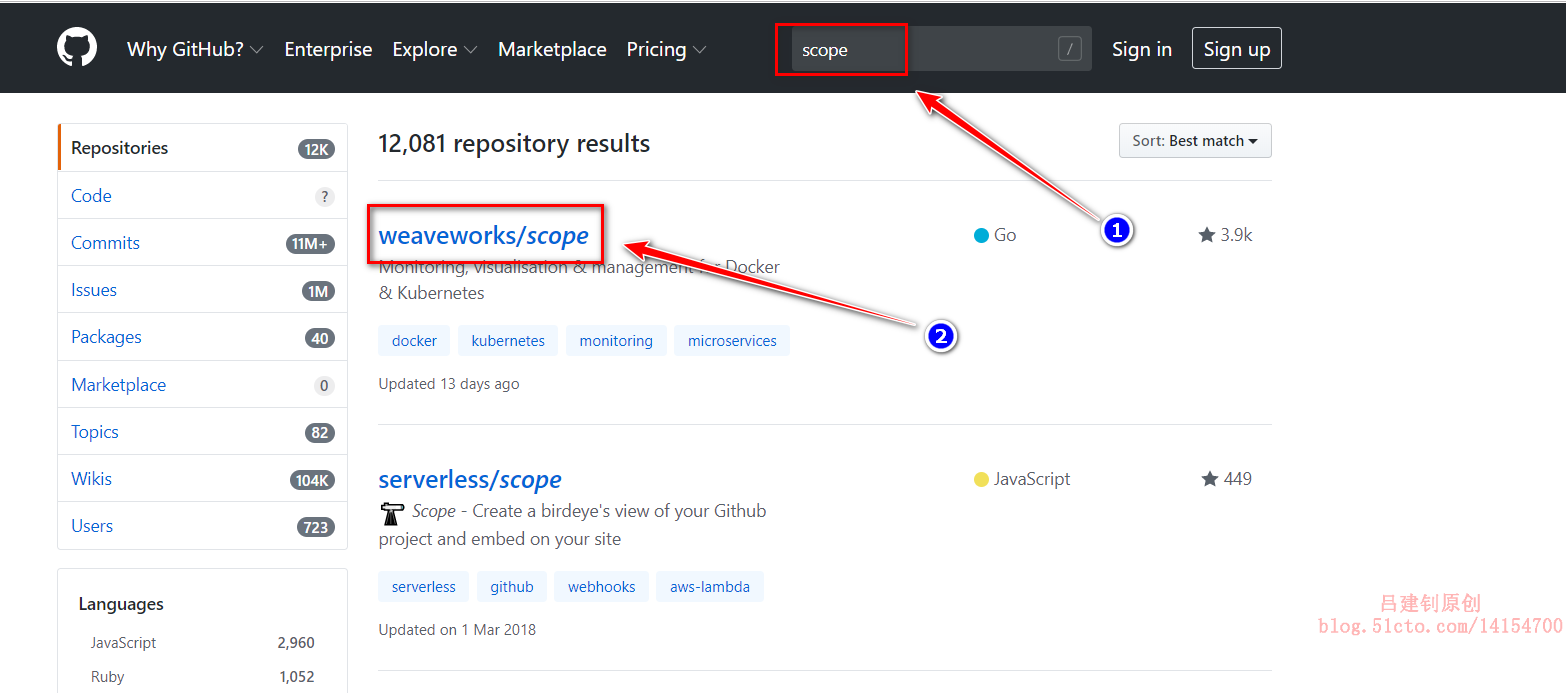
1. github searches "scope", and then click as follows:
2. After entering, click "kubernetes" from the drop-down page, as follows:
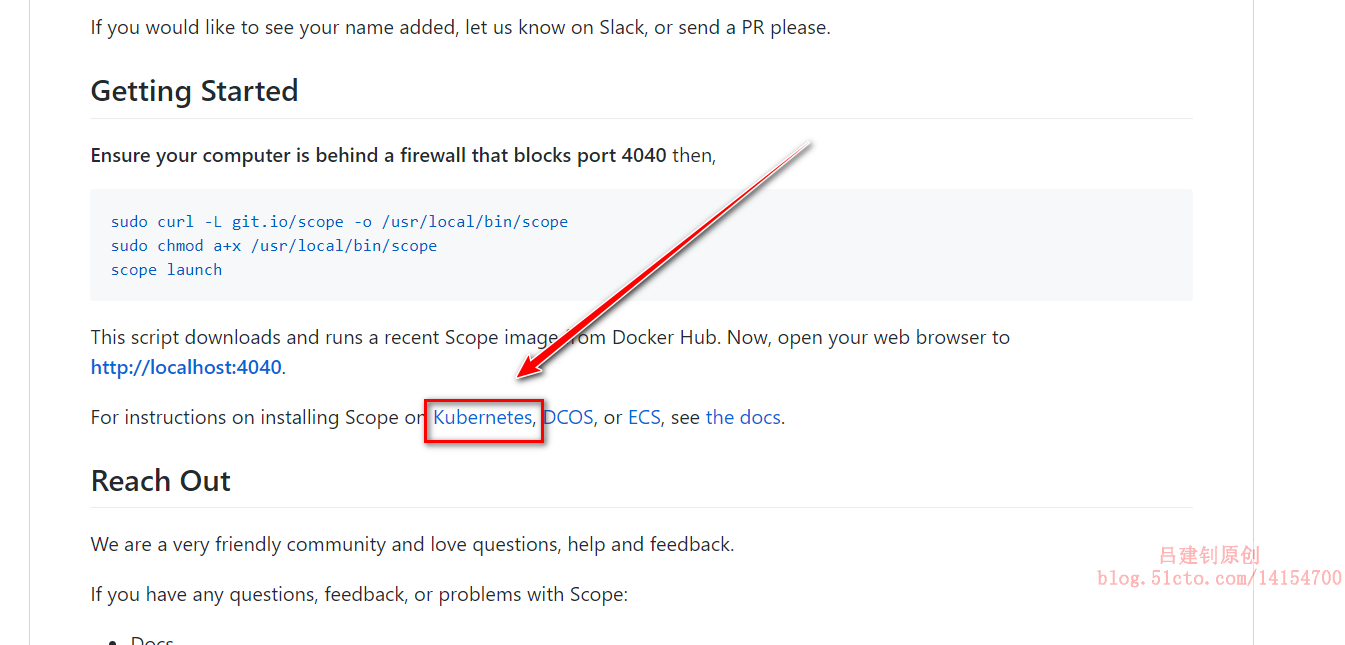
3. After entering, pull down the page again:

4. Download the obtained links:
[root@master ~]# wget https://cloud.weave.works/k8s/scope.yaml
5. Modify the downloaded yaml file and run it:
[root@master ~]# vim scope.yaml  #Edit yaml file
#Go to line 197 and modify the port type of its service
    spec:
      type: NodePort         #Modify the type to NodePort
      ports:
        - name: app
          port: 80
          protocol: TCP
          targetPort: 4040
          nodePort: 30231        #Port mapped to host is 30231
[root@master ~]# kubectl apply -f scope.yaml      #Execute yaml file
#Check the operation of the container to make sure it is in normal operation
[root@master ~]# kubectl get pod -o wide -n weave    #Default in the weave namespace
NAME                                         READY   STATUS    RESTARTS   AGE   IP             NODE     NOMINATED NODE   READINESS GATES
weave-scope-agent-b4dwz                      1/1     Running   0          73s   192.168.20.8   node02   <none>           <none>
weave-scope-agent-lksqh                      1/1     Running   0          73s   192.168.20.7   node01   <none>           <none>
weave-scope-agent-mv6mj                      1/1     Running   0          73s   192.168.20.6   master   <none>           <none>
weave-scope-app-78cff98cbc-kxp9v             1/1     Running   0          73s   10.244.2.2     node02   <none>           <none>
weave-scope-cluster-agent-7cc889fbbf-ngf8j   1/1     Running   0          73s   10.244.1.3     node01   <none>           <none>
#DaemonSet resource object: weave scope agent (agent): responsible for collecting node information;
#deployment resource object: Web scope app (application): get data from agent, display and interact with user through web UI;
#Compared with deployment, the feature of DaemonSet resource object is that DaemonSet resource object will run on each node and only one pod can run.
#Because every node needs to be monitored, a resource object like DaemonSet is used
6. The browser accesses the mapping port 30231 of the cluster, as follows:
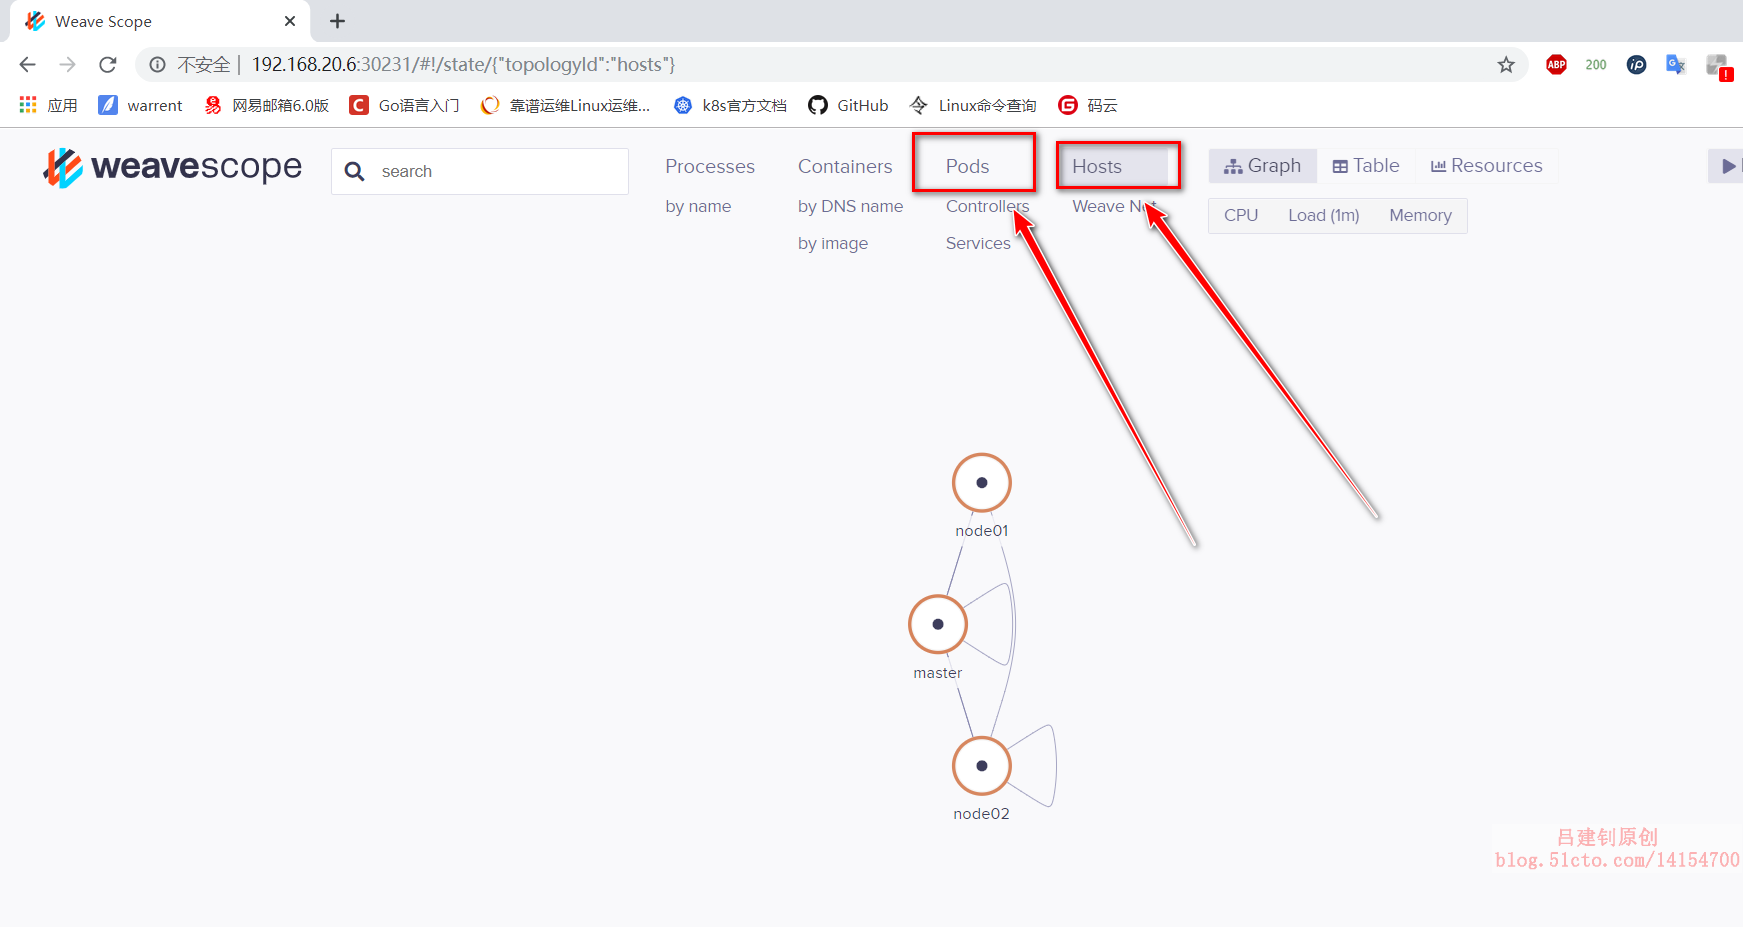
In the scope's web interface, you can view many things, such as pod, node node and other details, including opening the container's terminal, viewing its log information and so on
III. deployment of Prometheus service
Before deployment, let's understand the function of each component of Prometheus!
- Mericserver: it is the aggregator of k8s cluster resource usage. It collects data for use in k8s cluster, such as kubectl, hpa,scheduler
- Prometheus operator: it is a system detection and alarm toolbox used to store monitoring data;
- NodeExporter: used for the status data of key metrics of each node;
- kubeStateMetrics: collect resource object data in k8s cluster, and specify alarm rules;
- Prometheus: collect the data of apiserver, scheduler, controller manager and kubelet components in pull mode, and transfer it through http protocol;
- Grafana: it is a visual data statistics and monitoring platform.
1. Before you start, you need to delete the first two monitoring platforms, or consume too much system resources, as follows:
[root@master ~]# kubectl delete -f scope.yaml
[root@master ~]# kubectl delete -f kubernetes-dashboard.yaml
2. Download the files required by prometheus:
[root@master ~]# mkdir prometheus
[root@master ~]# cd prometheus/
[root@master prometheus]# yum -y install git       #Install git command
#Clone remote github Library
[root@master prometheus]# git clone https://github.com/coreos/kube-prometheus.git
[root@master prometheus]# cd kube-prometheus/manifests/    #Enter the directory under clone
3. Modify the yaml file of each component service
[root@master manifests]# vim grafana-service.yaml    #Modify grafana's yaml file

apiVersion: v1
kind: Service
metadata:
  labels:
    app: grafana
  name: grafana
  namespace: monitoring
spec:
  type: NodePort       #Change to NodePort type
  ports:
  - name: http
    port: 3000
    targetPort: http
    nodePort: 30100    #Mapping to host 30100 port
  selector:
    app: grafana
[root@master manifests]# vim prometheus-service.yaml    #Modify yaml file of prometheus

apiVersion: v1
kind: Service
metadata:
  labels:
    prometheus: k8s
  name: prometheus-k8s
  namespace: monitoring
spec:
  type: NodePort      #Change to NodePort type
  ports:
  - name: web
    port: 9090
    targetPort: web
    nodePort: 30200    #Mapping to host 30200 port
  selector:
    app: prometheus
    prometheus: k8s
  sessionAffinity: ClientIP
[root@master manifests]# vim alertmanager-service.yaml    #Modify the yaml file of alertmanager

apiVersion: v1
kind: Service
metadata:
  labels:
    alertmanager: main
  name: alertmanager-main
  namespace: monitoring
spec:
  type: NodePort      #Change to NodePort type
  ports:
  - name: web
    port: 9093
    targetPort: web
    nodePort: 30300    #Mapping to host 30300 port
  selector:
    alertmanager: main
    app: alertmanager
  sessionAffinity: ClientIP
4. Execute yaml file
When the following yaml files are executed, each node will download many images on the Internet. In order to prevent the image download time from being too long, you can download the image provided by me to the local, then import it to each node, and then execute the following yaml files, which will save some time. (if downloading the image provided by me, it is recommended to write a script to import the image to avoid manual import and error.)
An example script is as follows:
[root@master ~]# vim a.sh  #The script is as follows

#!/bin/bash
cd /root/image        #Only the images in my network disk are stored in this directory
for i in `ls /root/image/`
do
  docker load < ${i}
done
[root@master ~]# sh a.sh      #Just execute the script
#All yaml files under the setup directory must be executed first, as follows: [root@master manifests]# pwd #Determine current path /root/prometheus/kube-prometheus/manifests [root@master manifests]# kubectl apply -f setup/ #Execute all yaml files in the setup directory #Then execute the yaml file in the manifest directory [root@master manifests]# cd .. #Return to the previous directory [root@master kube-prometheus]# kubectl apply -f manifests/ #Execute yaml file [root@master kube-prometheus]# kubectl get pod -n monitoring #Confirm that all pod s operate normally #If you choose to download the image online, it may take about half an hour to run normally
To be continued...............
————————Thank you for reading————————