Links to the original text: https://www.jianshu.com/p/b452cbe9be0e
What happens when the content of Echarts tags is too long?
- 1. Tilt the text
Modify the rotate value in xAxis.axisLabe
  xAxis: {
            data: ["Shirt 11111","Wool 22","Chiffon shirt 111","Trousers 111","High heels 11","Socks 111"],//Data in the x-axis
            name:"123",//Name of coordinate axis.
            nameLocation:'end',//The coordinate axis name shows the position.
            axisLabel : {//Relevant settings of coordinate axis calibration labels.
                interval:0,
                rotate:"45"
            }
        },
interval
Display interval of coordinate axis scale label (valid in category axis). Label will be displayed in the way of non overlapping by default (that is, partial text will not be displayed completely by default)
It can be set to 0 to force all labels to be displayed. If set to 1, it means that a label is displayed on a label. If it is 3, it means a label should be displayed on 3 labels, and so on.
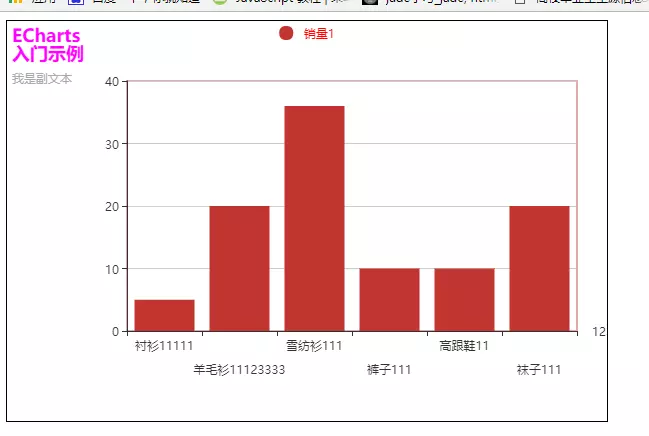
I didn't set it up at first because the label text was too long and he automatically didn't display all of it.
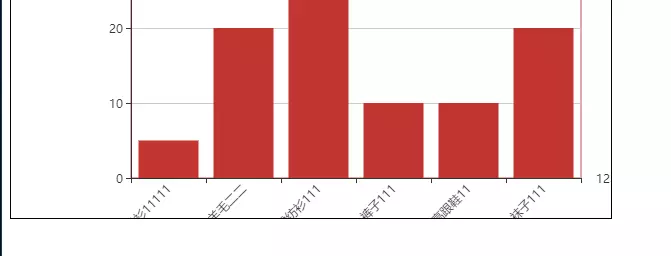
image.png
Let the grid component move upward from the container if it is blocked, and increase the value of the bottom in the grid
 grid:{//Drawing grid in Cartesian coordinate system
            show:true,//Whether to display rectangular coordinate grid. [default: false]
            left:"20%",//The distance from the grid component to the left of the container.
            right:"30px",
            borderColor:"#c45455 ",//grid border color
            bottom:"20%" //
        },
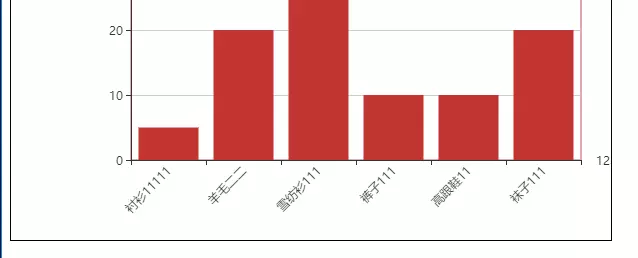
image.png
- 2. Line-breaking display
Use formatter callback function in xAxis.axisLabel to realize line break
    axisLabel : {//Relevant settings of coordinate axis calibration labels.
                formatter : function(params){
                   var newParamsName = "";// The final concatenated string
                            var paramsNameNumber = params.length;// Number of actual labels
                            var provideNumber = 4;// Number of words per line
                            var rowNumber = Math.ceil(paramsNameNumber / provideNumber);// If you change lines, you need to show a few lines and take them up.
                            /**
                             * Determine whether the number of tags is greater than the specified number, and if it is greater than the number of new lines, if it is not greater than, that is, equal to or less than, return to the original tag.
                             */
                            // The condition is equal to rowNumber > 1
                            if (paramsNameNumber > provideNumber) {
                                /** Loop each row, p represents the row */
                                for (var p = 0; p < rowNumber; p++) {
                                    var tempStr = "";// A string representing each intercept
                                    var start = p * provideNumber;// Starting interception position
                                    var end = start + provideNumber;// End Interception Position
                                    // The index value of the last row is specially handled here
                                    if (p == rowNumber - 1) {
                                        // No change of line for the last time
                                        tempStr = params.substring(start, paramsNameNumber);
                                    } else {
                                        // Each concatenation of strings and line breaks
                                        tempStr = params.substring(start, end) + "\n";
                                    }
                                    newParamsName += tempStr;// The final string
                                }

                            } else {
                                // Assign the value of the old tag to the new tag
                                newParamsName = params;
                            }
                            //Returns the final string
                            return newParamsName
                }

            }
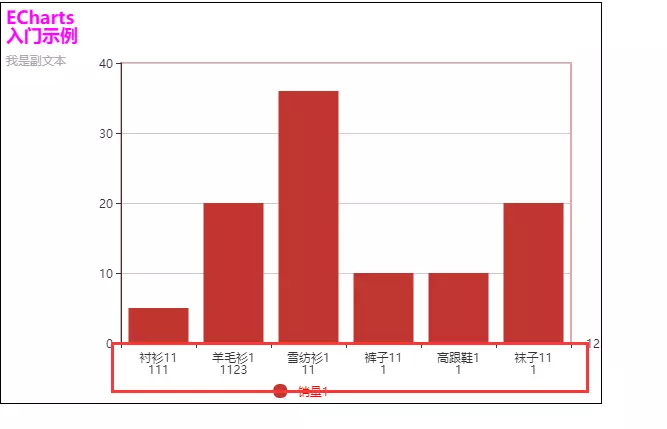
image.png
- 3. Vertical display of text
The same is true for line breaks, except that this is a single line break.
Use formatter callback function in xAxis.axisLabel to realize line break
axisLabel: {
                               interval: 0,
                               formatter:function(value)
                               {
                                   return value.split("").join("\n");
                               }
                           }
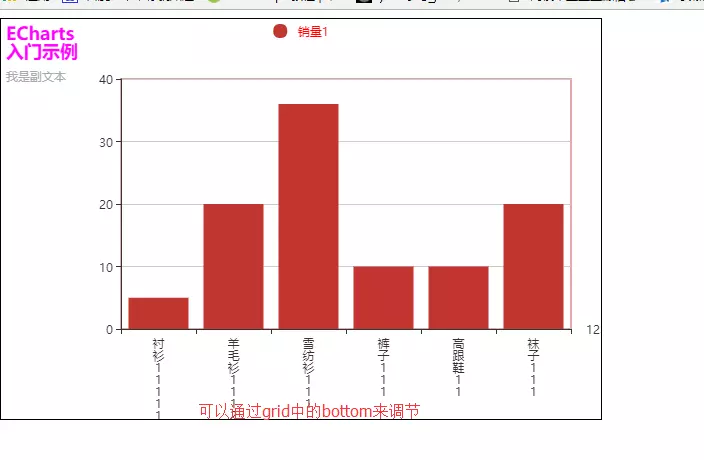
image.png
- 4. Alternate line breaks
Use formatter callback function in xAxis.axisLabel to realize line break
axisLabel : {//Relevant settings of coordinate axis calibration labels.
                clickable:true,//And add click events to the chart to determine where to click based on the return value
                interval : 0,
                formatter : function(params,index){
                    if (index % 2 != 0) {
                        return '\n\n' + params;
                    }
                    else {
                        return params;
                    }
                }

            }