This chapter mainly explains how to build and deploy in CentOS environment
1,InfluxDB
InfluxDB is an open source distributed time series, events and indicators database written in Go language without external dependence.
Similar databases include Elasticsearch, Graphite, etc.
Download address:
https://portal.influxdata.com/downloads/
1.1 installation
wget https://dl.influxdata.com/influxdb/releases/influxdb-1.8.9.x86_64.rpm
sudo yum localinstall influxdb-1.8.9.x86_64.rpm
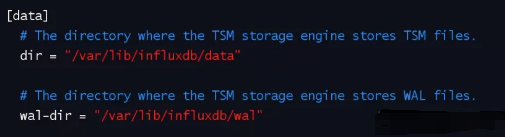
1.2 configuration
vim /etc/influxdb/influxdb.conf
1.3 startup and viewing status
1. Start
systemctl start influxdb.service
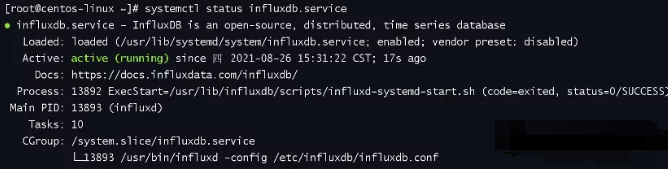
2. View status
systemctl status influxdb.service
As shown in the figure: started
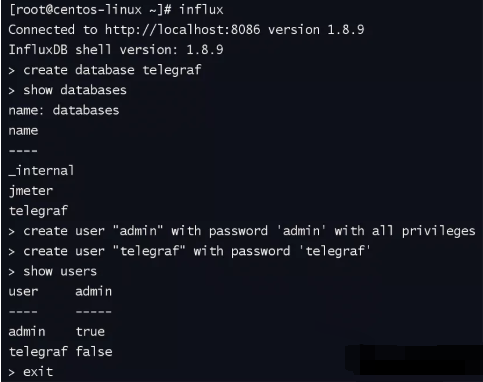
1.4. Create database and account password
Enter database
influx
Create database telegraf
create database telegraf
Create administrator admin with password admin
create user "admin" with password 'admin' with all privileges
Create an ordinary user telegraf with a password of telegraf
create user "telegraf" with password 'telegraf'
Then enter exit to exit.
2,Telegraf
Telegraf is a plug-in driven server agent for collecting and reporting metrics, and is the first part of the TICK Stack.
The Telegraf plug-in can directly obtain various indicators from the system it runs, extract indicators from third-party API s, and even monitor indicators through statsd and Kafka consumer services. It also has output plug-ins that can send indicators to various other data stores, services and message queues, including InfluxDB, Graphite, OpenTSDB, Datadog, Librato, Kafka, MQTT, NSQ, etc.
Download address:
https://portal.influxdata.com/downloads/
2.1 installation
wget https://dl.influxdata.com/telegraf/releases/telegraf-1.19.3-1.x86_64.rpm
yum install -y telegraf-1.19.3-1.x86_64.rpm
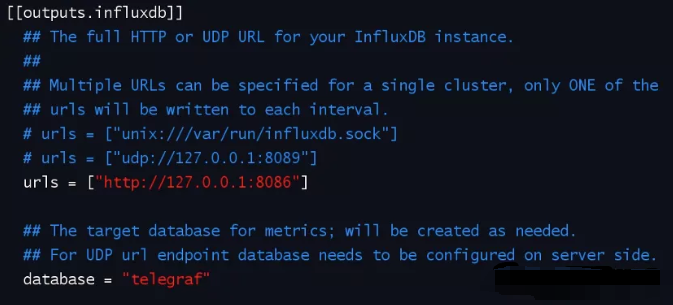
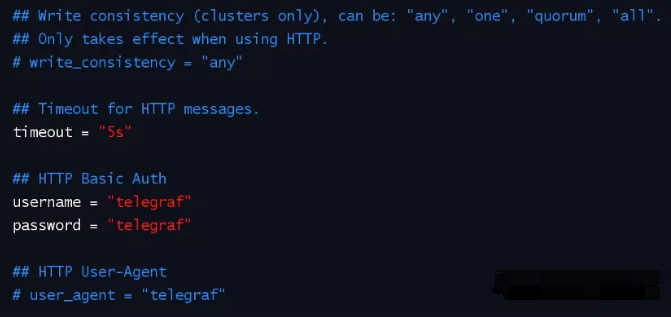
2.2 configuration
vim /etc/telegraf/telegraf.conf
Modify the outputs.incluxdb area:
2.3 startup and viewing status
1. Start
systemctl start telegraf
2. View status
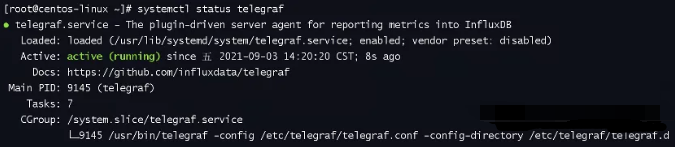
systemctl status telegraf
As shown in the figure: started
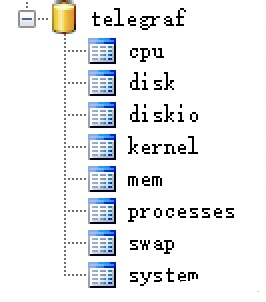
2.4. View the data to be monitored
[root@centos-linux ~]# influx
Connected to http://localhost:8086 version 1.8.9
InfluxDB shell version: 1.8.9
> show databases
name: databases
name
----
_internal
jmeter
telegraf
> use telegraf
Using database telegraf
> show measurements
name: measurements
name
----
cpu
disk
diskio
kernel
mem
processes
swap
system
Alternatively, you can query the database using the InfluxDB Studio client connection tool
As shown in the figure:
3,Grafana
Grafana is a cross platform open source measurement analysis and visualization tool, which can query the collected data, then visually display it, and notify it in time.
Download address:
https://grafana.com/grafana/download
3.1 installation
wget https://dl.grafana.com/oss/release/grafana-8.1.2-1.x86_64.rpm
sudo yum install grafana-8.1.2-1.x86_64.rpm
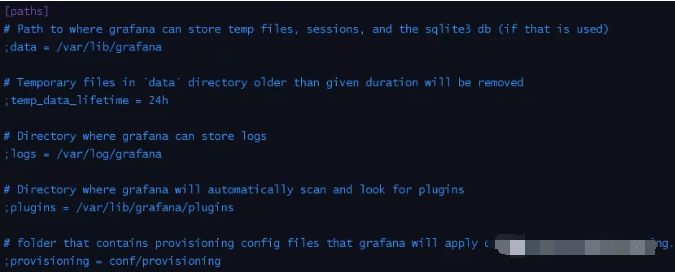
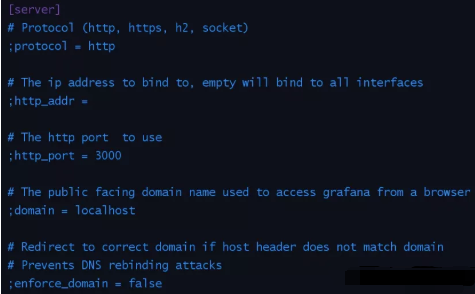
3.2 configuration
vim /etc/grafana/grafana.ini
3.3 startup and viewing status
1. Start
systemctl start grafana-server.service
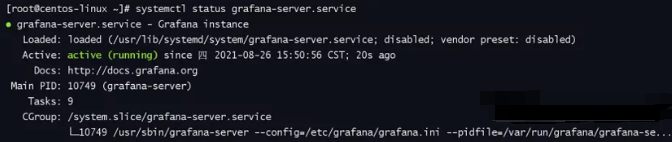
2. View status
systemctl status grafana-server.service
As shown in the figure: started
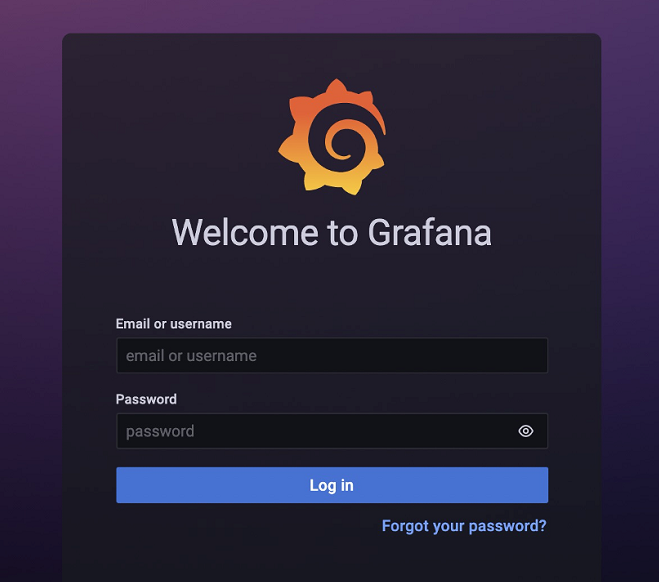
3.4. Access and login
Open the browser to access the address http://IP:3000 , the following interface appears, indicating that the Grafana service is started successfully.
Enter the user name and password, both "admin", and log in.
Note: if it is not accessible, check the firewall settings.
resolvent:
Mode 1 (close the firewall)
systemctl stop firewalld
Mode 2 (open the firewall and add open ports)
(1) Turn on the firewall
systemctl start firewalld
(2) Add an open port (for example, port 3000)
firewall-cmd --zone=public --add-port=3000/tcp --permanent
(3) Update firewall rules
firewall-cmd --reload
Firewall related commands:
Turn on the firewall
systemctl start firewalld
Turn off firewall
systemctl stop firewalld
View firewall status
systemctl status firewalld.service
View open ports
firewall-cmd --list-ports
Add an open port, such as 3000 (rules need to be updated to take effect after opening)
firewall-cmd --zone=public --add-port=3000/tcp --permanent
Update firewall rules
firewall-cmd --reload
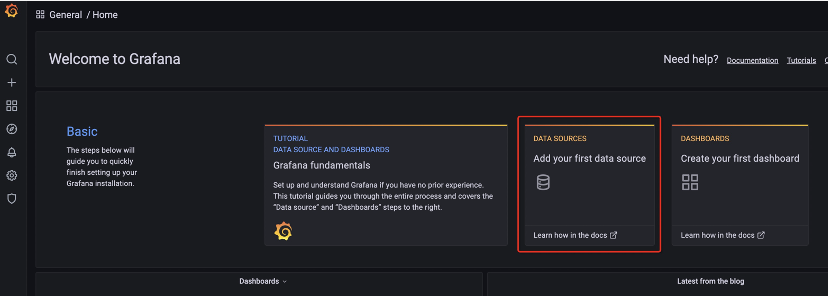
3.5. Create data source
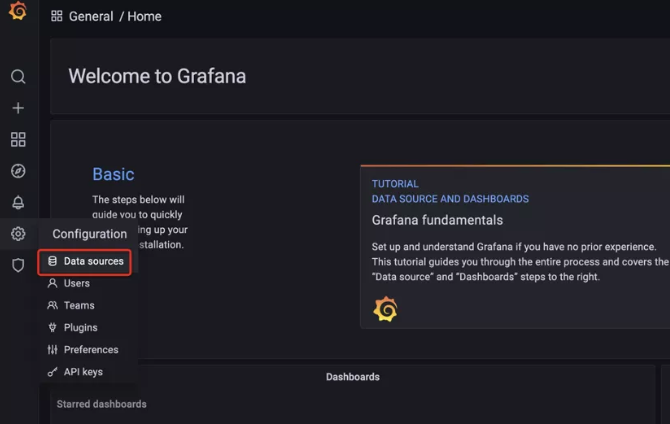
Method 1: directly click the data source on the home page
Method 2: select configuration - data source on the left
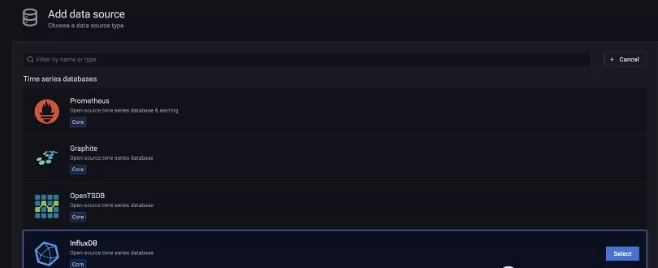
Select incluxdb as the data source.
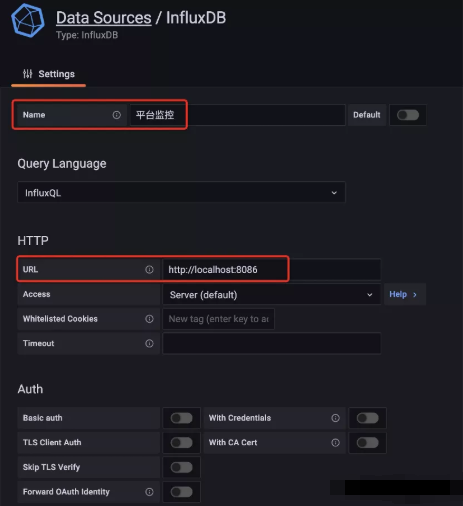
Fill in the configuration information:
Name: custom name
URL: when InfluxDB and Grafana are installed on the same server, localhost can be written
Database: matches the database and account password created when installing incluxdb
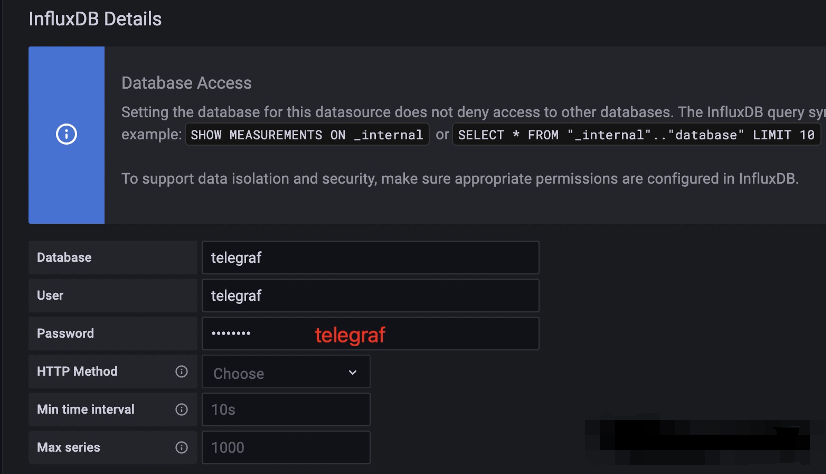
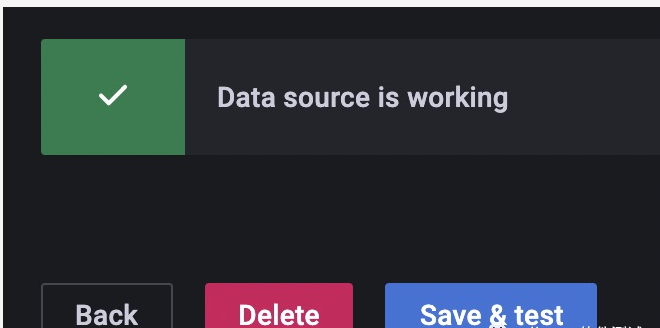
Then click save.
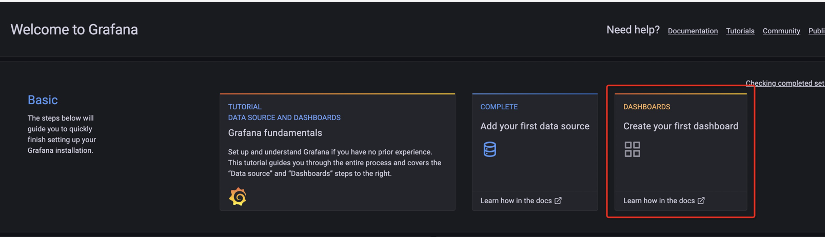
3.6. Create dashboard
Method 1: directly click the dashboard on the home page
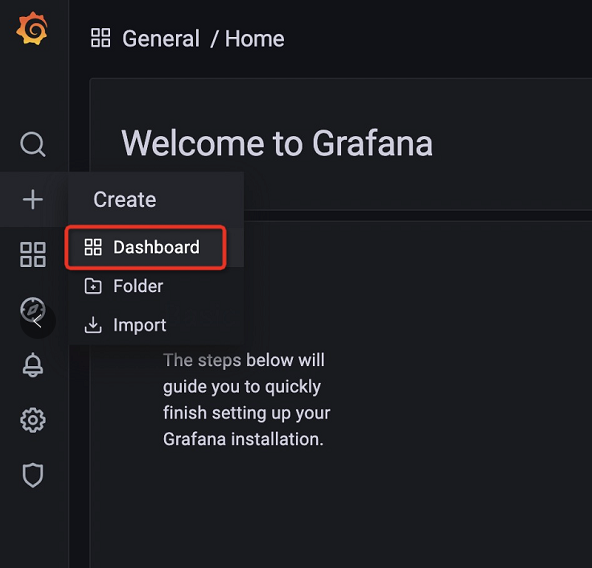
Method 2: select Create dashboard on the left
Add panel area.
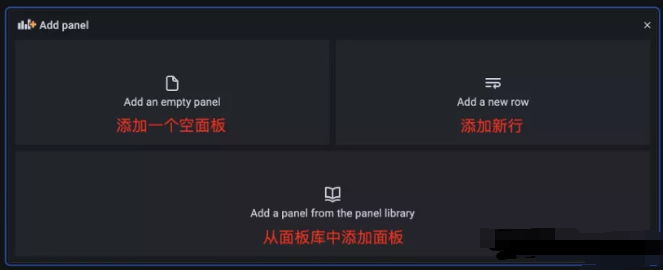
Then click Add an empty panel to Add an empty panel, and configure the dashboard according to the actual situation.
Set data sources and add different indicators (cpu, memory, disk, network traffic, etc.).
For example, to monitor the cpu of a server, add an indicator:
User cpu occupation, system cpu occupation, iowait (process wait caused by system io)
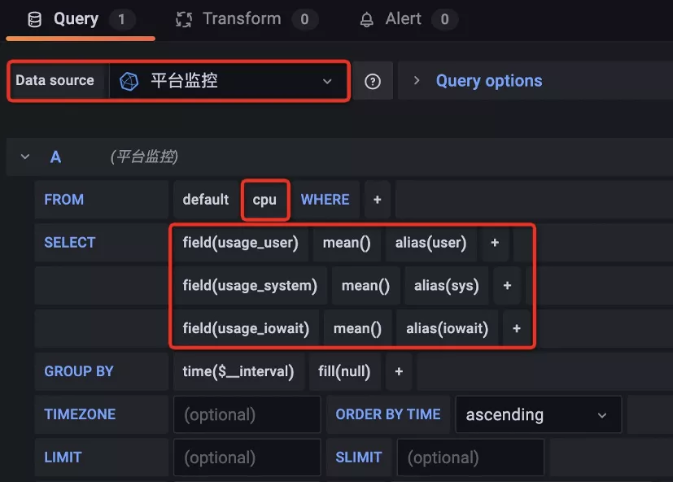
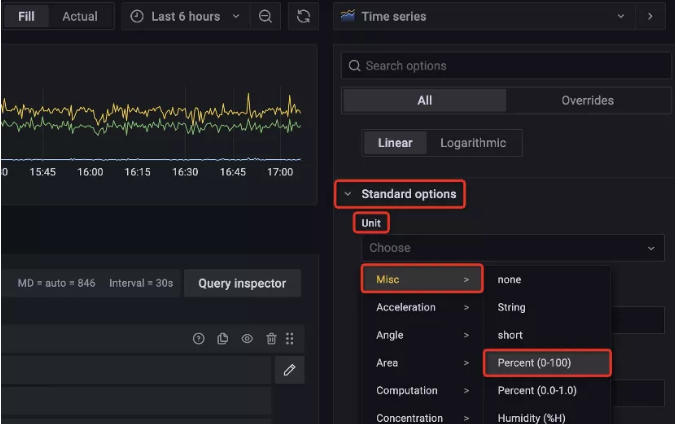
Set percentage occupancy display
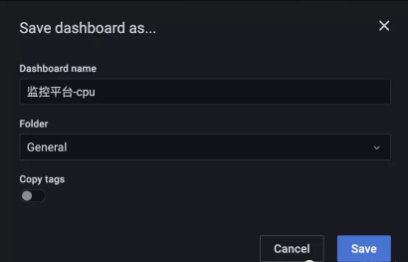
Customize the dashboard name, and then save it.
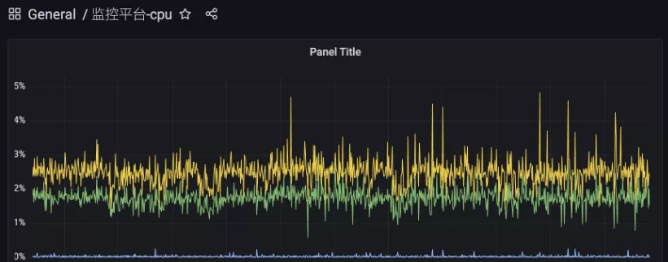
The dashboard is created and starts monitoring the set indicators.
4. Monitoring MySQL
4.1. Create a Telegraf configuration file (collect MySQL)
vim /etc/telegraf/telegraf.d/telegraf_mysql.conf
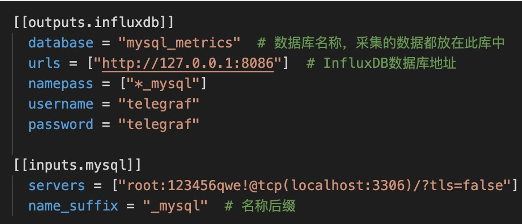
Add the following:
[[outputs.influxdb]]
  database = "mysql_metrics"  # Database name and collected data are placed in this database
  urls = ["http://127.0.0.1:8086 "] # incluxdb database address
  namepass = ["*_mysql"]
  username = "telegraf"
  password = "telegraf"

[[inputs.mysql]]
  servers = ["root:123456qwe!@tcp(localhost:3306)/?tls=false"] # MySQL user name, password and address to connect to MySQL
  name_suffix = "_mysql"  # name suffix
4.2 restart Telegraf
systemctl restart telegraf
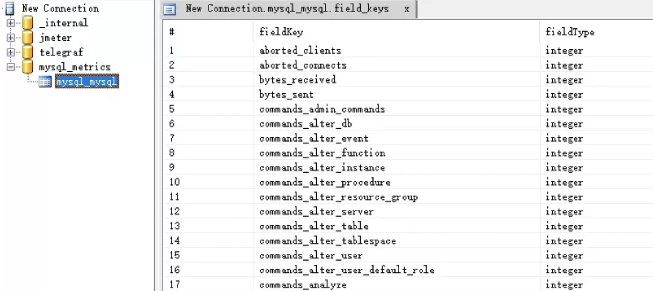
4.3. View the fields to be monitored
[root@centos-linux ~]# influx
Connected to http://localhost:8086 version 1.8.9
InfluxDB shell version: 1.8.9
> show databases
name: databases
name
----
_internal
jmeter
telegraf
mysql_metrics
> use mysql_metrics
Using database mysql_metrics
> show measurements
name: measurements
name
----
mysql_mysql
> show field keys from mysql_mysql
name: mysql_mysql
fieldKey fieldType
-------- ---------
aborted_clients integer
aborted_connects integer
bytes_received integer
bytes_sent integer
commands_admin_commands integer
commands_alter_db integer
commands_alter_event integer
commands_alter_function integer
commands_alter_instance integer
commands_alter_procedure integer
commands_alter_resource_group integer
commands_alter_server integer
commands_alter_table integer
commands_alter_tablespace integer
commands_alter_user integer
commands_alter_user_default_role integer
Alternatively, you can query the database using the InfluxDB Studio client connection tool
As shown in the figure:
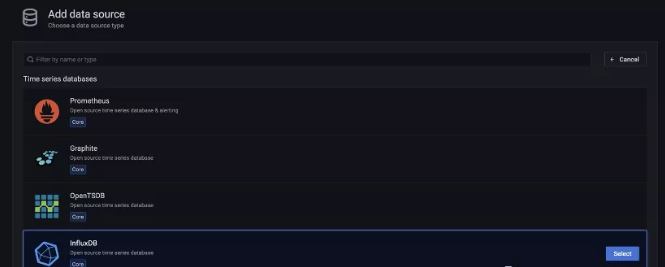
4.4. Create data source by Grafana
Log in to Grafana and create a data source (select incluxdb as the data source)
Fill in the configuration information:
Name: custom name
URL: when InfluxDB and Grafana are installed on the same server, localhost can be written
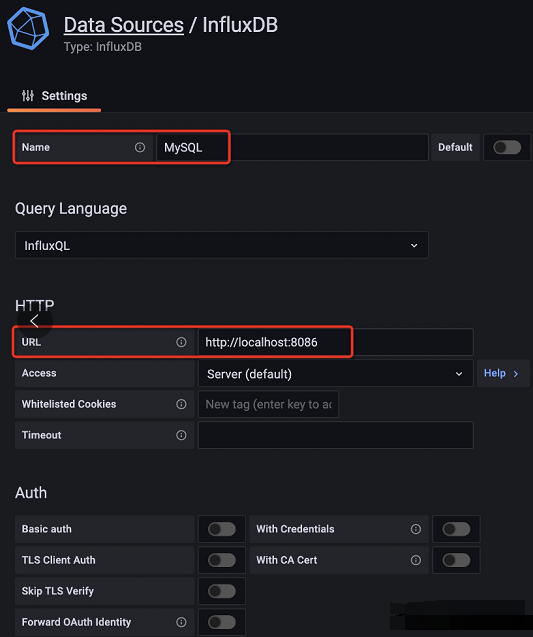
Database: matches the Telegraf configuration file (telegraf_mysql.conf), the created database and the account password.
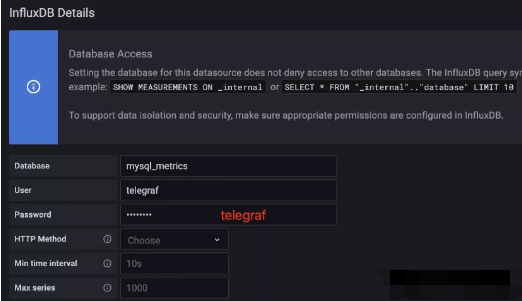
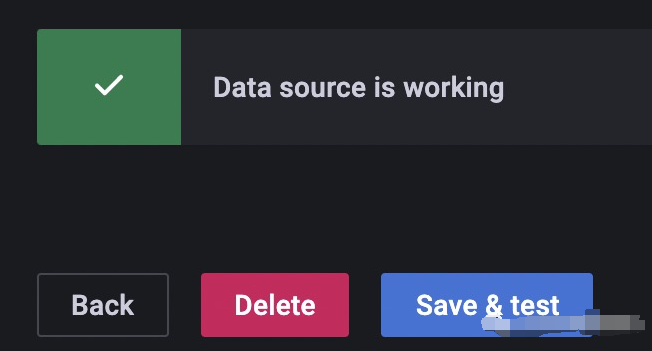
Then click save.
4.5 import monitoring template from Grafana
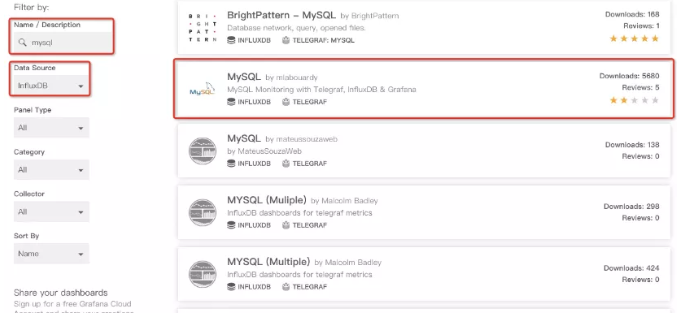
Official template library
https://grafana.com/grafana/dashboards
Search by criteria and click to enter the template (e.g. the second template).
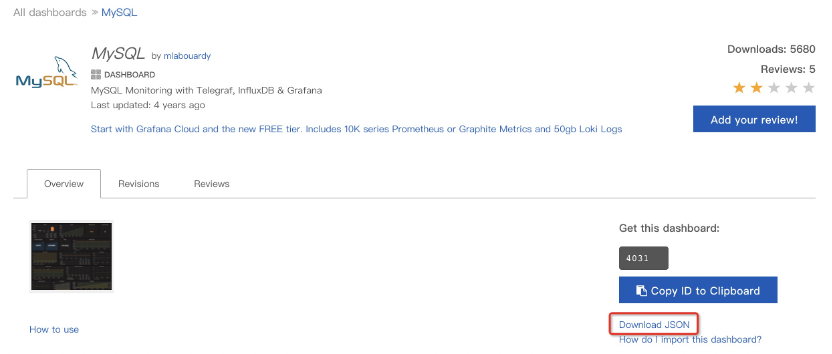
Click Download JSON to download the Json file of this template.
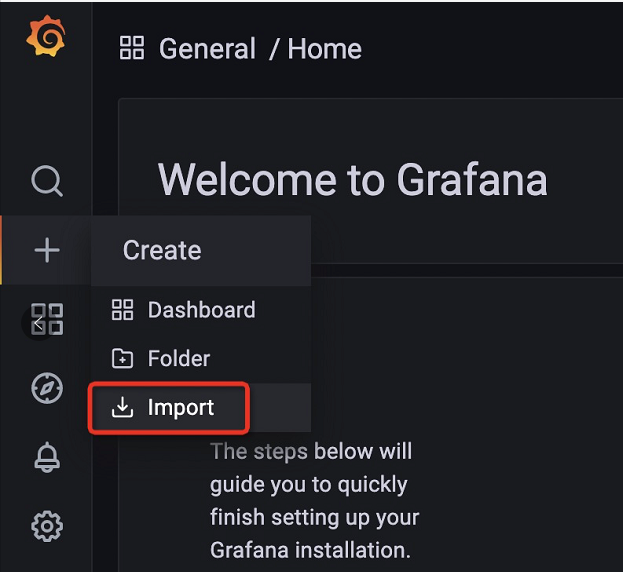
Open Grafana and click Import.
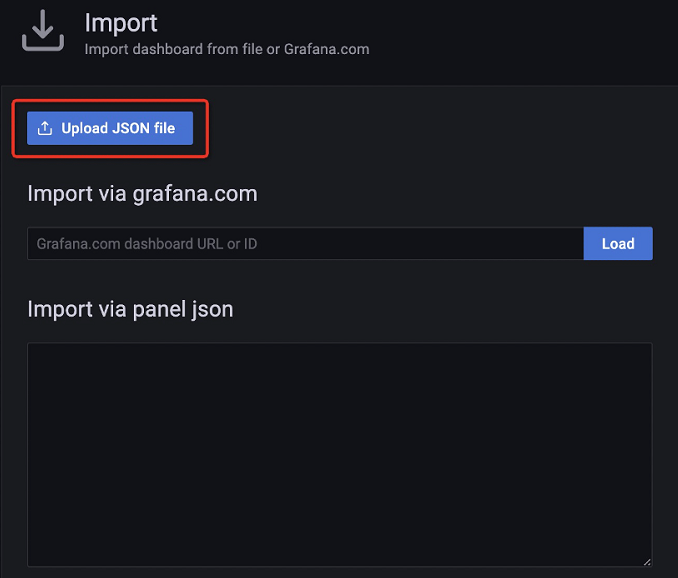
Select the downloaded template Json file.
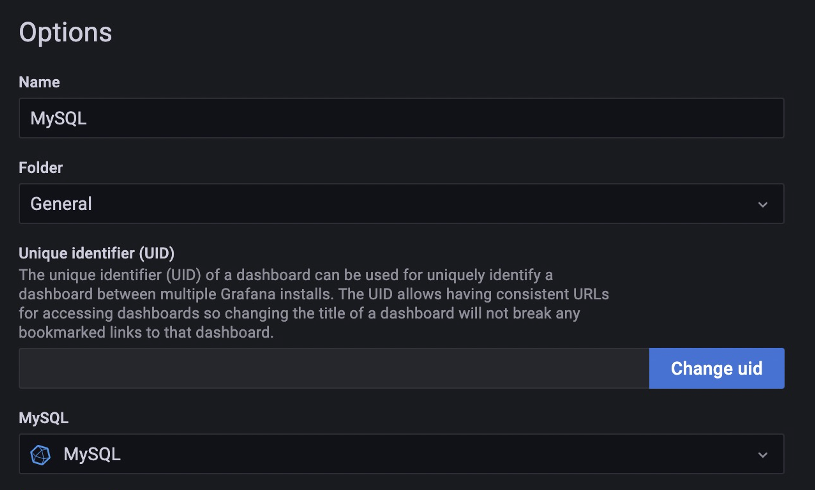
After configuration, click Import.
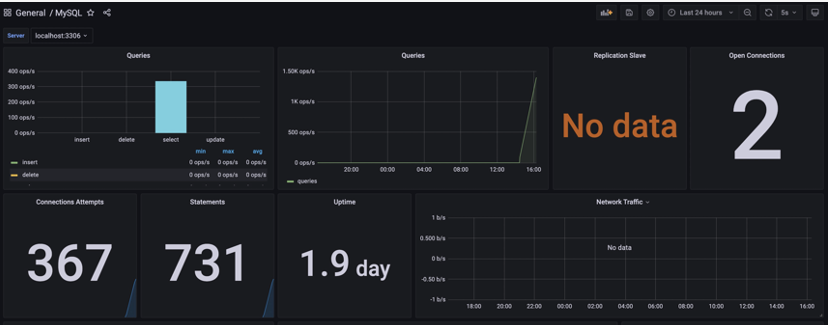
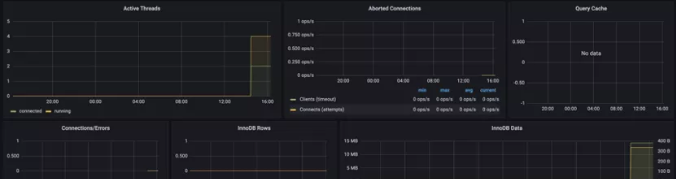
Dashboard creation complete
Monitoring effect diagram:
I also sorted out some learning materials for software testing
Buddy, buddy, the above information, for small software learning partners, it will be very helpful, and I hope it can help you. The small partners you need can pay attention to my WeChat official account: programmers two black, free access!
Learning software testing is a thing that needs to be adhered to. The learning process may be very boring, but if some people learn it together, they probably won't. join us and learn with us. Group number: 785128166. It's accompanied and won't be lonely
If the article is helpful to you, please help me like the collection, so that I have the motivation to continue to update!
Recommended reading
Working in Ali for 6 years, the voice of a 29 year old female software testing engineer