Monitoring is an essential function of a perfect message middleware. Through monitoring, we can check the operation of the system, whether there are any abnormalities, which is the basis of system stability and operation and maintenance.
1. Construction of Monitoring Platform
Download address: https://github.com/apache/rocketmq-externals
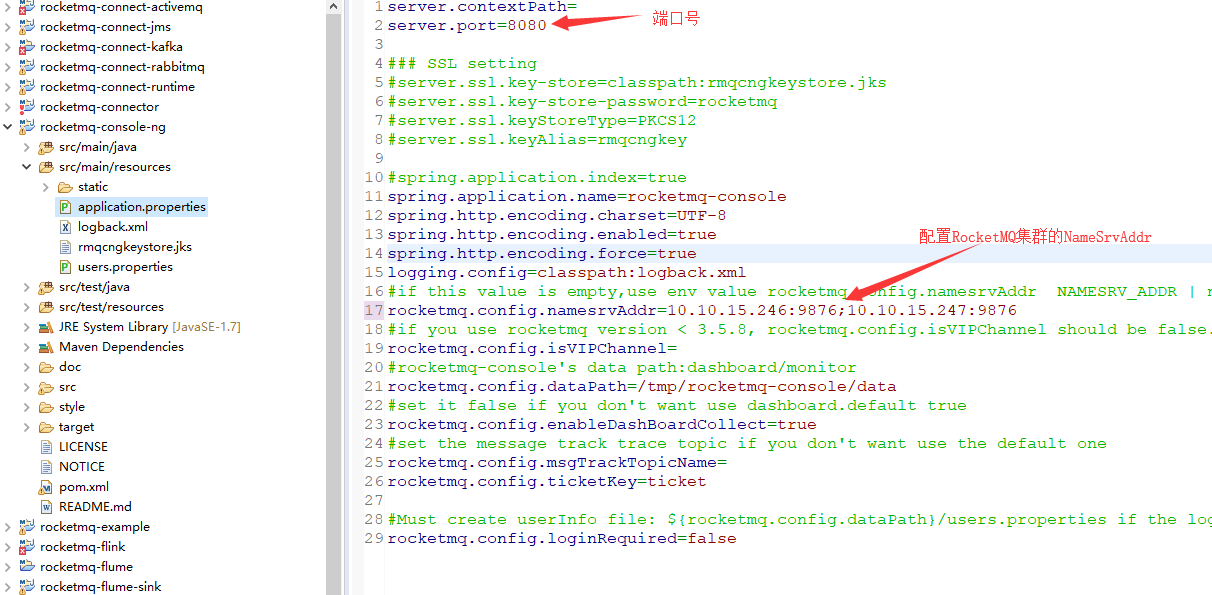
The RocketMQ console needs to download the compilation package itself. It can set its namesrvAddr and port number at compilation time or specify these parameters at program startup (SpringBook project).
Packing with maven
mvn clean package -Dmaven.test.skip=true
Start the program
nohup java -jar rocketmq-console-ng-1.0.0.jar --server.port=8080 --rocketmq.config.namesrvAddr=10.10.15.246:9876;10.10.15.246:9876 &
Browser access
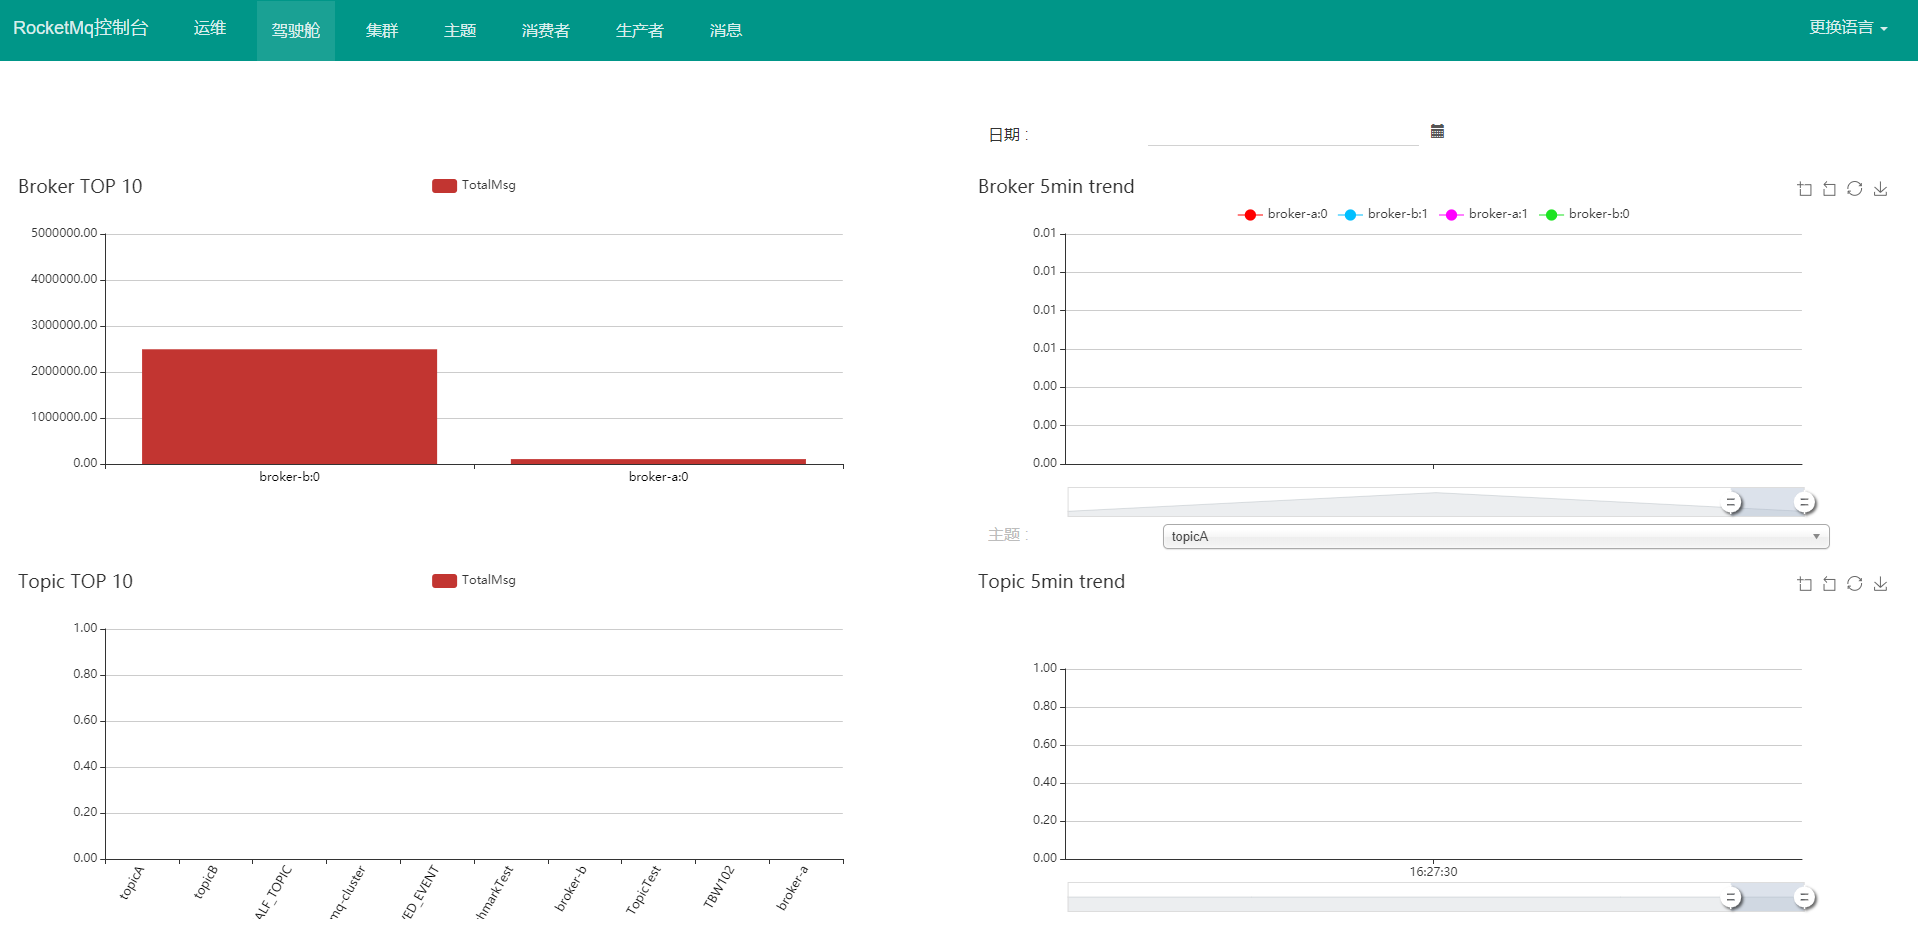
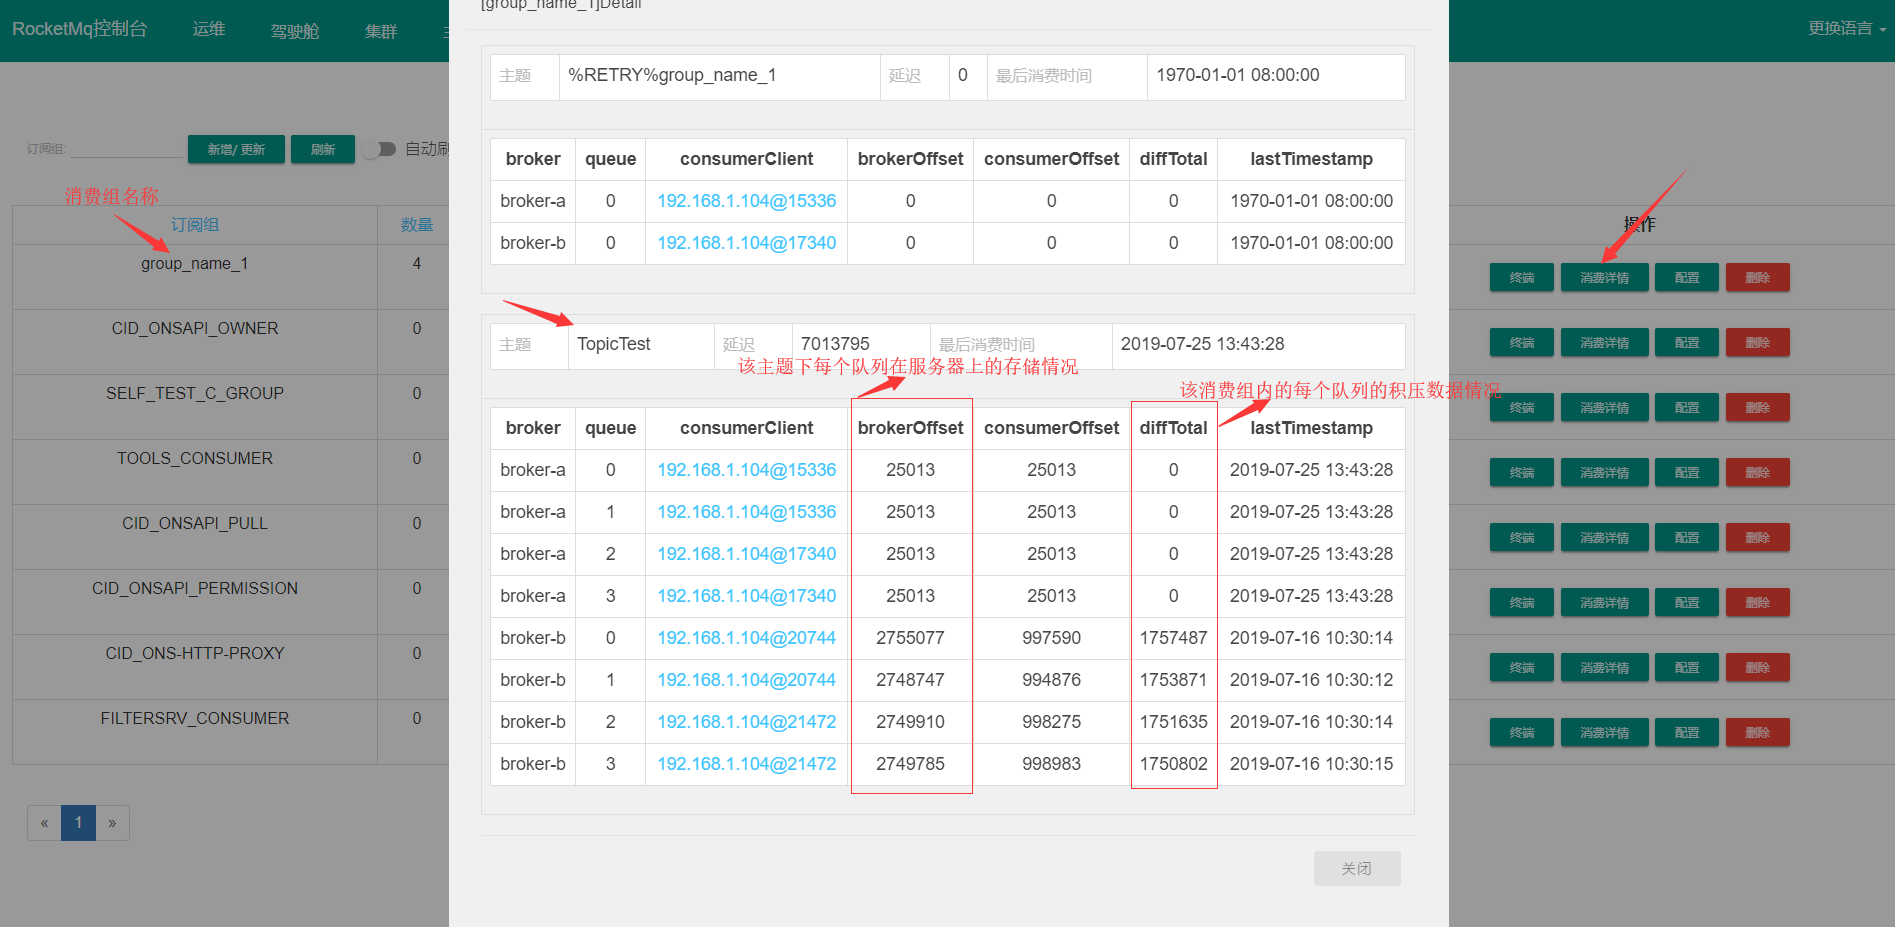
The console not only has related system monitoring data, but also has operation and maintenance functions, such as creating theme, modifying theme, deleting theme, theme list information, theme configuration information, all consumption group information of theme, consumption progress in each queue of each consumption group, Broker number node information, message query and so on. How many?
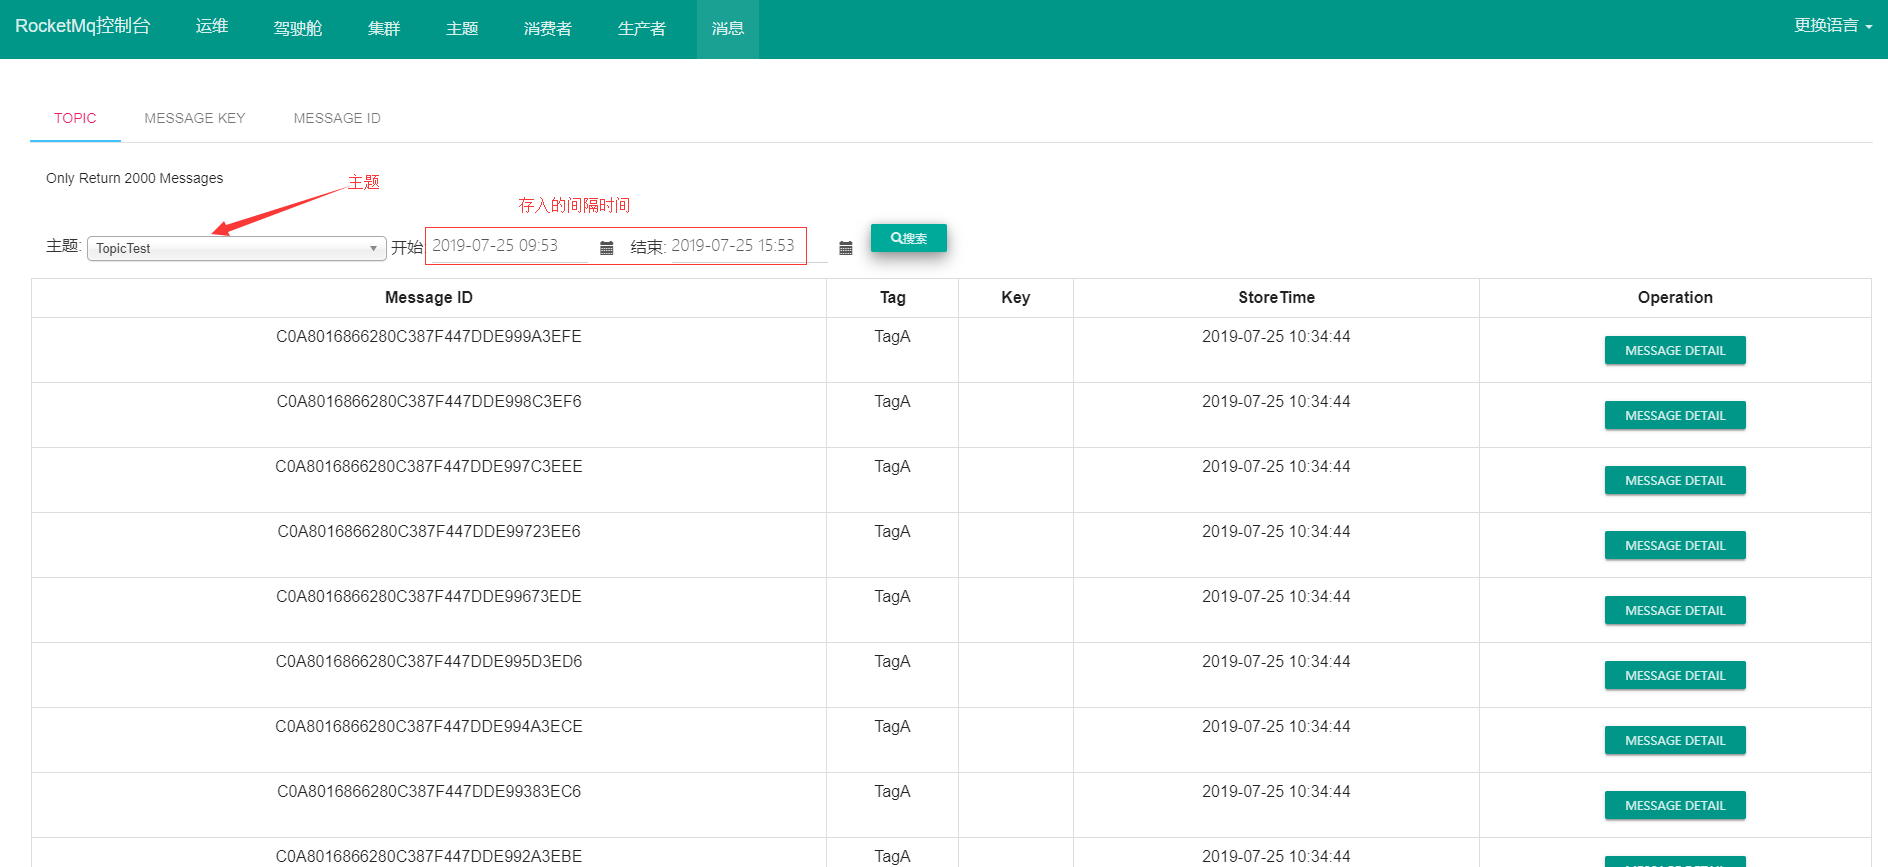
The most commonly used message query, you can see its detailed messages sent
Consumption Progress Query
Other functions can be viewed by themselves.
2. Operations and Maintenance Order
Let's see what console commands RocketMQ provides itself
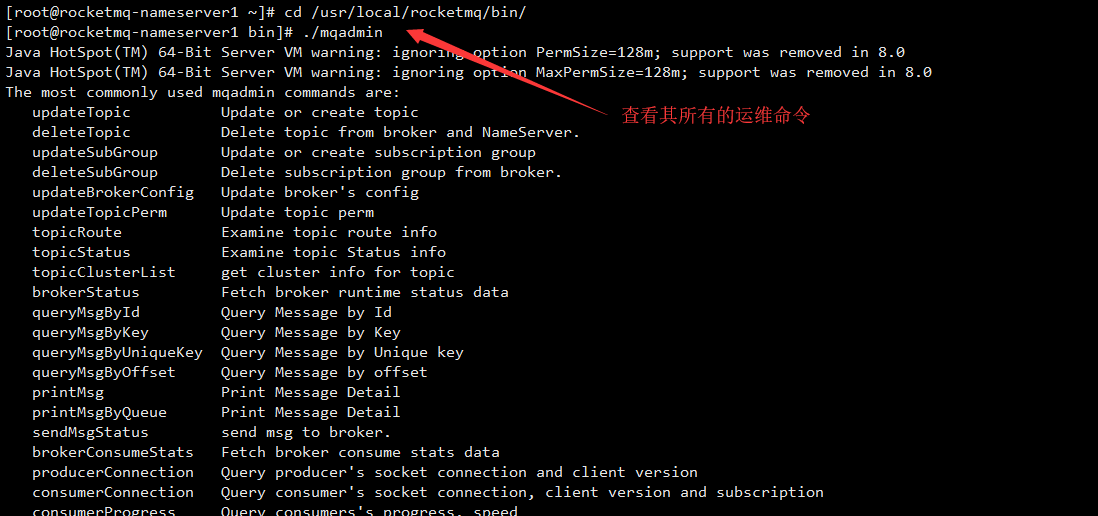
Let's analyze the key common commands
2.1. Create Update Topic
./mqadmin updateTopic -b 10.10.15.247:10911 -t TopicCmd
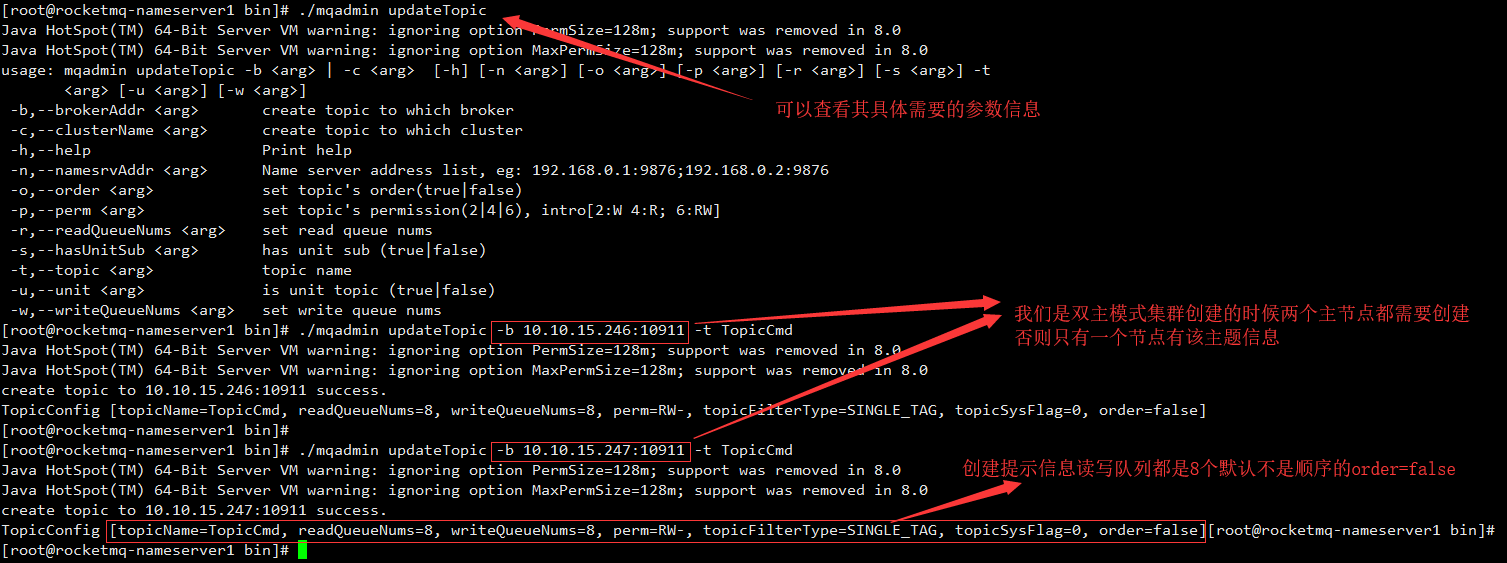
Details of specific parameters can be viewed for hints
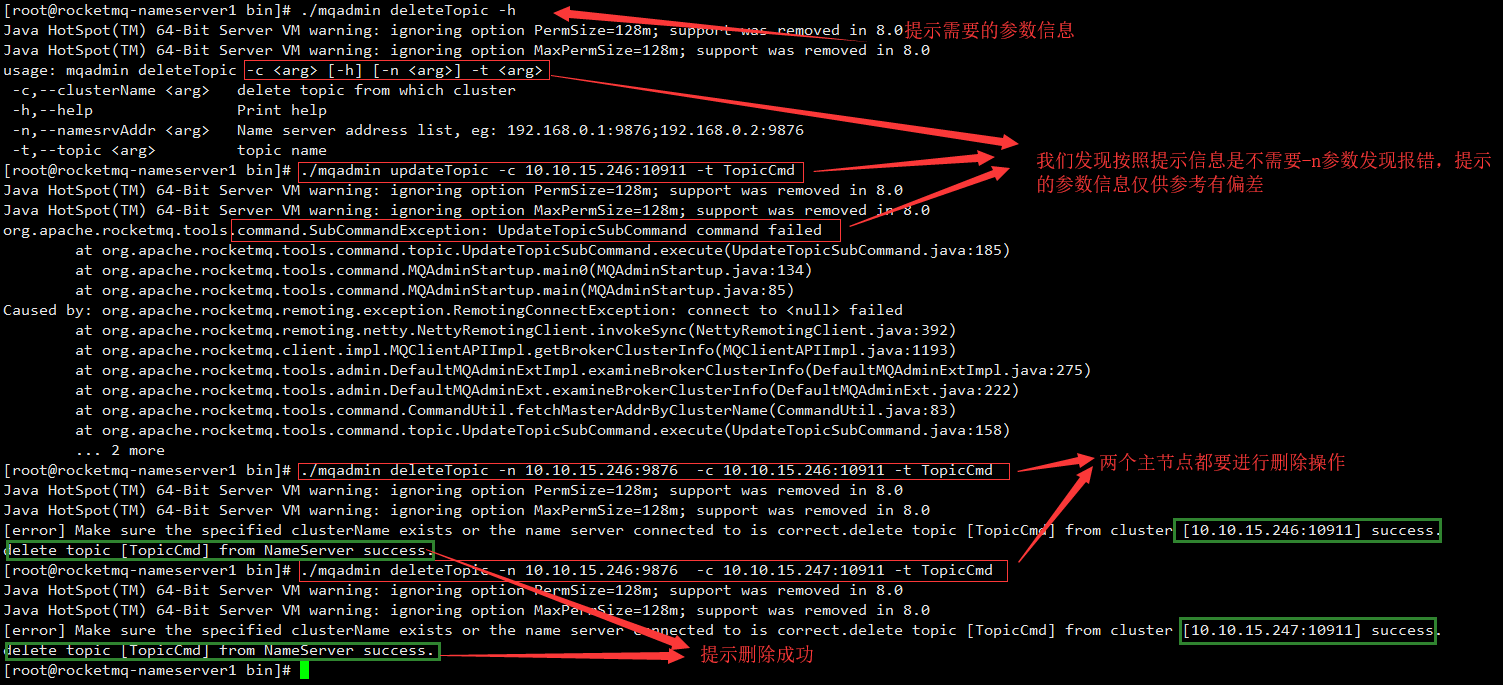
2.2. Delete Topic
./mqadmin deleteTopic -n 10.10.15.246:9876 -c 10.10.15.246:10911 -t TopicCmd
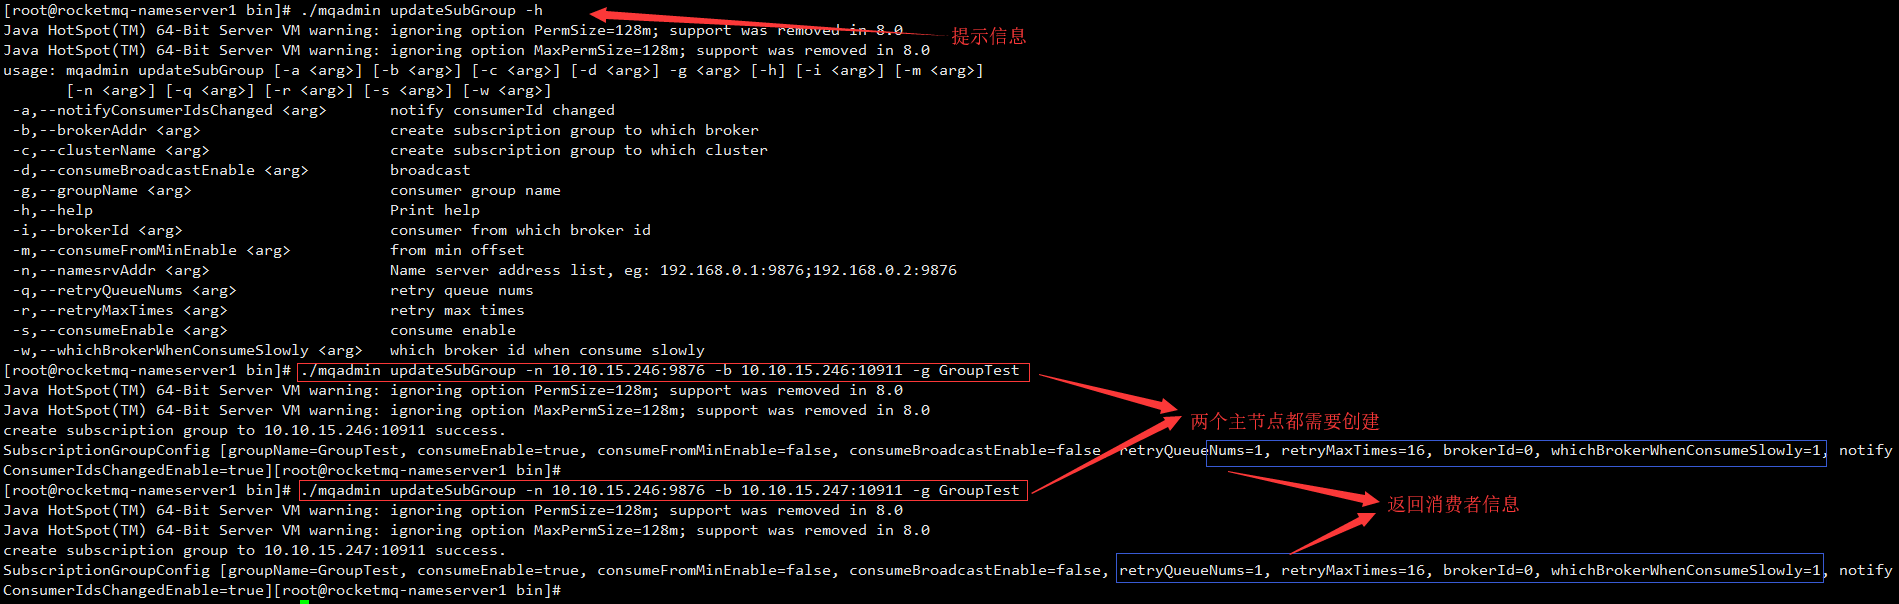
2.3. Create Update Subgroup
./mqadmin updateSubGroup -n 10.10.15.246:9876 -b 10.10.15.247:10911 -g GroupTest
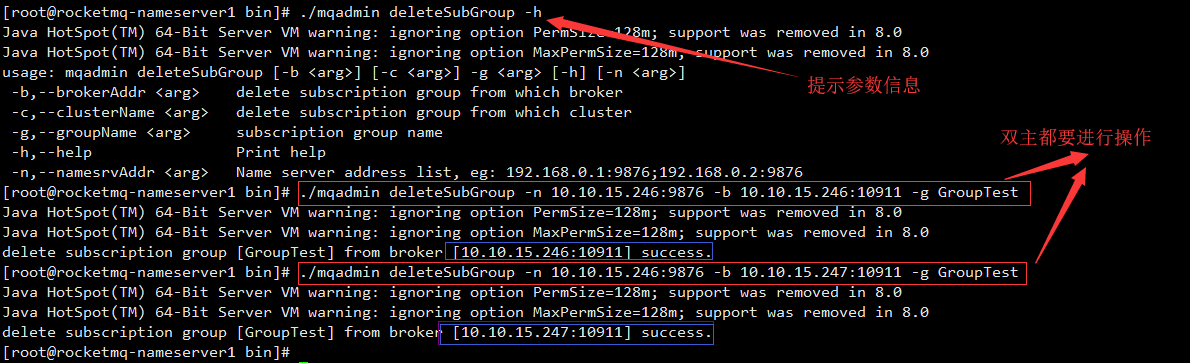
2.4. Delete Subgroup
./mqadmin deleteSubGroup -n 10.10.15.246:9876 -b 10.10.15.246:10911 -g GroupTest
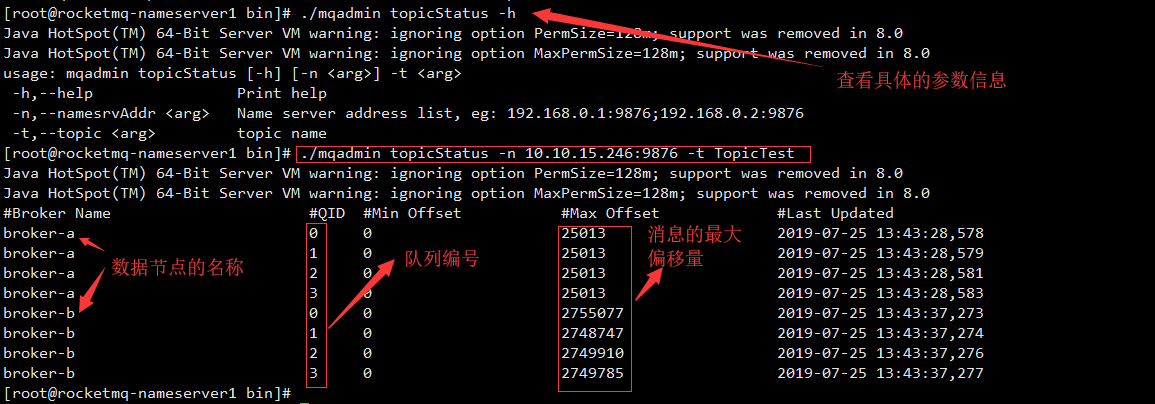
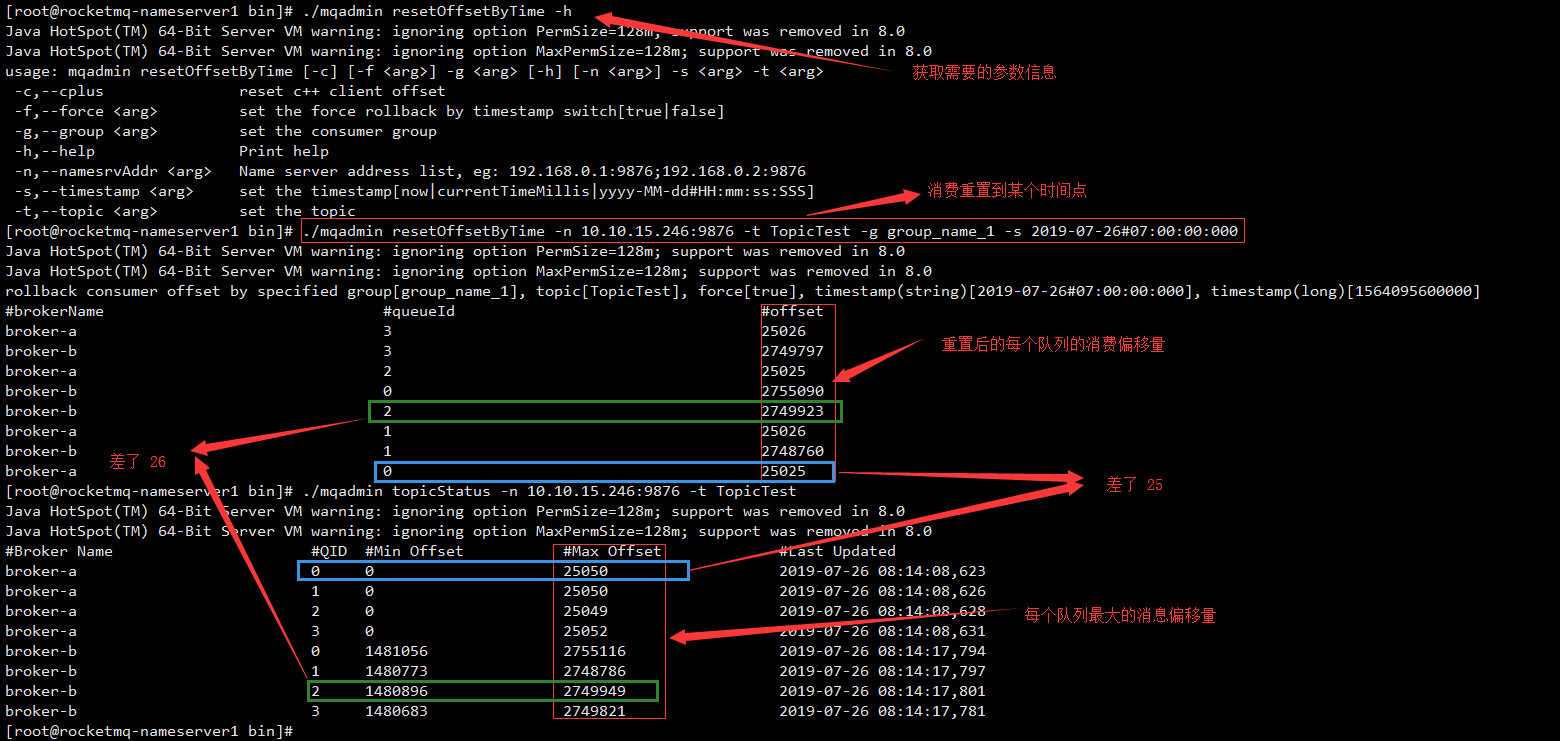
Topic Queue Information
./mqadmin topicStatus -n 10.10.15.246:9876 -t TopicTest
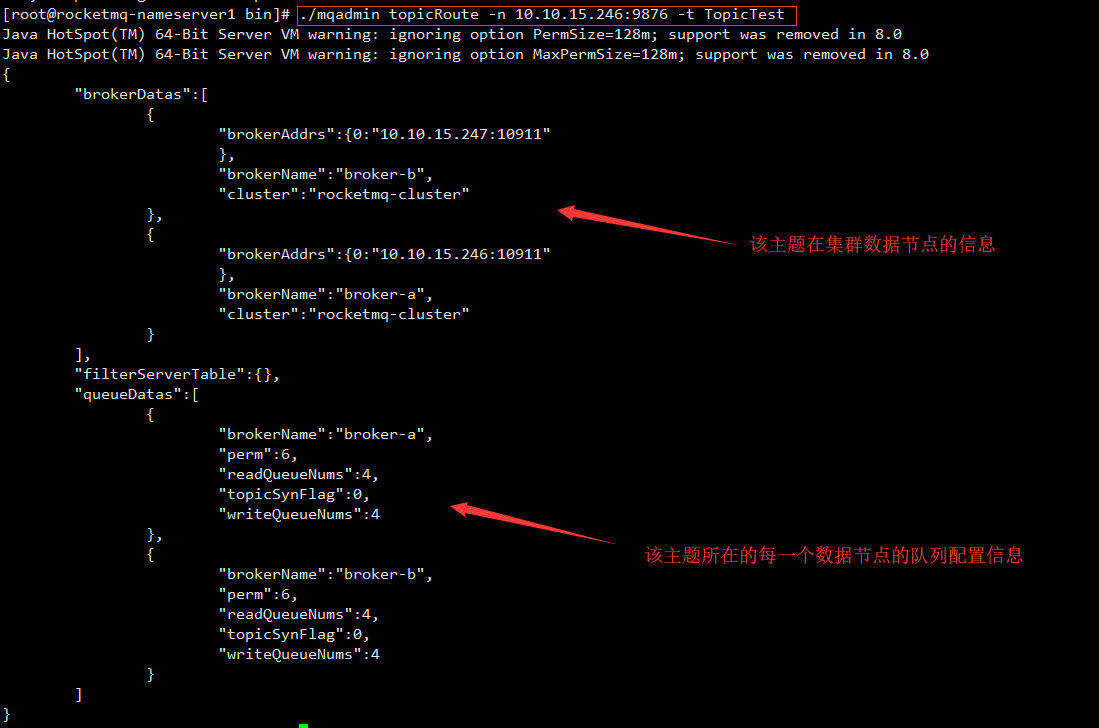
Topic Route
./mqadmin topicRoute -n 10.10.15.246:9876 -t TopicTest
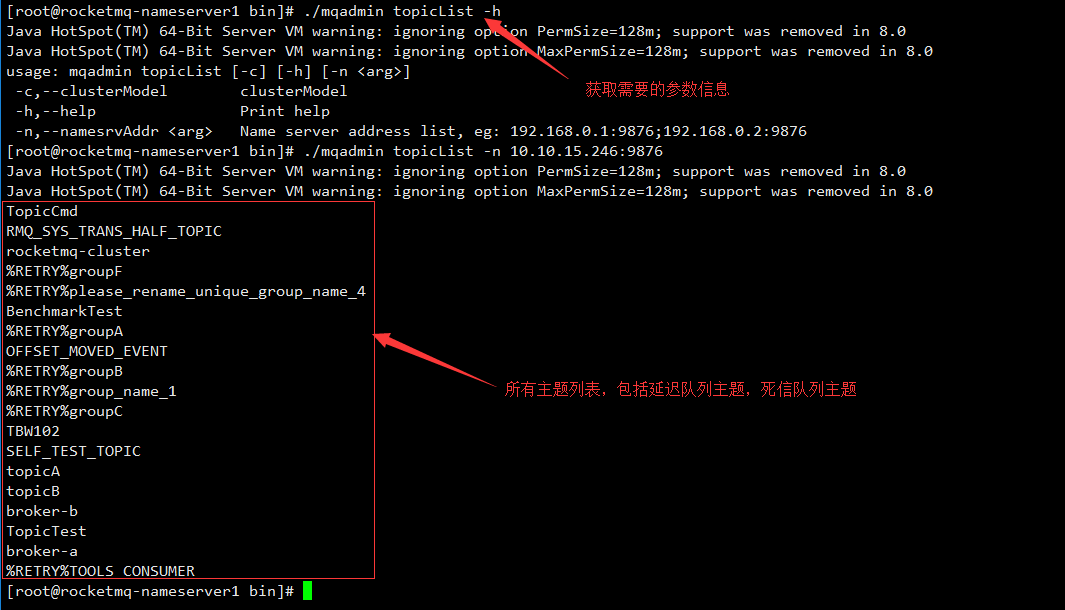
Topic List
./mqadmin topicList -n 10.10.15.246:9876
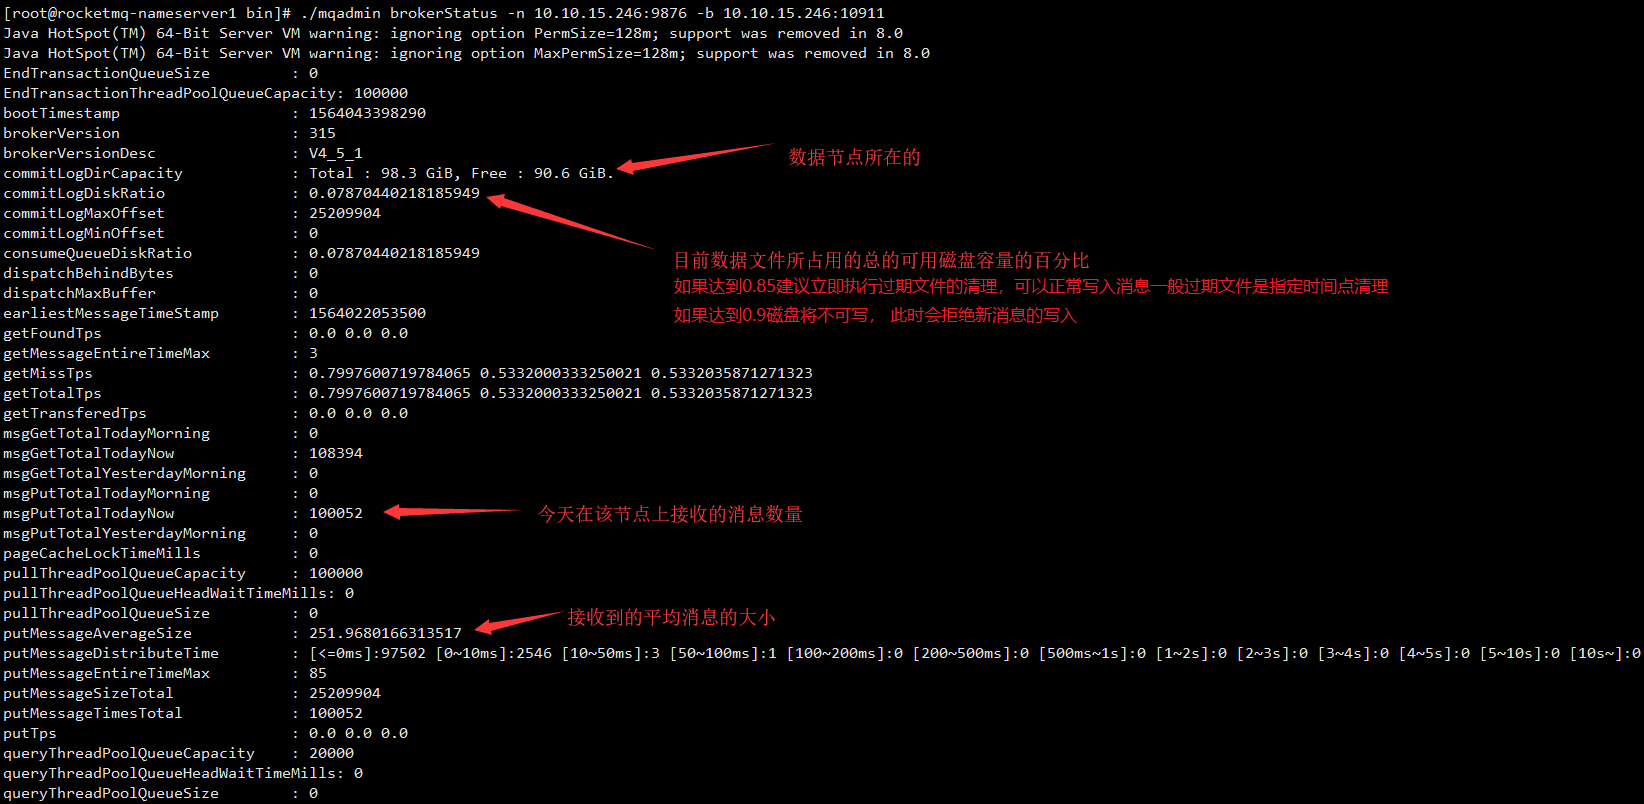
2.8. Broker Node Information (brokerStatus)
./mqadmin brokerStatus -n 10.10.15.246:9876 -b 10.10.15.246:10911
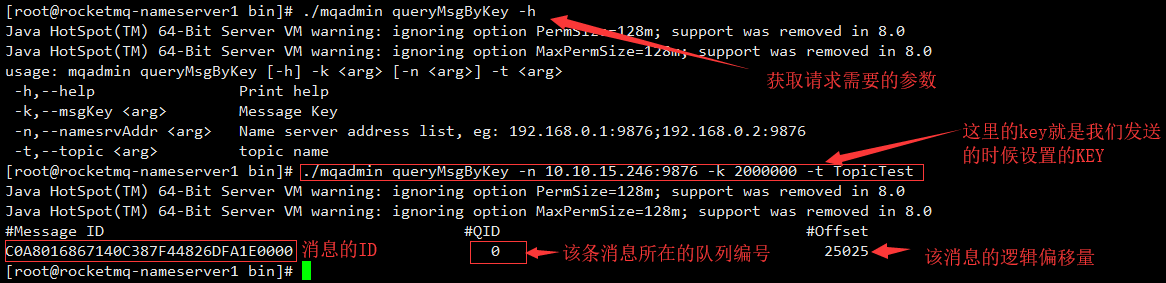
2.9. Query messages through KEY (queryMsgByKey)
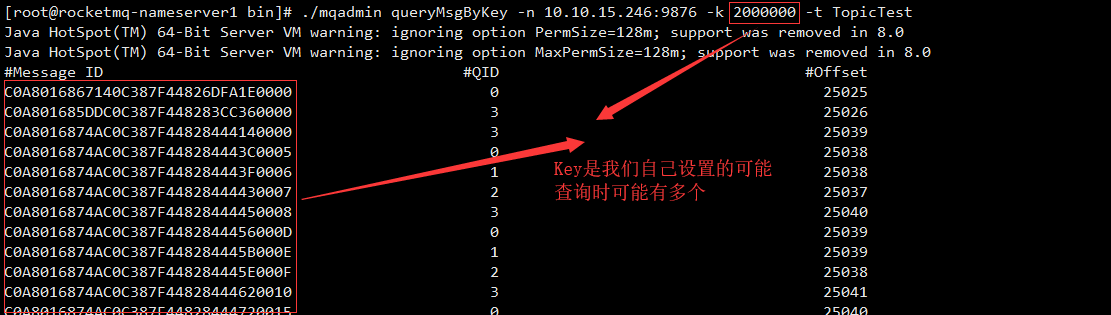
./mqadmin queryMsgByKey -n 10.10.15.246:9876 -k 2000000 -t TopicTest
Note that since KEY is all queries set by the user himself, there may be multiple messages
2.10. Query messages by ID of messages (queryMsgById)
./mqadmin queryMsgById -i 0A0A0FF600002A9F000000000180DD31
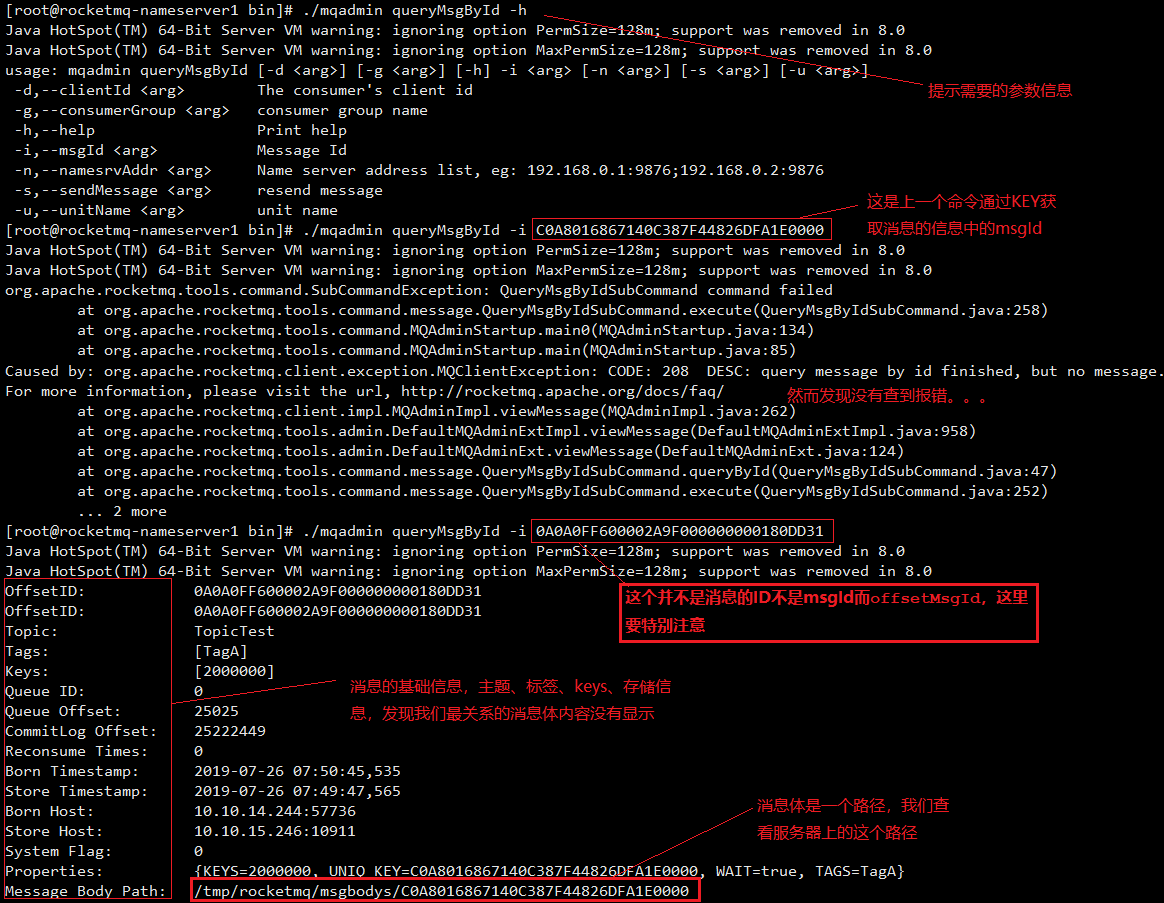
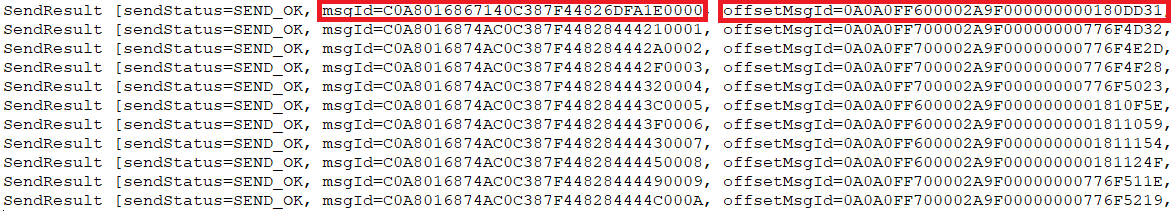
Let's take a look at how offsetMsgId found the message. The message sent back contains relevant information.
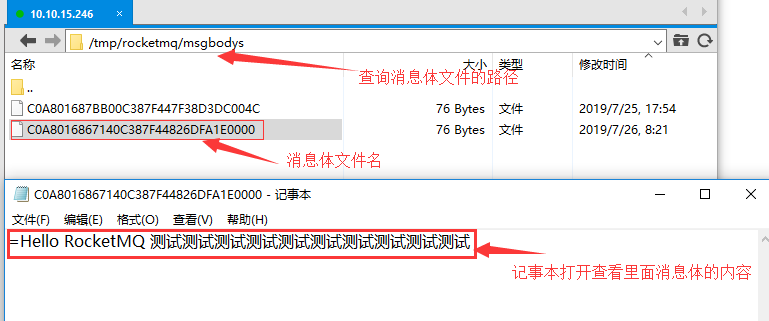
Let's look at the path of the queried message body again.
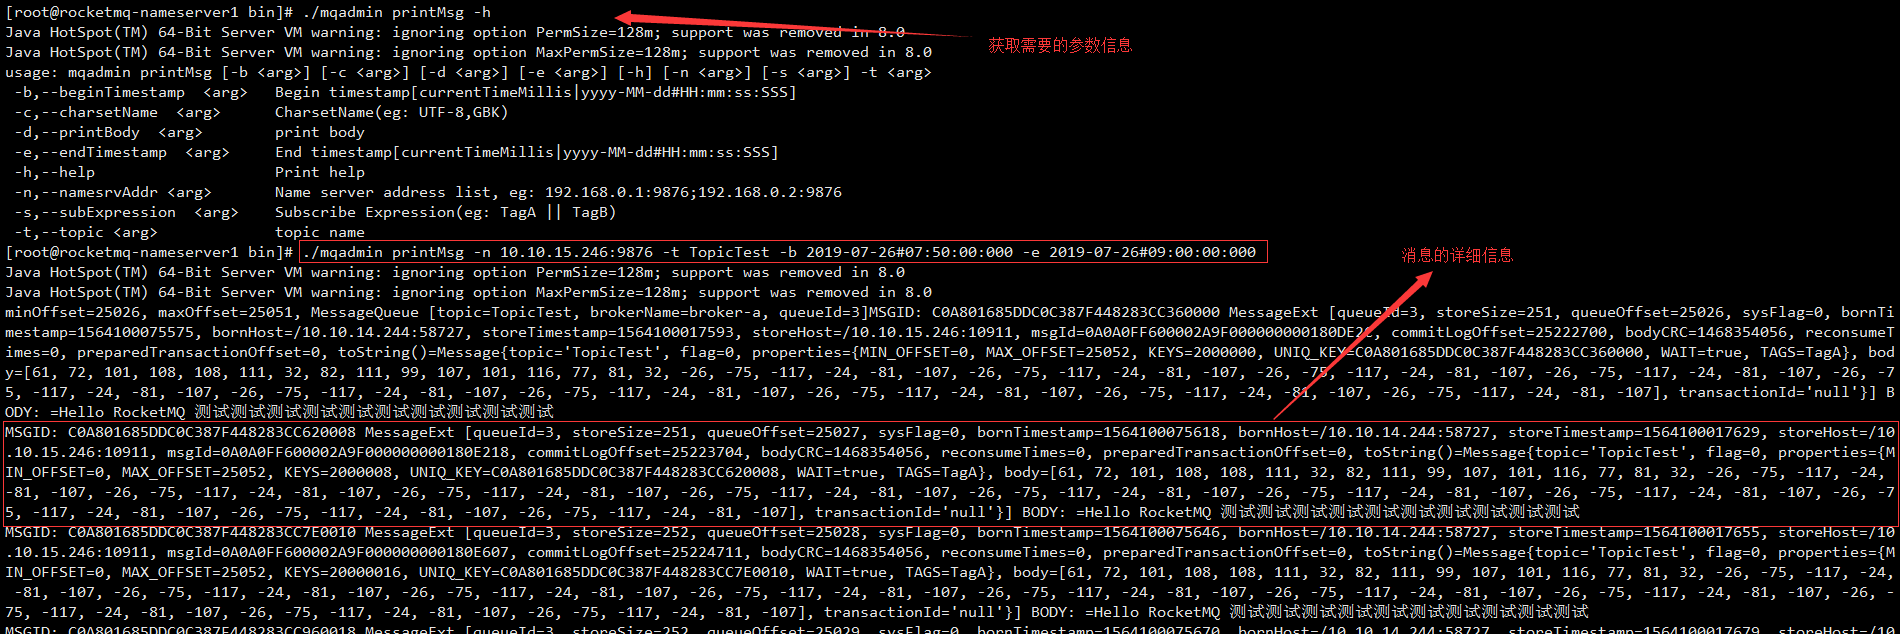
2.11, Print Message (printMsg)
./mqadmin printMsg -n 10.10.15.246:9876 -t TopicTest -b 2019-07-26#07:50:00:000 -e 2019-07-26#09:00:00:000
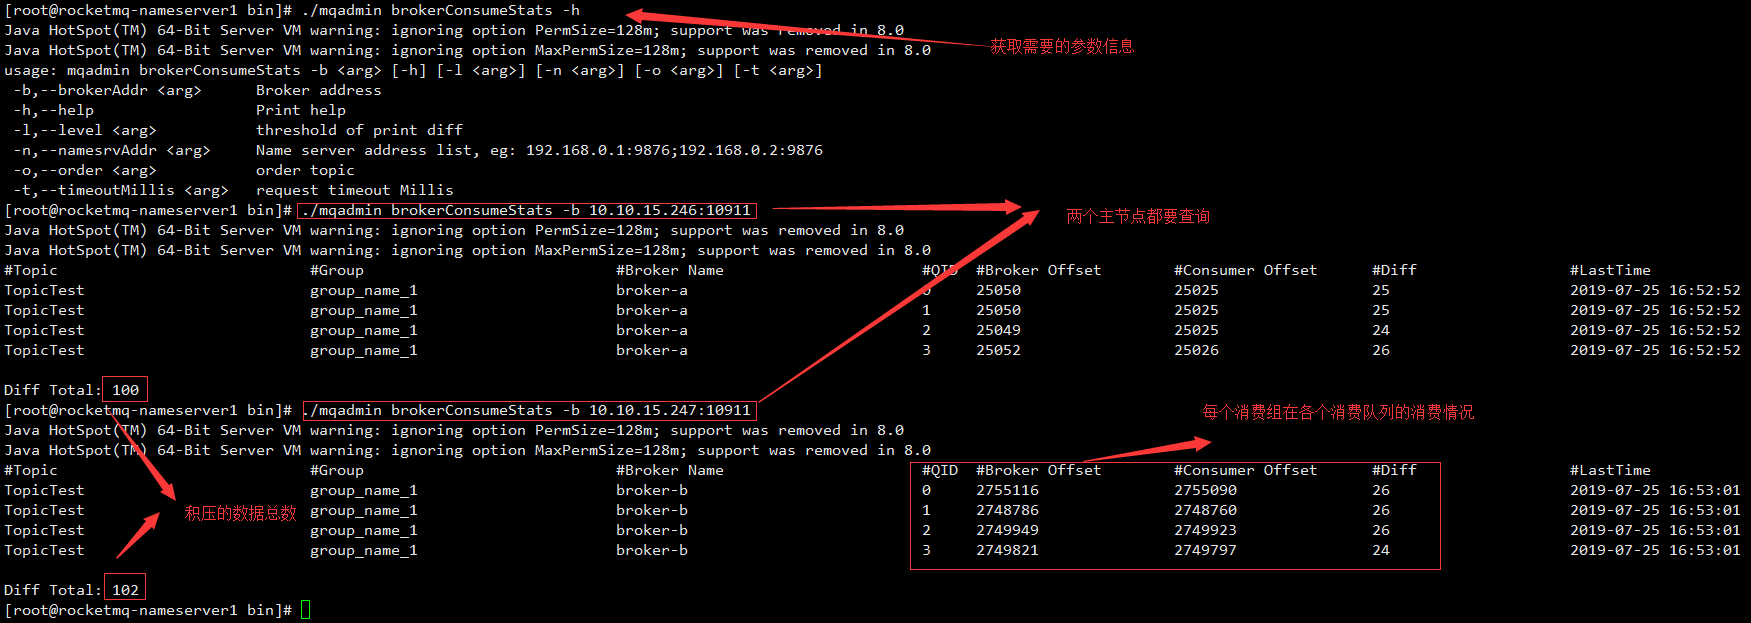
2.12. Broker Consume Stats
./mqadmin brokerConsumeStats -b 10.10.15.246:10911
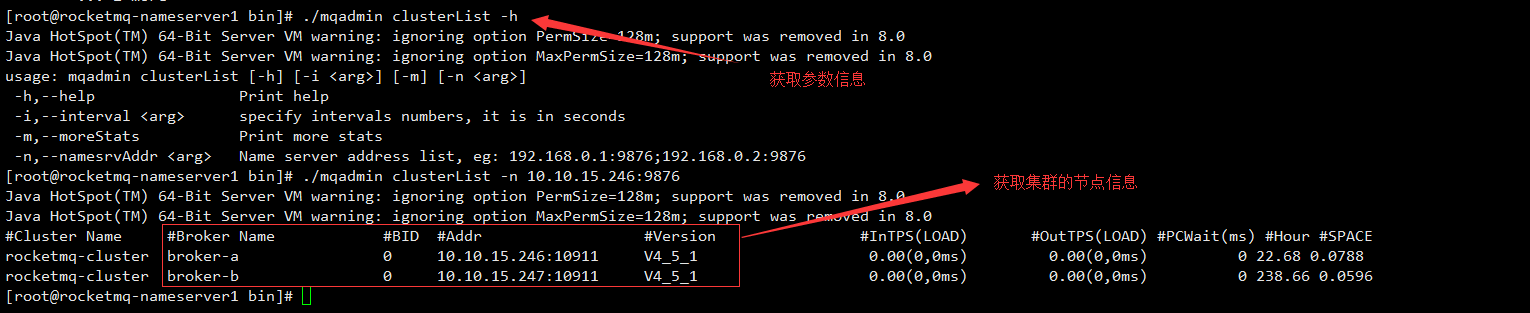
2.13. Cluster Node Information (Cluster List)
./mqadmin clusterList -n 10.10.15.246:9876
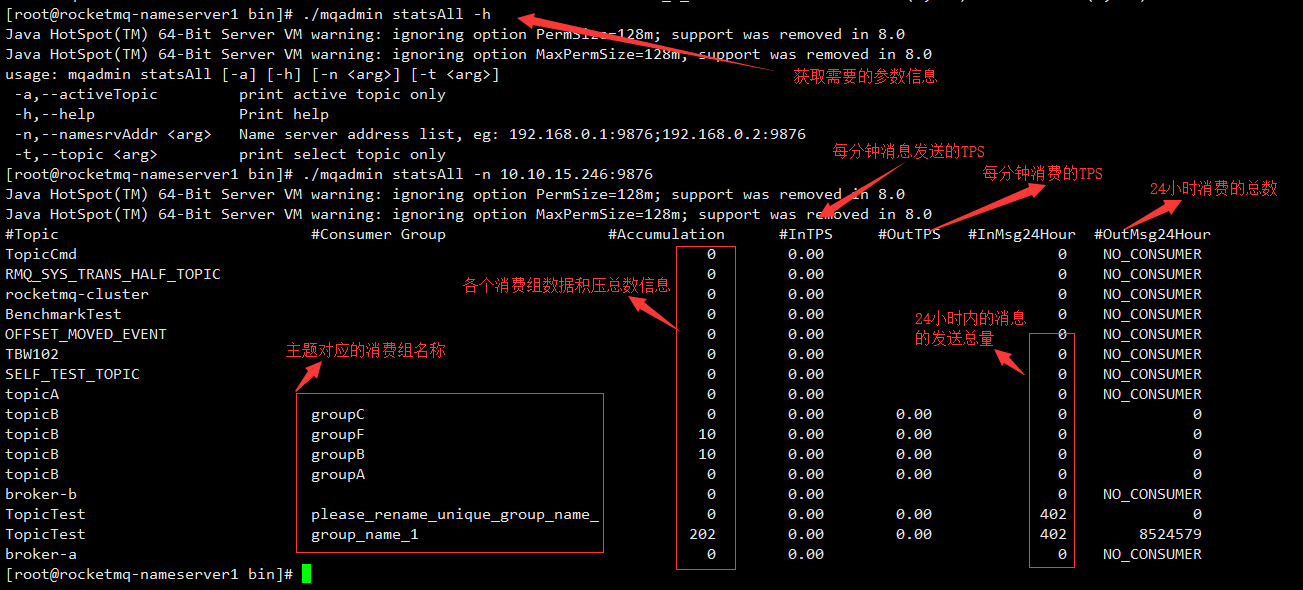
2.14. Overall consumption status information (statsAll)
./mqadmin statsAll -n 10.10.15.246:9876
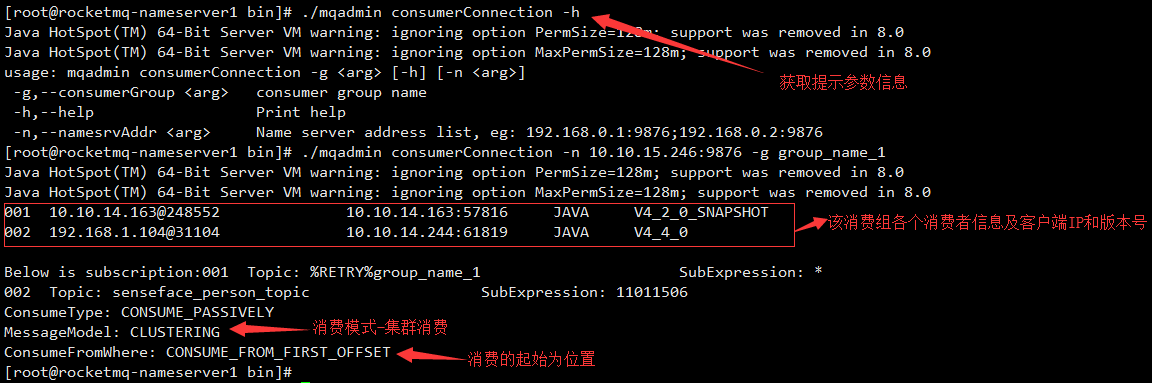
2.15. View Consumer Connection under the Consumer Group
./mqadmin consumerConnection -n 10.10.15.246:9876 -g group_name_1
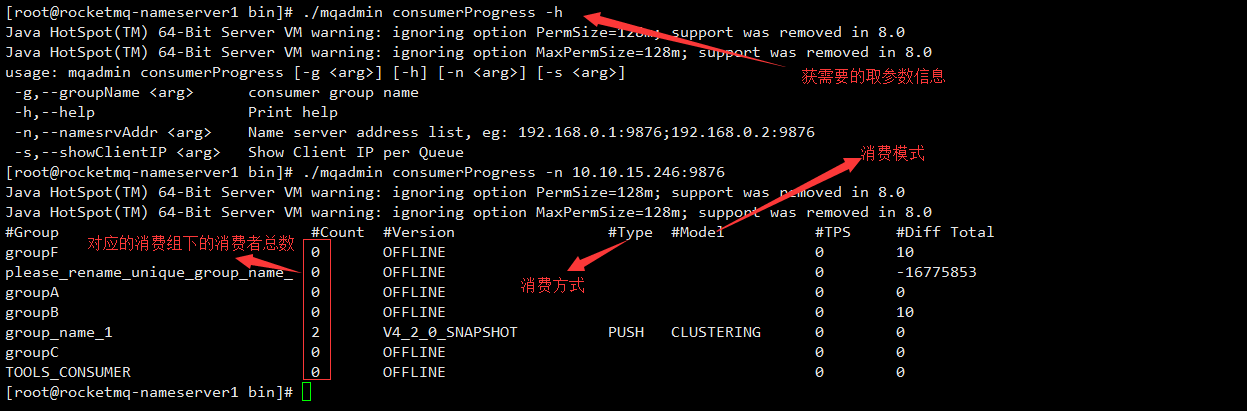
2.16. Consumption Progress
./mqadmin consumerProgress -n 10.10.15.246:9876
2.17. Reset Offset ByTime
./mqadmin resetOffsetByTime -n 10.10.15.246:9876 -t TopicTest -g group_name_1 -s 2019-07-26#07:00:00:000
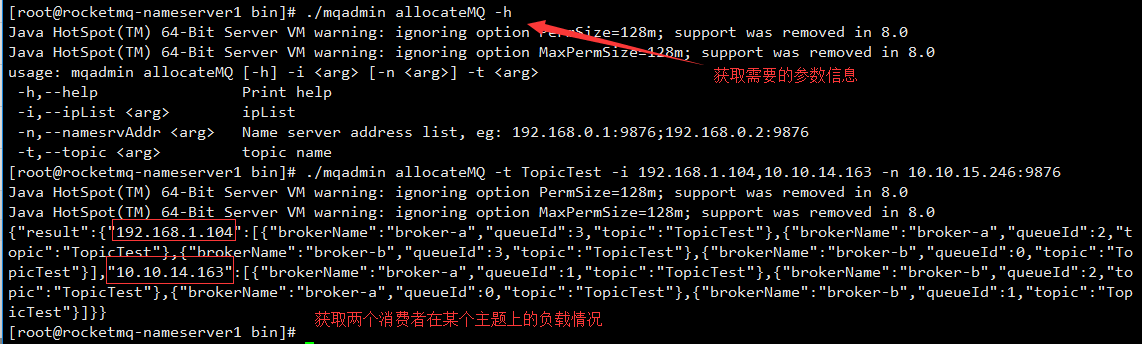
2.18. Message queue load (allocateMQ)
./mqadmin allocateMQ -t TopicTest -i 192.168.1.104,10.10.14.163 -n 10.10.15.246:9876
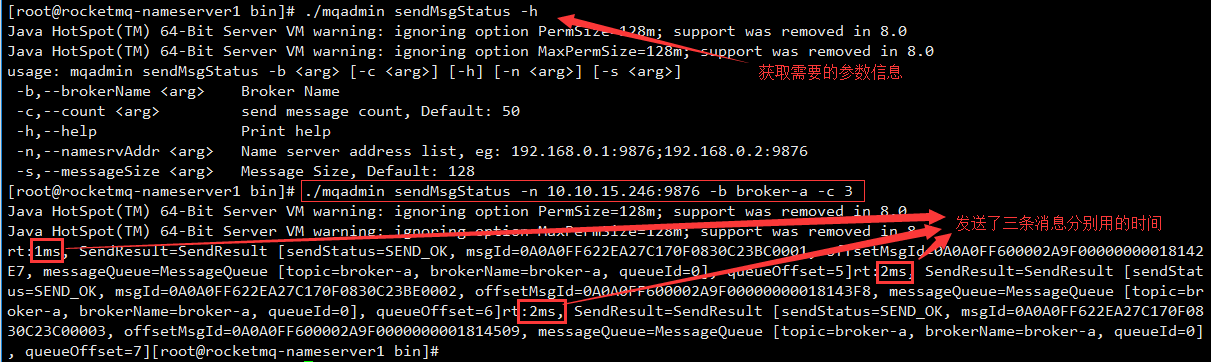
2.19. Test Broker's performance in receiving messages (sendMsgStatus)
./mqadmin sendMsgStatus -n 10.10.15.246:9876 -b broker-a -c 3
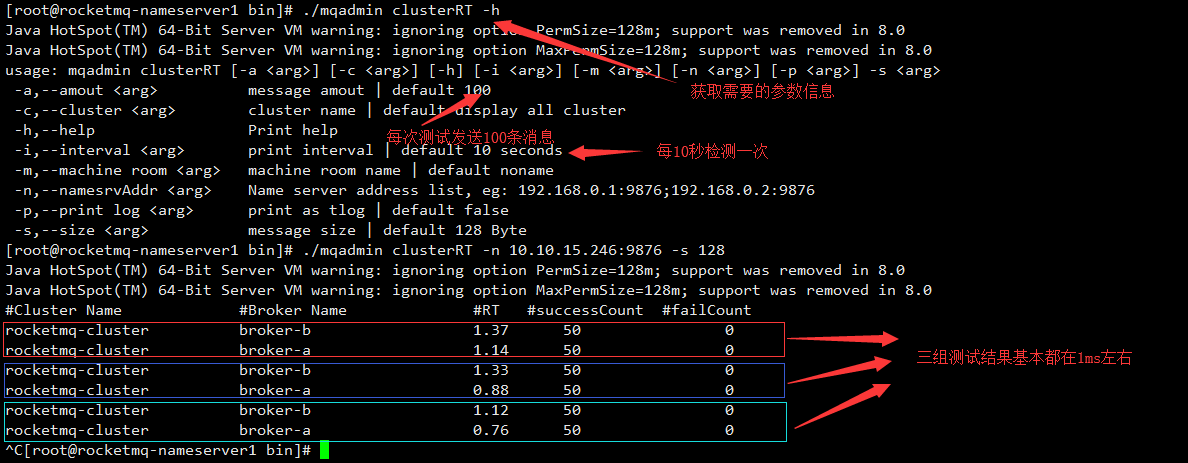
2.20. Testing Cluster Message Sending Performance (Cluster RT)
./mqadmin clusterRT -n 10.10.15.246:9876 -s 128
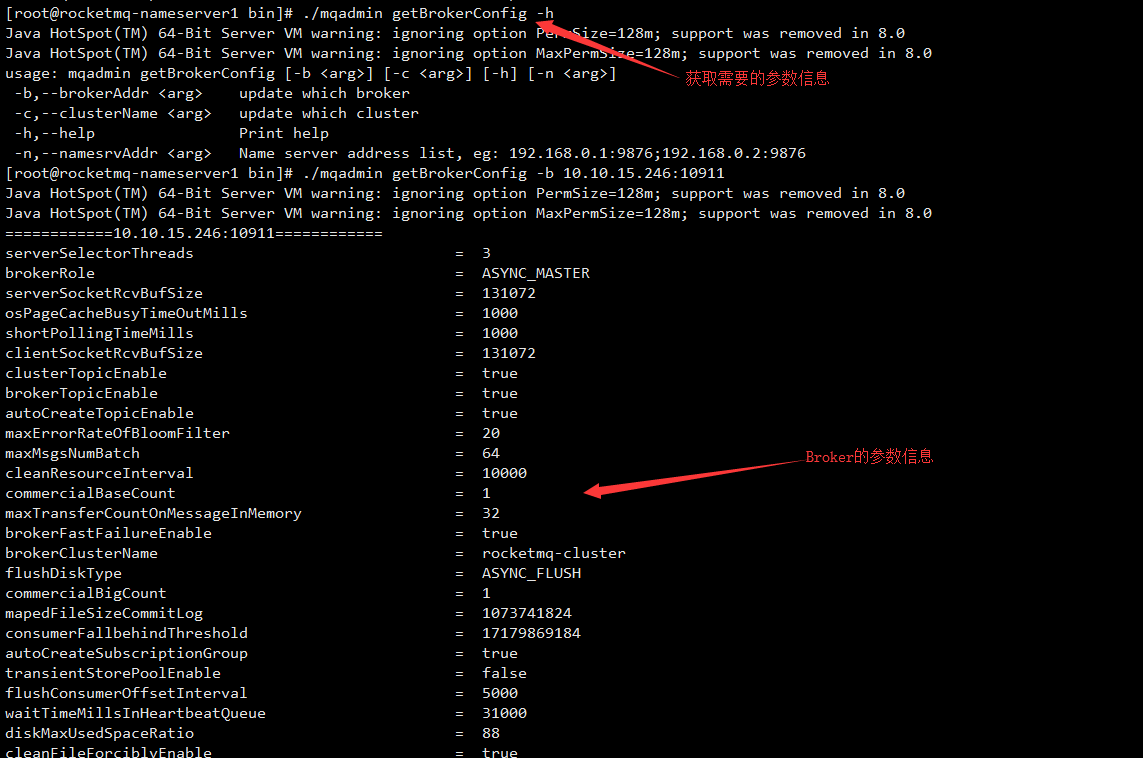
2.21. View Broker Config
./mqadmin getBrokerConfig -b 10.10.15.246:10911