The "risk control ML" series of articles mainly share some of my experiences in financial risk control over the years, including the sharing of risk control modeling, machine learning, big data risk control and other related technologies. Peers are welcome to exchange and join new students to learn and make progress together!
When we first came into contact with these two nouns in the risk control model, the teacher taught us that we can use IV to screen variables. IV (Information Value), whose Chinese name is Information Value, is simply used to measure the prediction ability of variables, and then IV is calculated by WOE. Regardless of the principle, let's draw a conclusion first.
IV range | Variable predictive power |
|---|---|
<0.02 | No predictive power 😯 |
0.02~0.10 | weak 👎 |
0.10~0.30 | secondary 😊 |
`> 0.30 | strong 👍 |
Although this indicator may be easy to use, it is very important to understand its principle, which is very helpful for us to deeply understand variables.
Before we begin to talk about the principle, let's agree on some codes that will be used today.
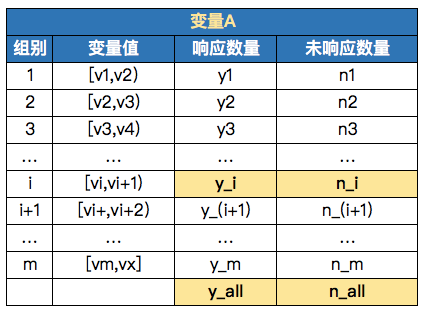
y_i: number of responding customers in group i
y_{all}: sum of all responding customers
n_i: Number of unresponsive customers in group I
n_{all}: sum of all unresponsive customers
Response / unresponsive: refers to the value of the target variable corresponding to each record of the independent variable. The value of the target variable is 0 or 1. Generally, if 1 is a response, 0 is unresponsive.
IV_i: IV value of group I
Py_i: Equal to y_i/y_{all}
Pn_i: Equal to n_i/n_{all}
You can see the following table to understand A wave. Variable A is A continuous variable with A value range of v1-vx. Currently, it is divided into m groups according to some box sorting methods. The specific grouping is as follows:
01 principle of woe
WOE is the abbreviation of weight of evidence. It is a coding form. First of all, we should know that WOE is for category variables, so continuous variables need to be grouped in advance (here is also a good test point. Some people will say that it is box and discrete, and variable optimization can also be started from this point of view).
First, the mathematical calculation formula is given. For the WOE of group i, it can be calculated as follows:
WOE_i = ln(\frac{y_i/y_{all}}{n_i/n_{all}})It can be seen from the formula that the WOE value of group i is equal to the ratio of the proportion of responsive customers in this group to the proportion of unresponsive customers in all unresponsive customers, taking the logarithm. We can also simply convert the above formula:
WOE_i = ln(\frac{y_i/y_{all}}{n_i/n_{all}}) = ln(\frac{y_i/n_i}{y_{all}/n_{all}})Therefore, WOE mainly reflects the proportion of good and bad in the group and the degree of overall differentiation. The greater the WOE, the greater the difference.
Principle of 02 IV
We introduced how to calculate the WOE value of a group, so we can calculate the WOE values of all groups of variables. Correspondingly, each group also has an IV value, which is called IV_i. Of which:
IV_i = (Py_i-Pn_i)*WOE_i IV = \displaystyle\sum^{n}_{i}{IV_i}This is how to calculate the IV value of this variable. Add up the IV value of each group.
03 actual case
Well, the above theory has also talked about some. Let's take an actual variable to calculate.
Let's suppose a scenario. We need to sell tea. Then we don't know where to get a marketing list (mobile phone number) of 1000 people, and then add wechat friends in batches. Finally, 500 mobile phone numbers can successfully search wechat, and then add friends. Finally, 100 people can be successfully added to friends.
There is a customer's age field on our list, so we can use it to calculate the prediction ability of this field for successfully adding friends (responses). We implement it in Excel:
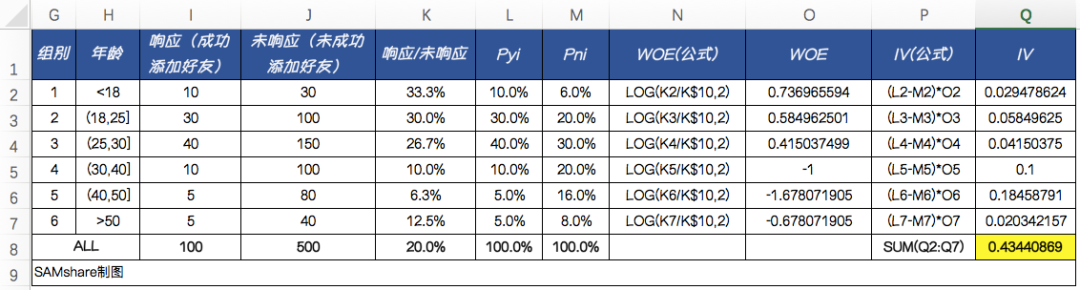
It can be seen that this variable has a strong ability to predict whether we can successfully add to our customers' wechat friends.
04 Python implementation
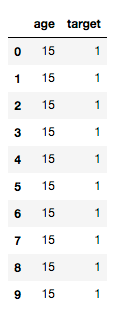
We know that continuous variables need to be converted into category variables before calculating the IV value. Now we import the data into python. The original variables are continuous variables. How can we calculate the IV value in Python? As shown in the following figure: (where target=1 represents response and target=0 represents no response)
The core code is as follows:
def iv_count(data_bad, data_good):
    '''calculation iv value'''
    value_list = set(data_bad.unique()) | set(data_good.unique())
    iv = 0
    len_bad = len(data_bad)
    len_good = len(data_good)
    for value in value_list:
        # Judge whether a class is 0 to avoid infinitesimal and infinity values
        if sum(data_bad == value) == 0:
            bad_rate = 1 / len_bad
        else:
            bad_rate = sum(data_bad == value) / len_bad
        if sum(data_good == value) == 0:
            good_rate = 1 / len_good
        else:
            good_rate = sum(data_good == value) / len_good
        iv += (good_rate - bad_rate) * math.log(good_rate / bad_rate,2)
        print(value,iv)
    return iv
So how do we use it, step by step:
Step 1: import data
The test data set can be obtained by replying 'age' in the background.
data = pd.read_csv('./data/age.csv')

# Define the necessary parameters
feature = data.loc[:,['age']]
labels = data['target']
keep_cols = ['age']
cut_bin_dict = {'age':[0,18,25,30,40,50,100]}
Step 2: divide boxes according to the specified threshold
Box splitting shall be carried out according to the same box splitting logic of Excel:
cut_bin = cut_bin_dict['age']
# Divide the boxes according to the box division threshold, and replace the missing value with Blank to distinguish good and bad samples
data_bad = pd.cut(feature['age'], cut_bin, right=False).cat.add_categories(['Blank']).fillna('Blank')[labels == 1]
data_good = pd.cut(feature['age'], cut_bin, right=False
).cat.add_categories(['Blank']).fillna('Blank')[labels == 0]
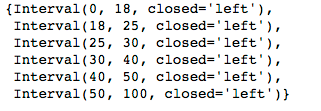
value_list = set(data_bad.unique()) | set(data_good.unique())
value_list
Step 3: call function calculation IV
iv_series['age'] = iv_count(data_bad, data_good)
iv_series
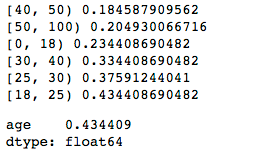
It can be seen that it is completely consistent with the results of our Excel calculation!
05 "I want to type 10" version
Well, the above calculation for a single variable IV is OK. What can you do if there are a bunch of variables that need you to calculate IV? In fact, the principle is very simple, that is, write a cycle. Here, we have written one, which you can refer to. Here are some details that need to be explained.
1) Pay attention to distinguish the types of variables. Numerical variables and category variables should be treated differently.
2) Note whether the number of responses (unresponsive) in a group is zero after grouping. If it is zero, it needs to be handled.
Put the code on, and you can try to run it:
def get_iv_series(feature, labels, keep_cols=None, cut_bin_dict=None):
    '''
    Calculate the maximum of each variable iv value,get_iv_series Method reference is as follows:
    ------------------------------------------------------------
    The input results are as follows:
        feature: Feature space of data set
        labels: Output space of dataset
        keep_cols: Need to calculate iv Variable list of values
        cut_bin_dict: Threshold Dictionary of numerical variables to be boxed,Format is{'col1':[value1,value2,...], 'col2':[value1,value2,...], ...}
    ------------------------------------------------------------
    The input results are as follows:
        iv_series: Maximum of each variable IV value
    '''
    def iv_count(data_bad, data_good):
        '''calculation iv value'''
        value_list = set(data_bad.unique()) | set(data_good.unique())
        iv = 0
        len_bad = len(data_bad)
        len_good = len(data_good)
        for value in value_list:
            # Judge whether a class is 0 to avoid infinitesimal and infinity values
            if sum(data_bad == value) == 0:
                bad_rate = 1 / len_bad
            else:
                bad_rate = sum(data_bad == value) / len_bad
            if sum(data_good == value) == 0:
                good_rate = 1 / len_good
            else:
                good_rate = sum(data_good == value) / len_good
            iv += (good_rate - bad_rate) * math.log(good_rate / bad_rate,2)
        return iv

    if keep_cols is None:
        keep_cols = sorted(list(feature.columns))
    col_types = feature[keep_cols].dtypes
    categorical_feature = list(col_types[col_types == 'object'].index)
    numerical_feature = list(col_types[col_types != 'object'].index)

    iv_series = pd.Series()

    # Traverse numeric variables to calculate iv values
    for col in numerical_feature:
        cut_bin = cut_bin_dict[col]
        # Divide the boxes according to the box division threshold, and replace the missing value with Blank to distinguish good and bad samples
        data_bad = pd.cut(feature[col], cut_bin, right=False).cat.add_categories(['Blank']).fillna('Blank')[labels == 1]
        data_good = pd.cut(feature[col], cut_bin, right=False
                           ).cat.add_categories(['Blank']).fillna('Blank')[labels == 0]
        iv_series[col] = iv_count(data_bad, data_good)
    # Traverse category variables to calculate iv values
    for col in categorical_feature:
        # Replace the missing value with Blank to distinguish between good and bad samples
        data_bad = feature[col].fillna('Blank')[labels == 1]
        data_good = feature[col].fillna('Blank')[labels == 0]
        iv_series[col] = iv_count(data_bad, data_good)

    return iv_series
Call demo:
iv_series = get_iv_series(feature, labels, keep_cols, cut_bin_dict=cut_bin_dict)
iv_series
# age    0.434409
06 summarize
Remember the predictive power mapping of IV values:
IV range | Variable predictive power |
|---|---|
<0.02 | No predictive power 😯 |
0.02~0.10 | weak 👎 |
0.10~0.30 | secondary 😊 |
`> 0.30 | strong 👍 |
If you want to reproduce the code, you can output 'age' from my public account background to obtain the test set, or play with your current data set, but you have to pay attention to some details and convert the data format.