Experimental environment
server1    172.25.11.1    elasticsearch,nginx  ,logstash
server2    172.25.11.2    redis,logstash
server3    172.25.11.3    kibana
Install kibana on server3
yum install -y kibana-4.5.1-1.x86_64.rpm
vim /opt/kibana/config/kibana.yml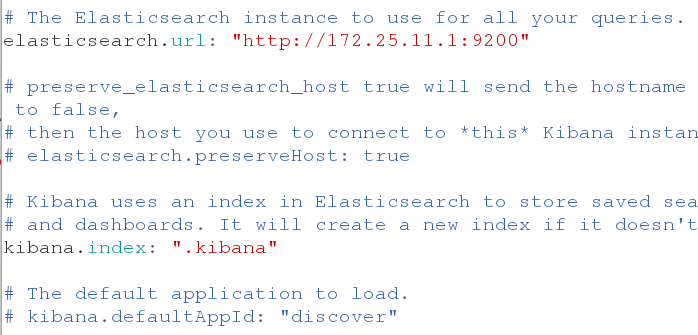
/etc/init.d/kibana start
netstat -antupl
Browser access: 172.25.11.3:5601 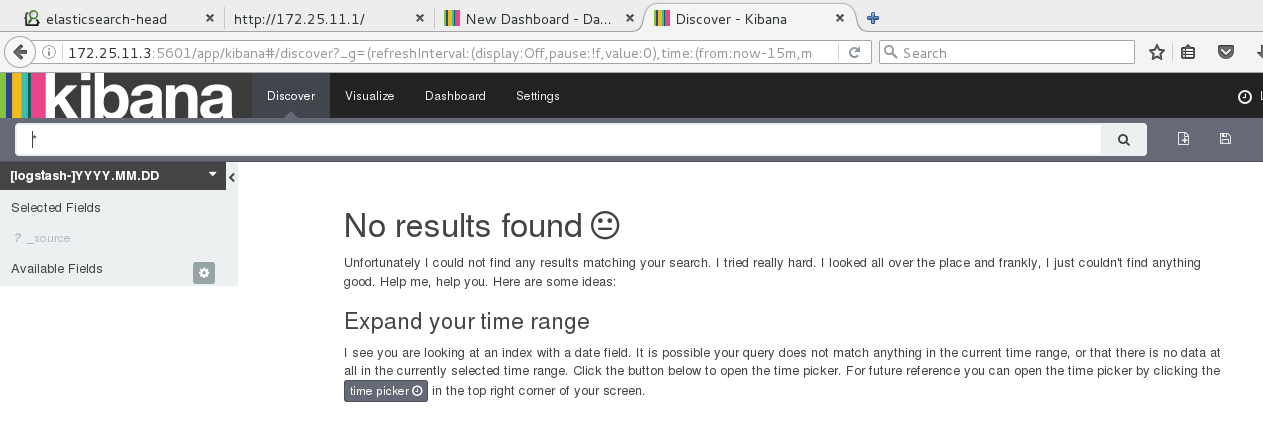
Click settings 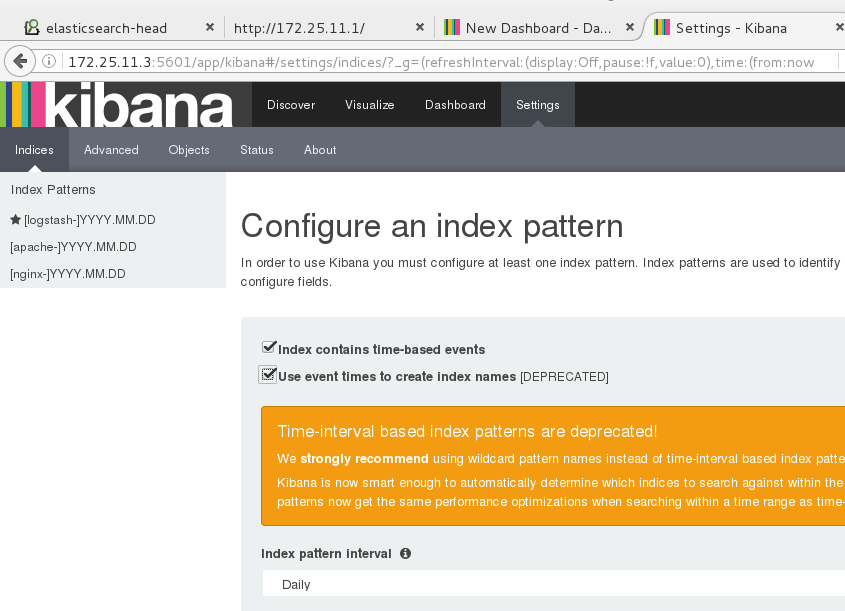
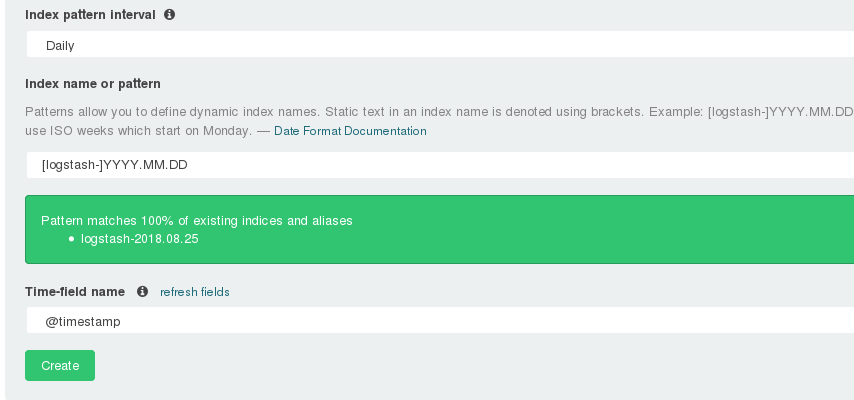
Click Discover - > top right clock - > select today 
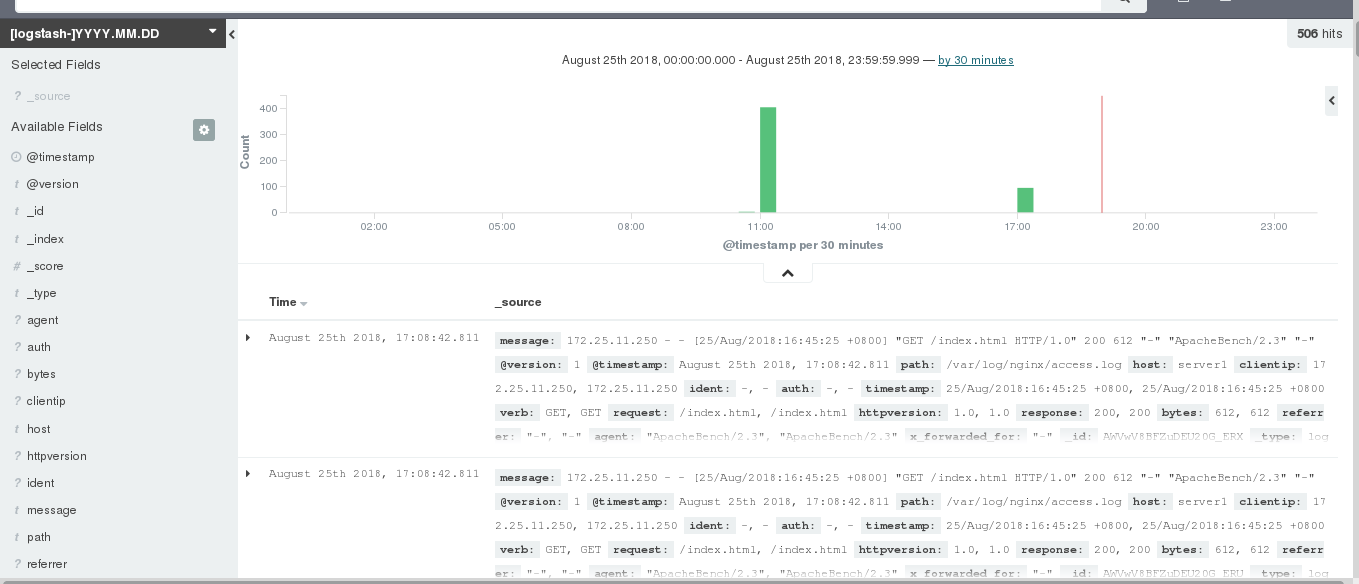
redis to do the process of decoupling
logstash input{nginx} out{redis} -> input{redis} output {elasticsearch}–>elasticsearch–>kibana
server2:
Install redis
tar zxf redis-3.0.6.tar.gz
cd redis-3.0.6
yum install -y gcc
make
make install
cd utils/
Start service: (all the way back)
[root@server2 utils]# ./install_server.sh
Welcome to the redis service installer
This script will help you easily set up a running redis server

Please select the redis port for this instance: [6379]
Selecting default: 6379
Please select the redis config file name [/etc/redis/6379.conf]
Selected default - /etc/redis/6379.conf
Please select the redis log file name [/var/log/redis_6379.log]
Selected default - /var/log/redis_6379.log
Please select the data directory for this instance [/var/lib/redis/6379]
Selected default - /var/lib/redis/6379
Please select the redis executable path [/usr/local/bin/redis-server]
Selected config:
Port           : 6379
Config file    : /etc/redis/6379.conf
Log file       : /var/log/redis_6379.log
Data dir       : /var/lib/redis/6379
Executable     : /usr/local/bin/redis-server
Cli Executable : /usr/local/bin/redis-cli
Is this ok? Then press ENTER to go on or Ctrl-C to abort.
Copied /tmp/6379.conf => /etc/init.d/redis_6379
Installing service...
Successfully added to chkconfig!
Successfully added to runlevels 345!
Starting Redis server...
Installation successful!
View port
netstat -antupl|grep 6379
server1:
rpm -ivh logstash-2.3.3-1.noarch.rpm
vim /etc/logstash/conf.d/nginx.conf
input {
        file {
                path => "/var/log/nginx/access.log"
                start_position => "beginning"
        }
}

filter {
        grok {
                match => { "message" => "%{COMBINEDAPACHELOG} %{QS:x_forwarded_for}" }
        }
}
output {
        redis {
                host => ["172.25.11.2"]
                port => 6379
                data_type => "list"
                key => "logstash:redis"
        }
}
/etc/init.d/nginx start chmod +x /var/log/nginx/access.log ා when the file is executed in the background, it is executed as logstash, so it must have read permission Remove all. Conf files under / etc/logstash/conf.d / except nginx.conf, otherwise the running results will be affected
server2
rpm -ivh logstash-2.3.3-1.noarch.rpm
vim /etc/logstash/conf.d/es.conf
input {
        redis {
                host => "172.25.11.2"
                port => 6379
                data_type => "list"
                key => "logstash:redis"
        }
}
output {
        elasticsearch {
                hosts => ["172.25.11.1"]
                index => "nginx-%{+YYYY.MM.dd}"
        }
}
Enter kibana web page in browser
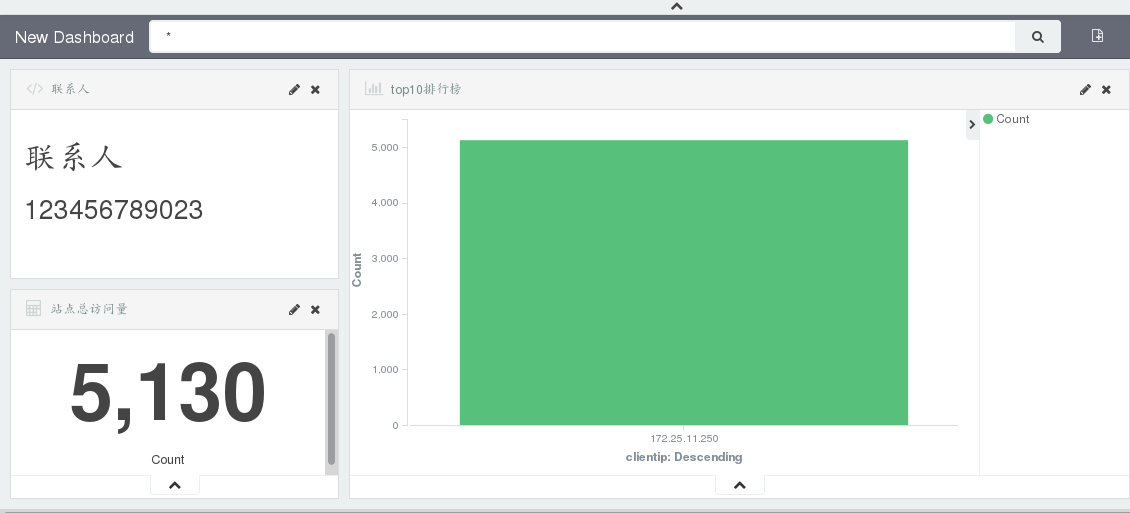
Click Visualize - > markdown widget - > Add Contact 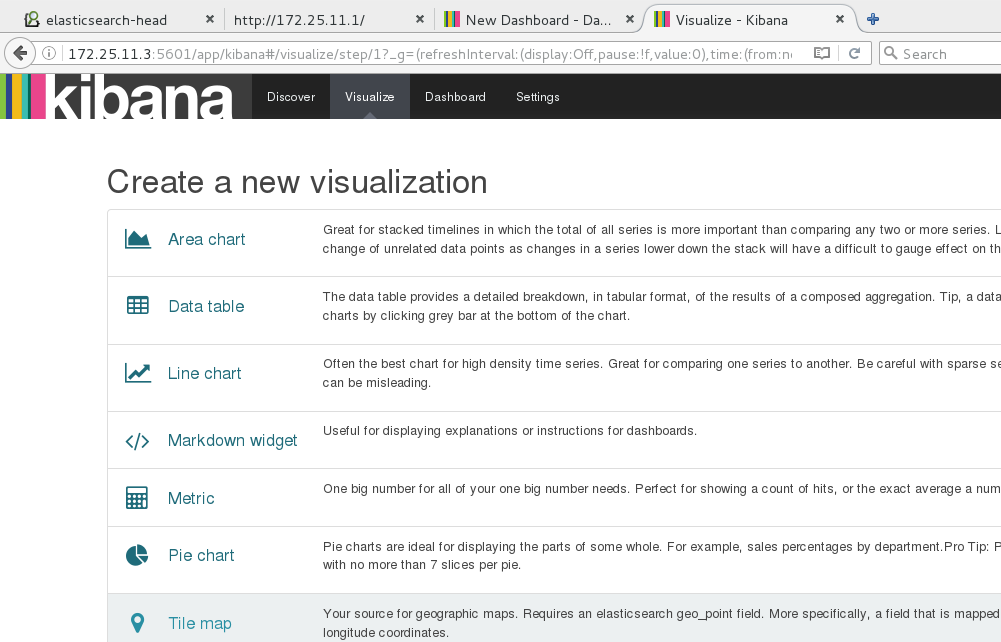
Add contact, run, save 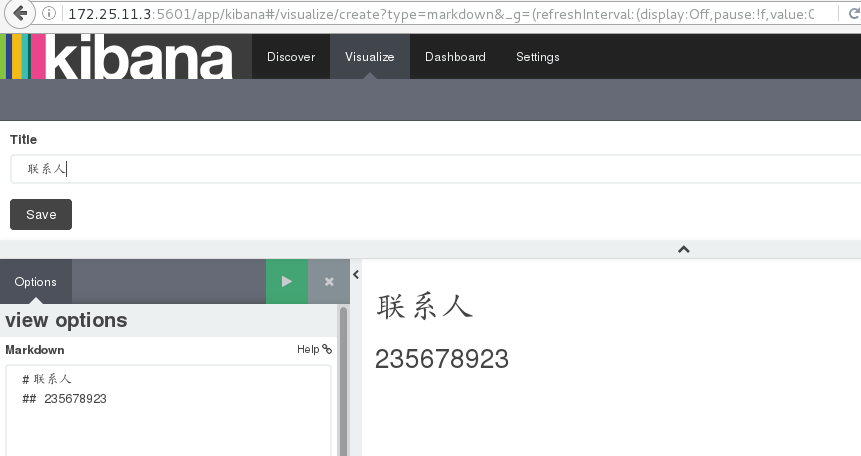
Add contacts like Dashboard
Click the + sign in the upper right corner – > select what you want to add 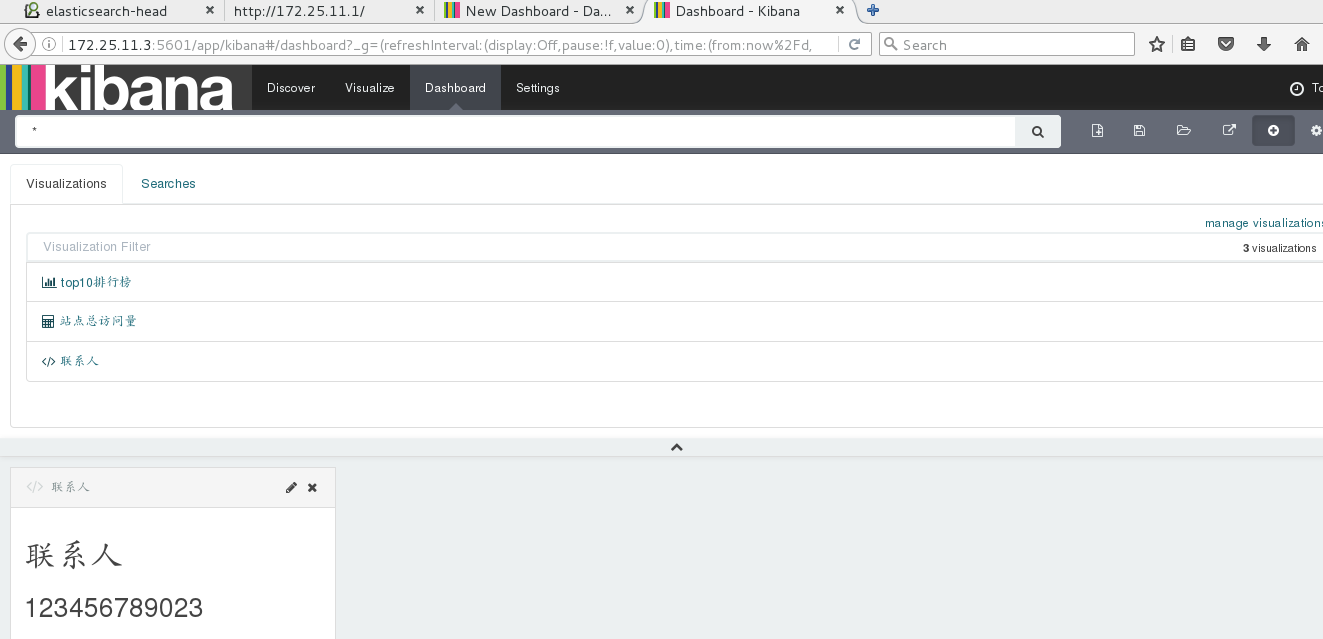
Add total visits
Click Visualize – > metric
Create a new, select nginx service 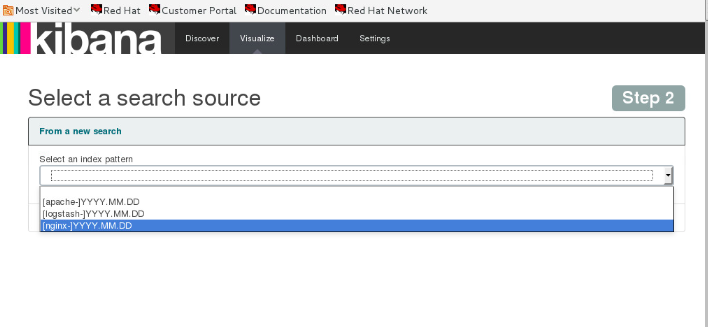
Click save, write name save 
Add top 10 leaderboards
Click Visualize – > Add Vertical bar chart
Select service nginx 
Click to add X-Axis 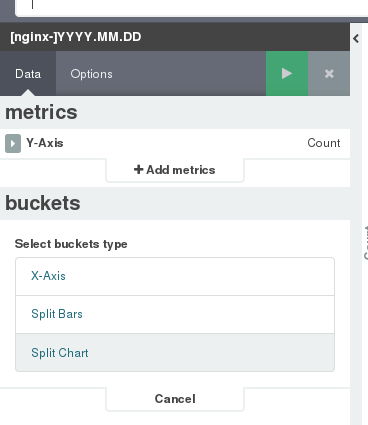
Select x-axis parameters 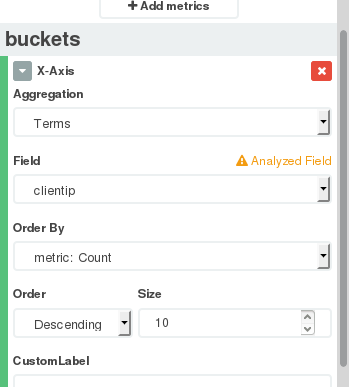
Click to run horizontal axis planning line ip 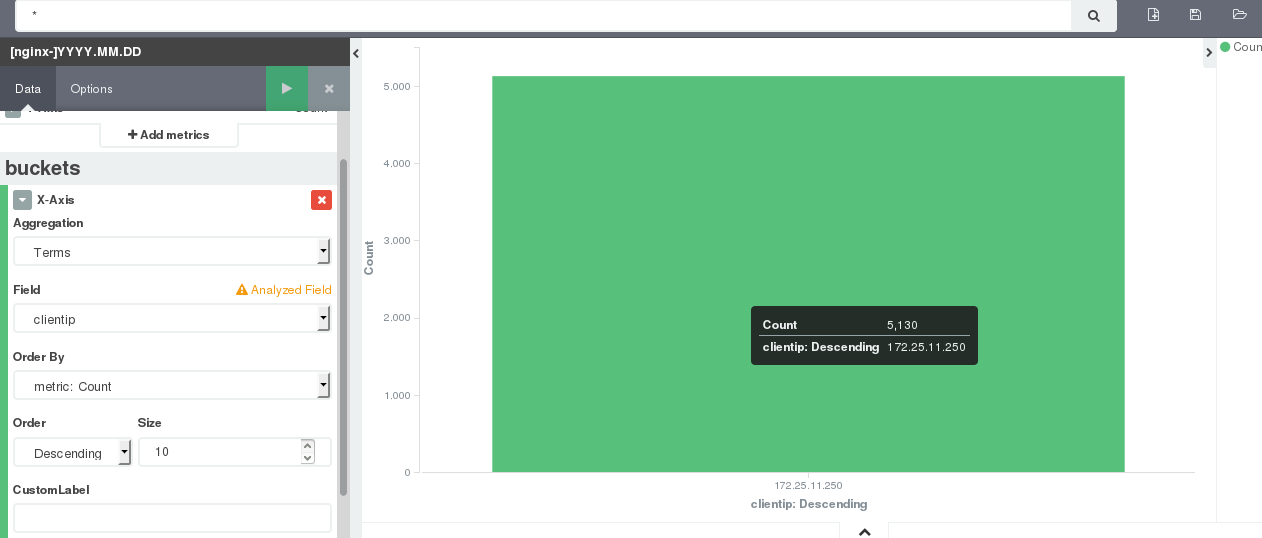
Click save 
Click Dashboard to add the newly created one (follow the same steps above) 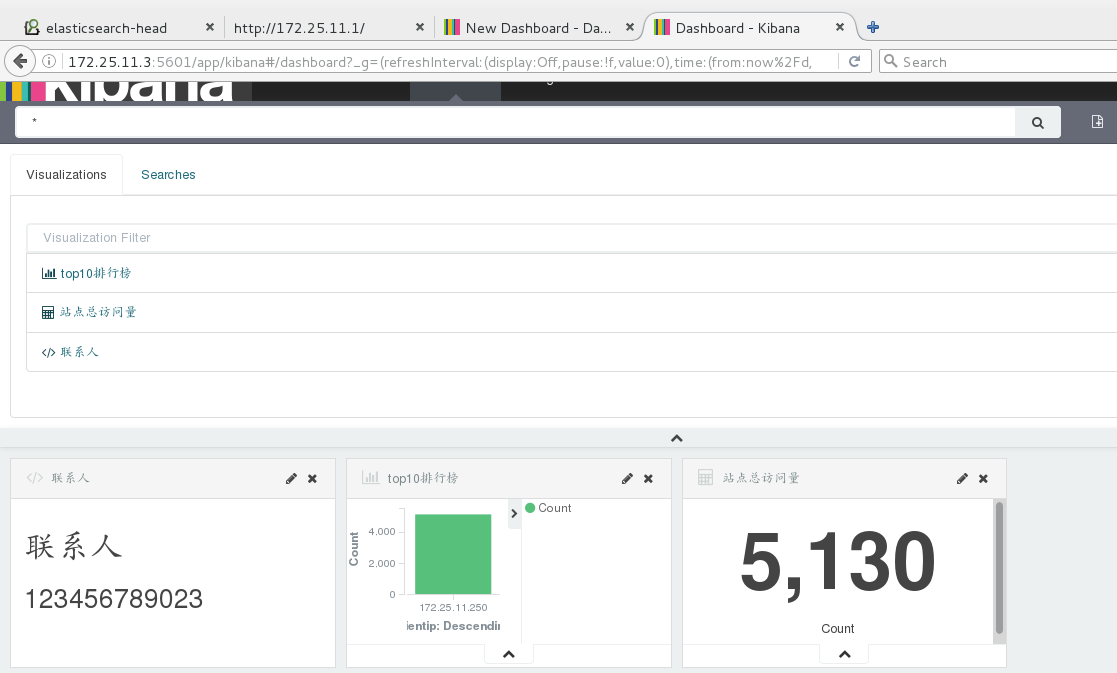
Click save
Execute / etc/init.d/logstash start on server1,2 to run the service in the background
Access this host on a host (execute the pressure test command) 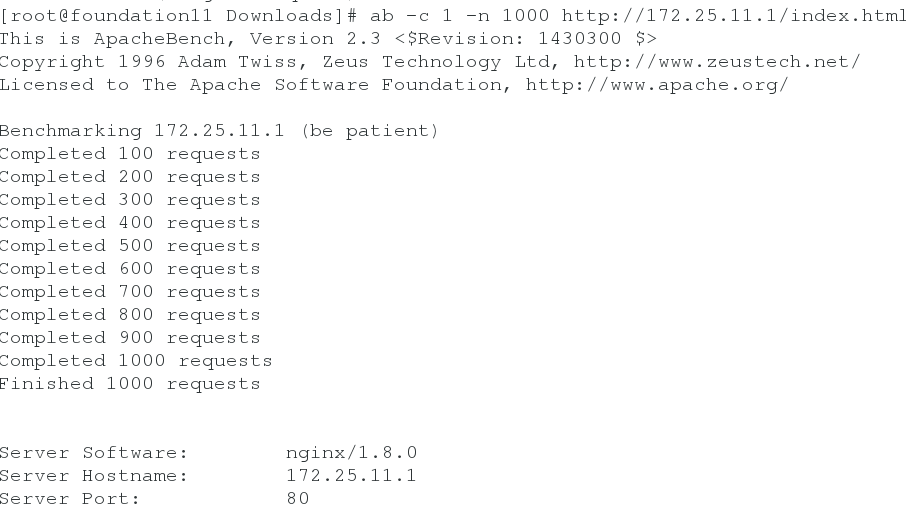
Set the refresh interval on the browser (click the top right corner – > Click 5s to refresh once in 5s) 
Real time data acquisition and display 