Background: After the completion of the new function development test, we are ready to launch. When the third machine is released, the monitoring shows that CPU of one machine suddenly soars to 300%, the number of active threads of Dubbo directly soars to 1000+, so we have to stop publishing, immediately roll back the problem machine, and return to normal after rollback. Continue to observe the other two released machines, eventually, none of them is unavoidable. It's all rollback.
The following is my troubleshooting process:
Monitoring Log Analysis
Firstly, we look at the application log of the fault time point and find that a lot of methods take a long time, especially the filter Mission method, which takes up to 30S+. In other words, filter Mission is a high QPS interface in the current service (an average of 200 million calls per day), so the possibility of failure is also high. So we review the implementation of filter Mission again. There is no complex computing logic, no processing logic for a large number of data, and no contention for locks. This requirement does not involve the modification of filter Mission, eliminating the failure caused by filter Mission.
It can also be found from the logs that a large number of requests have timed out, which can only indicate that the system is overloaded, and can not locate the crux of the problem.
Code Review
You can't find the reason from the application log. You can only do code review again. First, check whether there is synchronous code logic in the system, mainly to eliminate the possibility of deadlock; check the code with complex operation logic; at the same time, compare the modified code with the previous version, and find no problem.
Thread Dump Analysis
So far, we can't analyze the problem from the log for the time being, and we can't locate the problem blindly. Now we can only re-publish a machine to let Operations and Maintenance dump the thread stack of the application and analyze the jstack file. Before starting to analyze dump files, consolidate the foundation.
Thread state
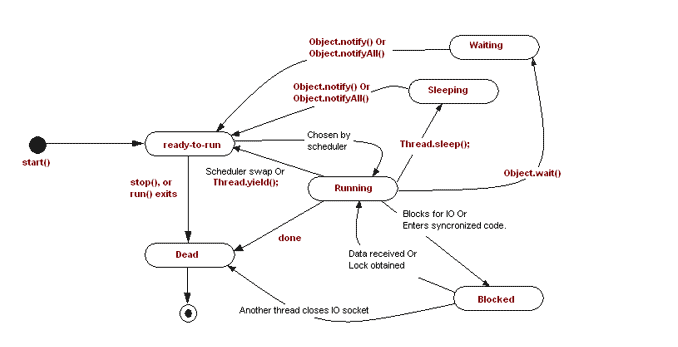
The states in the figure are described as follows:
New: New state, the state that exists when a thread object is created;
Runnable: ready-to-run, runnable state. When thread.start() is called, the thread becomes Runnable state and needs to get CPU to run.
Running: Running: CPU reschedules when Thread.yield() is called or the time slice is executed; note: Thread.yield() is called, and the thread releases the CPU, but CPU rescheduling may allow the thread to regain the time slice.
Waiting: Calling thread.join(), object.wait() and LockSupport.park() threads all enter this state, indicating that threads are waiting for a resource or condition to wake themselves up; thread.join(), object.wait() needs notify ()/ notify all () of Object to wake up; LockSupport.park() needs LockSupport.unpark() to wake up. These methods enable threads to enter the running state and participate. CPU scheduling.
thread.join(): the main thread will continue to execute downward only after thread execution is completed; from join() implementation, only thread.isAlive() returns true, object.wait() will be invoked into the waiting state, that is, thread.start() is not invoked, or thread has ended, object.wait() will not be invoked; if it is in the waiting state, object.wait() will not be invoked. When awakened, thread.isAlive() is judged again. If true, object.wait() is called to wait until the thread terminates and thread.isAlive() returns false.
object.wait(): The function is to make the thread enter the waiting state. Only when the thread holds the lock on the object, can it call the wait() of the object. When the thread enters the waiting state, it releases the lock on the object it holds, but it still holds the lock on other objects. If other threads want to call notify(), notifyAll() to wake up the thread, they also need to hold the lock of the object.
LockSupport.park(): Suspend the current thread and do not participate in thread scheduling unless LockSupport.unpark() is called to re-participate in scheduling.
Timed_Waiting: Thread.sleep(long), LockSupport.parkNanos(long), thread.join(long) or obj.wait(long) are all called into this state. The difference with Waiting is that the waiting time of Timed_Waiting is limited.
Thread.sleep(): Let the current thread stop running for a specified number of milliseconds, and the thread will not release resources such as locks it holds.
Blocked: A thread is waiting for a lock to be acquired. When a thread enters a synchronized protected code block or method, it enters that state if it does not acquire a lock; or when a thread is waiting for I/O, it enters that state. Note that Lock objects in java do not bring threads into this state.
Dead: After a thread has executed or thrown an uncovered exception, it enters the dead state, indicating the end of the thread.
Some of the states in the figure above are just for illustration, but they do not exist in practice, such as running/sleeping. There are several clearly defined thread state values in java as follows:
NEW,RUNNABLE,BLOCKED,WAITING,TIMED_WAITING,TERMINATED
Analyzing jstack logs
A large number of dubbo threads are in WAITING state. Look at the log:
"DubboServerHandler-172.24.16.78:33180-thread-1220" #1700 daemon prio=5 os_prio=0 tid=0x00007f3394988800 nid=0x4aae waiting on condition [0x00007f32d75c0000]
   java.lang.Thread.State: WAITING (parking)
	at sun.misc.Unsafe.park(Native Method)
	- parking to wait for  <0x00000000866090c0> (a java.util.concurrent.locks.AbstractQueuedSynchronizer$ConditionObject)
	at java.util.concurrent.locks.LockSupport.park(LockSupport.java:175)
	at java.util.concurrent.locks.AbstractQueuedSynchronizer$ConditionObject.await(AbstractQueuedSynchronizer.java:2039)
	at java.util.concurrent.ScheduledThreadPoolExecutor$DelayedWorkQueue.take(ScheduledThreadPoolExecutor.java:1081)
	at java.util.concurrent.ScheduledThreadPoolExecutor$DelayedWorkQueue.take(ScheduledThreadPoolExecutor.java:809)
	at java.util.concurrent.ThreadPoolExecutor.getTask(ThreadPoolExecutor.java:1067)
	at java.util.concurrent.ThreadPoolExecutor.runWorker(ThreadPoolExecutor.java:1127)
	at java.util.concurrent.ThreadPoolExecutor$Worker.run(ThreadPoolExecutor.java:617)
	at java.lang.Thread.run(Thread.java:745)
As can be seen from the log, the thread "Dubbo Server Handler-172.24.16.78:33180-thread-1220" is in WAITING state, mainly because it takes tasks from the thread pool queue to execute, but the thread pool is empty, and finally it calls LockSupport.park to make the thread enter and wait, waiting for notification that the queue is not empty.
Imagine when a new thread will be created to process requests? According to the implementation of jdk thread pool, when a new request arrives, if the number of threads in the pool does not reach corePoolSize, new threads are created directly to process the request.
According to jstack log, 195 dubbo threads retrieve tasks from Scheduled ThreadPool Executor, resulting in WAITING status. These dubbo threads should not handle scheduling tasks. Why do they retrieve tasks from task threads? I don't know the answer to this question for the time being. I hope God will help me to answer it.
There are also some threads in WAITING status. Look at the log:
"DubboServerHandler-172.24.16.78:33180-thread-1489" #1636 daemon prio=5 os_prio=0 tid=0x00007f33b0122800 nid=0x48ec waiting on condition [0x00007f32db600000]
   java.lang.Thread.State: WAITING (parking)
	at sun.misc.Unsafe.park(Native Method)
	- parking to wait for  <0x0000000089d717a8> (a java.util.concurrent.SynchronousQueue$TransferStack)
	at java.util.concurrent.locks.LockSupport.park(LockSupport.java:175)
	at java.util.concurrent.SynchronousQueue$TransferStack.awaitFulfill(SynchronousQueue.java:458)
	at java.util.concurrent.SynchronousQueue$TransferStack.transfer(SynchronousQueue.java:362)
	at java.util.concurrent.SynchronousQueue.take(SynchronousQueue.java:924)
	at java.util.concurrent.ThreadPoolExecutor.getTask(ThreadPoolExecutor.java:1067)
	at java.util.concurrent.ThreadPoolExecutor.runWorker(ThreadPoolExecutor.java:1127)
	at java.util.concurrent.ThreadPoolExecutor$Worker.run(ThreadPoolExecutor.java:617)
	at java.lang.Thread.run(Thread.java:745)
This part of the thread is mainly because the task from ThreadPoolExecutor is suspended (309 threads) when it is executed. This part of the thread mainly returns to the thread pool to wait for the task to execute after processing the request normally. Because the new Fixed ThreadPool is used here as the dubbo request processing pool, each new request will be processed by default by creating a new thread unless the pool limit is reached. Only when the maximum number of threads in the thread pool is reached, which threads blocked in getTask() will be reused.
In addition, there are a large number of dubbo threads in BLOCKED state, see the log:
"DubboServerHandler-172.24.16.78:33180-thread-236" #1727 daemon prio=5 os_prio=0 tid=0x00007f336403b000 nid=0x4b8b waiting for monitor entry [0x00007f32d58a4000]
   java.lang.Thread.State: BLOCKED (on object monitor)
	at org.apache.logging.log4j.core.appender.rolling.RollingFileManager.checkRollover(RollingFileManager.java:149)
	- waiting to lock <0x0000000085057998> (a org.apache.logging.log4j.core.appender.rolling.RollingRandomAccessFileManager)
	at org.apache.logging.log4j.core.appender.RollingRandomAccessFileAppender.append(RollingRandomAccessFileAppender.java:88)
	at org.apache.logging.log4j.core.config.AppenderControl.tryCallAppender(AppenderControl.java:155)
	at org.apache.logging.log4j.core.config.AppenderControl.callAppender0(AppenderControl.java:128)
	at org.apache.logging.log4j.core.config.AppenderControl.callAppenderPreventRecursion(AppenderControl.java:119)
	at org.apache.logging.log4j.core.config.AppenderControl.callAppender(AppenderControl.java:84)
	at org.apache.logging.log4j.core.config.LoggerConfig.callAppenders(LoggerConfig.java:390)
	at org.apache.logging.log4j.core.config.LoggerConfig.processLogEvent(LoggerConfig.java:375)
	at org.apache.logging.log4j.core.config.LoggerConfig.log(LoggerConfig.java:359)
	at org.apache.logging.log4j.core.config.LoggerConfig.log(LoggerConfig.java:349)
	at org.apache.logging.log4j.core.config.AwaitCompletionReliabilityStrategy.log(AwaitCompletionReliabilityStrategy.java:63)
	at org.apache.logging.log4j.core.Logger.logMessage(Logger.java:146)
	at org.apache.logging.log4j.spi.AbstractLogger.logMessage(AbstractLogger.java:1993)
	at org.apache.logging.log4j.spi.AbstractLogger.logIfEnabled(AbstractLogger.java:1852)
	at org.apache.logging.slf4j.Log4jLogger.info(Log4jLogger.java:179)
	at com.alibaba.dubbo.common.logger.slf4j.Slf4jLogger.info(Slf4jLogger.java:42)
	at com.alibaba.dubbo.common.logger.support.FailsafeLogger.info(FailsafeLogger.java:93)
	at com.dianwoba.universe.dubbo.filter.ResponseFilter$1.run(ResponseFilter.java:116)
	at java.util.concurrent.Executors$RunnableAdapter.call(Executors.java:511)
	at java.util.concurrent.FutureTask.run(FutureTask.java:266)
	at java.util.concurrent.ScheduledThreadPoolExecutor$ScheduledFutureTask.access$201(ScheduledThreadPoolExecutor.java:180)
	at java.util.concurrent.ScheduledThreadPoolExecutor$ScheduledFutureTask.run(ScheduledThreadPoolExecutor.java:293)
	at java.util.concurrent.ThreadPoolExecutor.runWorker(ThreadPoolExecutor.java:1142)
	at java.util.concurrent.ThreadPoolExecutor$Worker.run(ThreadPoolExecutor.java:617)
	at java.lang.Thread.run(Thread.java:745)
Wait for monitor entry: This indicates that the current thread is in the EntryList queue, waiting for the monitor lock to be acquired.
Description: Synchronized synchronization semantics in Java is mainly based on Java object header and monitor. Each monitor can only be owned by one thread at the same time. Others can only wait to acquire the monitor. The monitor has two queues: WaitSet and Entry List. When a thread calls Object.wait() when it has a monitor, it releases monitor, enters WaitSet and waits for other threads to call notify()/notifyAll() of Object to wake up. At this point, monitor will be re-competed. At this time, the thread state is WAITING, and the waiting state of WaitSet is "in Object.wait()"; when a thread tries to enter synchronized code block or method. When acquisition monitor fails, it enters the EntryList queue, where the thread state is BLOCKED and the waiting state in EntryList is "wait for monitor entry".
According to the jstack log, 377 dubbo threads are waiting to lock the resource "0x0000000085057998". From the stack, these threads are competing for the monitor of Rolling Random Access File Manager. Let's see which thread owns the monitor. Look at the log:
"DubboServerHandler-172.24.16.78:33180-thread-429" #553 daemon prio=5 os_prio=0 tid=0x00007f339c09f800 nid=0x4467 waiting for monitor entry [0x00007f331f53a000]
   java.lang.Thread.State: BLOCKED (on object monitor)
	at org.apache.logging.log4j.core.appender.rolling.RollingFileManager.checkRollover(RollingFileManager.java:149)
	- locked <0x0000000085057998> (a org.apache.logging.log4j.core.appender.rolling.RollingRandomAccessFileManager)
	at org.apache.logging.log4j.core.appender.RollingRandomAccessFileAppender.append(RollingRandomAccessFileAppender.java:88)
	at org.apache.logging.log4j.core.config.AppenderControl.tryCallAppender(AppenderControl.java:155)
	at org.apache.logging.log4j.core.config.AppenderControl.callAppender0(AppenderControl.java:128)
	at org.apache.logging.log4j.core.config.AppenderControl.callAppenderPreventRecursion(AppenderControl.java:119)
	at org.apache.logging.log4j.core.config.AppenderControl.callAppender(AppenderControl.java:84)
	at org.apache.logging.log4j.core.config.LoggerConfig.callAppenders(LoggerConfig.java:390)
	at org.apache.logging.log4j.core.config.LoggerConfig.processLogEvent(LoggerConfig.java:375)
	at org.apache.logging.log4j.core.config.LoggerConfig.log(LoggerConfig.java:359)
	at org.apache.logging.log4j.core.config.LoggerConfig.logParent(LoggerConfig.java:381)
	at org.apache.logging.log4j.core.config.LoggerConfig.processLogEvent(LoggerConfig.java:376)
	at org.apache.logging.log4j.core.config.LoggerConfig.log(LoggerConfig.java:359)
	at org.apache.logging.log4j.core.config.LoggerConfig.log(LoggerConfig.java:349)
	at org.apache.logging.log4j.core.config.AwaitCompletionReliabilityStrategy.log(AwaitCompletionReliabilityStrategy.java:63)
	at org.apache.logging.log4j.core.Logger.logMessage(Logger.java:146)
	at org.apache.logging.log4j.spi.AbstractLogger.logMessage(AbstractLogger.java:1993)
	at org.apache.logging.log4j.spi.AbstractLogger.logIfEnabled(AbstractLogger.java:1852)
	at org.apache.logging.slf4j.Log4jLogger.warn(Log4jLogger.java:239)
	at com.alibaba.dubbo.common.logger.slf4j.Slf4jLogger.warn(Slf4jLogger.java:54)
	at com.alibaba.dubbo.common.logger.support.FailsafeLogger.warn(FailsafeLogger.java:107)
	at com.alibaba.dubbo.rpc.filter.TimeoutFilter.invoke(TimeoutFilter.java:48)
	at com.alibaba.dubbo.rpc.protocol.ProtocolFilterWrapper$1.invoke(ProtocolFilterWrapper.java:91)
	at com.alibaba.dubbo.rpc.protocol.dubbo.filter.TraceFilter.invoke(TraceFilter.java:78)
	at com.alibaba.dubbo.rpc.protocol.ProtocolFilterWrapper$1.invoke(ProtocolFilterWrapper.java:91)
	at com.alibaba.dubbo.rpc.filter.ContextFilter.invoke(ContextFilter.java:60)
	at com.alibaba.dubbo.rpc.protocol.ProtocolFilterWrapper$1.invoke(ProtocolFilterWrapper.java:91)
	at com.alibaba.dubbo.rpc.filter.GenericFilter.invoke(GenericFilter.java:112)
	at com.alibaba.dubbo.rpc.protocol.ProtocolFilterWrapper$1.invoke(ProtocolFilterWrapper.java:91)
	at com.alibaba.dubbo.rpc.filter.ClassLoaderFilter.invoke(ClassLoaderFilter.java:38)
	at com.alibaba.dubbo.rpc.protocol.ProtocolFilterWrapper$1.invoke(ProtocolFilterWrapper.java:91)
	at com.alibaba.dubbo.rpc.filter.EchoFilter.invoke(EchoFilter.java:38)
	at com.alibaba.dubbo.rpc.protocol.ProtocolFilterWrapper$1.invoke(ProtocolFilterWrapper.java:91)
	at com.alibaba.dubbo.rpc.protocol.dubbo.DubboProtocol$1.reply(DubboProtocol.java:108)
	at com.alibaba.dubbo.remoting.exchange.support.header.HeaderExchangeHandler.handleRequest(HeaderExchangeHandler.java:84)
	at com.alibaba.dubbo.remoting.exchange.support.header.HeaderExchangeHandler.received(HeaderExchangeHandler.java:170)
	at com.alibaba.dubbo.remoting.transport.DecodeHandler.received(DecodeHandler.java:52)
	at com.alibaba.dubbo.remoting.transport.dispatcher.ChannelEventRunnable.run(ChannelEventRunnable.java:82)
	at java.util.concurrent.ThreadPoolExecutor.runWorker(ThreadPoolExecutor.java:1142)
	at java.util.concurrent.ThreadPoolExecutor$Worker.run(ThreadPoolExecutor.java:617)
	at java.lang.Thread.run(Thread.java:745)
Looking at the stack of this thread, I am confused. It has locked the resource "0x0000000085057998", b ut it is still in the BLOCKED state. Is it deadlocked? But this is not a deadlock, the most likely reason is:
- Threads do not get the resources they need to run.
- JVM is in full GC
From this part of the log, we can see that most of the threads are blocked in the process of printing monitoring logs, so many requests are timed out. The main reason is the high CPU occupancy and the slow processing of threads holding locks. As a result, more and more threads are blocked in lock competition and their overall performance is degraded.
So far, we have not found the cause of the problem. Once again, we observe the situation of resource occupancy. We find that when there is a problem, the memory occupancy continues to grow, and there is no trace of decline. Then we find a GC log of Operations and Maintenance dump. We find that JVM has been doing full GC all the time, and the memory has not changed after each GC, indicating that there is a memory leak in the program. Finally, a paging query interface is located where memory leak occurs. Limit and offset are omitted from the SQL statement.
This Nima checks out the data of the whole table at one time (3 million), and processes 3 million records in a cycle. It's strange that the memory doesn't explode. It is for this reason that memory has not been released for a long time. JVM can not recover memory by executing fullGC, resulting in continuous fullGC, CPU exhausted and application requests can not be processed.
In summary, the main culprit was a memory leak, which led to a sudden surge in CPU, an increase in Dubbo active threads and a timeout in request processing. According to the above analysis, it also exposes another unreasonable problem: the number of Dubbo thread pools is too large, the maximum value is 1500, that is to say, there will be 1500 threads in the final thread pool to handle user requests. When the concurrency is high, the number of active threads increases, the CPU switches frequently, and the throughput of the system will not be too high.
This paper records the process, on the one hand, in order to record the pits that have been trampled, and at the same time to improve their fault analysis and processing capabilities. When you need a problem, don't worry. Learn to analyze the problem and find the problem. Especially in the case of online problems, due to the inability to debug, we must monitor the application. When problems arise, we must analyze them in combination with logs. Problems in business should be combined with business logs, performance problems should be combined with memory dump logs and thread dump logs, etc.
Welcome to point out the errors in this article. Please indicate the source of the original text for reprinting. https://my.oschina.net/7001/blog