preface
When I am running a deep learning or neural network model training, we often need to run many epoch s. Of course, we are most concerned about the accuracy of the model and other parameters in the training, but before that, we need to go through a parameter adjustment process. The parameter adjustment process is often determined according to the size of the loss value at what time. Therefore, when we run the code, we can intuitively observe the change of loss value in real time, so we can adjust the parameters more efficiently.
In order to make the training program run stably and observe the change of loss value at any time and anywhere remotely, redis is introduced to store the current loss value. Redis is lighter than other databases, faster reading speed (of course, it is not reflected in this) and has good scalability
If you don't understand Redis, you can read this previously written Brief introduction to Redis and examples of Python operation
This paper will introduce the real-time display method under the two development environments of pychart and Jupyter Notebook.
1, How is Redis designed?
No design, just install it and open the server. In Linux, you can directly enter a command to directly open the connection to the Redis server. Since this is only a brief introduction, the user password and other designs are not designed.
./redis-server
redis-cli
You may wonder how to establish a redis connection in python? It's simple Brief introduction to Redis and examples of Python operation
Here, the most commonly used List structure is used to store the loss value. It should be noted that Redis Lists is a LIFO mechanism. This is also the reason why you should reverse it in the following code comments. How to save the loss value in Redis during training?
It will not be shown in detail here in a training code. Understand the following code and slightly change the saved loss value. The process is very simple, just one code.
r1.lpush(redis_range_name, loss_val)
# encoding:utf8
# Password free redis displays the trend of loss value in real time
import redis
ip = '127.0.0.1'
redis_range_name = 'loss_val'  # Keep consistent with the key stored in redis, that is, the name of my list. Don't make a mistake

r1 = redis.Redis(host=ip, port=6379, db=0, decode_responses=True)  # Establish connection
for i in range(10):
    r1.lpush(redis_range_name, i)  # Save data to redis
2, Reading and displaying data in redis
1. Read the Loss value function of Redis List
See the notes for details
# Define the function to obtain the loss value of the current redis.
# redis_range_name, which represents the key of the loss value currently stored in the redis list. It can be customized and modified, and the two sides can correspond.
def now_loss(redis_range_name='loss_val'):
    ip = '127.0.0.1'  # Remote host or local ip
    r1 = redis.Redis(host=ip, port=6379, db=0, decode_responses=True)  # Redis is remotely connected to the host. This is the password free version. The password version needs to update the redis.conf configuration
    now_loss_list = r1.lrange(redis_range_name, 0, -1)[::-1]  # [:: - 1] used for inversion. Here it is said that the List of redis is a LIFO mechanism
    now_loss_list = [eval(i) for i in now_loss_list]  # The stored character form needs to be changed by eval, which is better than using int float double directly
    return now_loss_list
2. Dynamically display Loss value in pychar environment
- Pycharm without remote server can close Tools – Python Scientific – Show plots in tool window in Setting. This can be like the community version of pycharm. When drawing with Matplotlib, a pop-up window appears, and the dynamically refreshed picture is more stable.
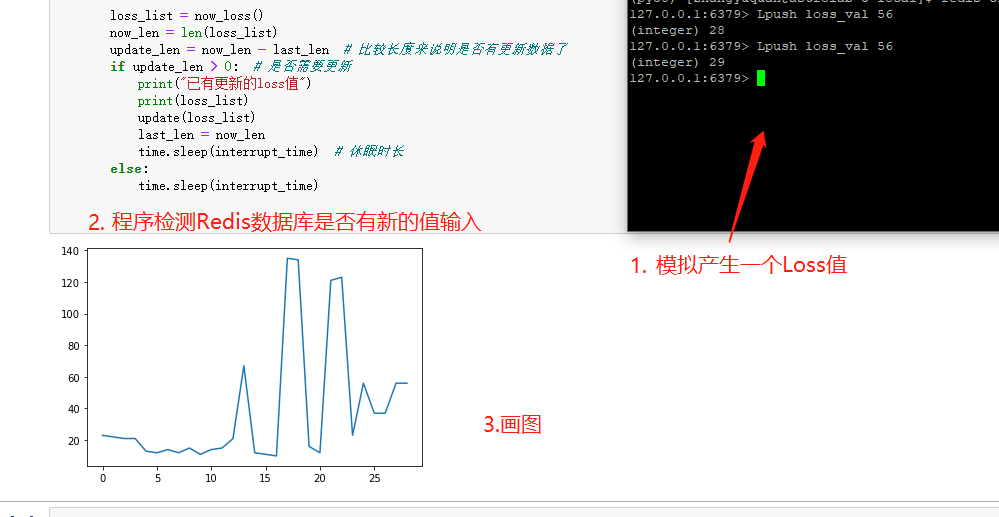
2. If you are calling the Linux server, if you close the above Show plots in tool window, you may report an error. It's OK. We can observe it in SciView of pycharm. Part of the content is in the code comments
Use here
# encoding:utf8
# Password free redis displays the trend of loss value in real time
# author: Braised sweet potato with half a catty
import time
import redis
import matplotlib.pyplot as plt
import random


# Returns the current redis function value
# That is, start in ltrim key start end should be larger than end, and the values are positive. Clear the current list. The build statement is used to clear here
def update(update_content: list):
    ax = []
    ay = []
    plt.ion()  # Open a drawing window
    for v, i in enumerate(update_content):  # Traverse the values of 0-99
        ax.append(v)  # Add i to the x-axis data
        ay.append(i)  # Add the square of i to the data on the y-axis
        plt.clf()  # Clear previous drawing
        plt.plot(ax, ay)  # Draw a graph of the values in the current ax list and ay list
        plt.pause(0.01)  # Pause for one second
        plt.ioff()  # Close the drawing window


# Define the function to obtain the loss value of the current redis.
# redis_range_name, which represents the key of the loss value currently stored in the redis list. It can be customized and modified, and the two sides can correspond.
def now_loss(redis_range_name='loss_val'):
    ip = '127.0.0.1'  # Remote host or local ip
    r1 = redis.Redis(host=ip, port=6379, db=0, decode_responses=True)  # Redis is remotely connected to the host. This is the password free version. The password version needs to update the redis.conf configuration
    now_loss_list = r1.lrange(redis_range_name, 0, -1)[::-1]  # [:: - 1] used for inversion. Here it is said that the List of redis is a LIFO mechanism
    now_loss_list = [eval(i) for i in now_loss_list]  # The stored character form needs to be changed by eval, which is better than using int float double directly
    return now_loss_list


if __name__ == '__main__':
    # update(now_loss())
    last_len = 0
    interrupt_time = 5  # The time interval for detecting updates can be flexibly adjusted according to the running status of the server and the running status of the code
    while True:  # Check whether redis updates the value all the time

        loss_list = now_loss()
        now_len = len(loss_list)
        update_len = now_len - last_len  # Compare the length to indicate whether there is updated data
        if update_len > 0:  # Update required
            print("Updated loss value")
            print(loss_list)
            update(loss_list)
            last_len = now_len
            time.sleep(interrupt_time)  # Sleep duration
        else:
            time.sleep(interrupt_time)
See if it's the effect you want?
127.0.0.1:6379> lpush loss_val 37
(integer) 27
127.0.0.1:6379>
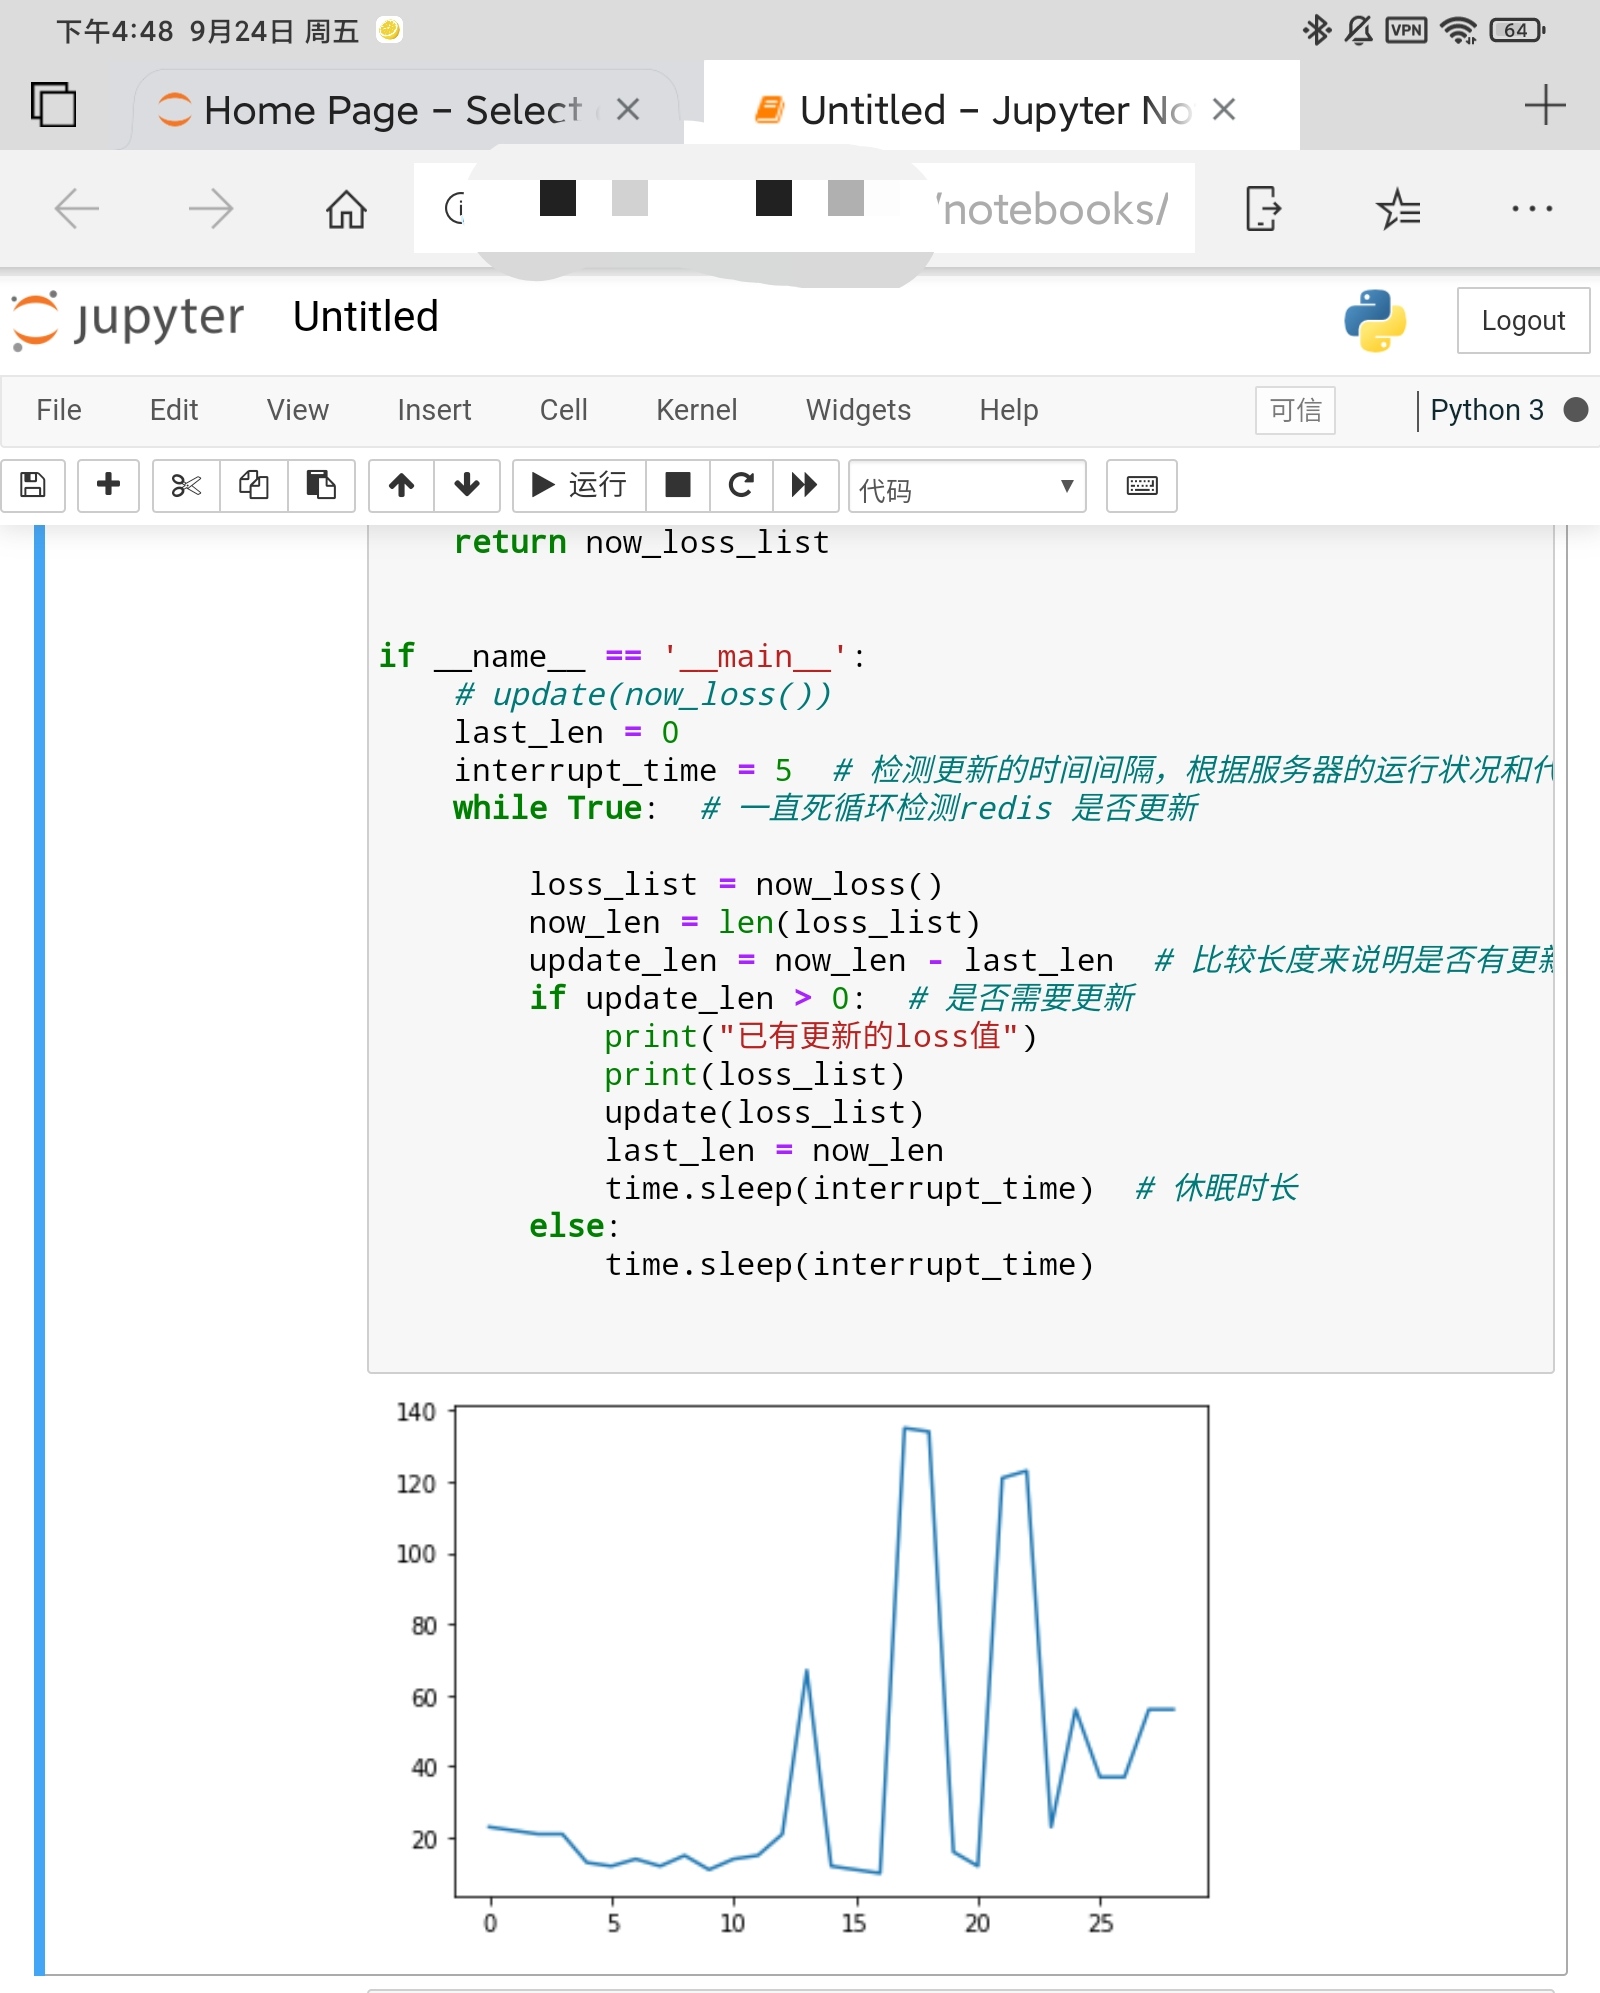
3. Dynamically display the Loss value in the Jupiter notebook environment
The principle is the same, that is, the effect of Jupyter Notebook environment is a little different. As long as you open a remote connection, you can see how your code is running on any device that can surf the Internet anytime and anywhere. It feels very practical.
- On PC
- On tablets and mobile phones:
The code is a little different. I think it works better on Jupyter Notebook.
# Password free redis displays the trend of loss value in real time
# author: Braised sweet potato with half a catty
import time
import redis
import matplotlib.pyplot as plt
%matplotlib inline
from IPython import display


# Returns the current redis function value
# That is, start in ltrim key start end should be larger than end, and the values are positive. Clear the current list. The build statement is used to clear here
def update(update_content: list):
    ax = []
    ay = []
    plt.ion()  # Open a drawing window
    for v, i in enumerate(update_content):  # Traverse the values of 0-99
        ax.append(v)  # Add i to the x-axis data
        ay.append(i)  # Add the square of i to the data on the y-axis
        display.clear_output(wait=True)  # In this way, the dynamic graph of only one window can be displayed
        plt.plot(ax, ay)  # Draw a graph of the values in the current ax list and ay list
        plt.pause(0.01)  # Pause for one second
        plt.ioff()  # Close the drawing window


# Define the function to obtain the loss value of the current redis.
# redis_range_name, which represents the key of the loss value currently stored in the redis list. It can be customized and modified, and the two sides can correspond.
def now_loss(redis_range_name='loss_val'):
    ip = '127.0.0.1'  # Remote host or local ip
    r1 = redis.Redis(host=ip, port=6379, db=0, decode_responses=True)  # Redis is remotely connected to the host. This is the password free version. The password version needs to update the redis.conf configuration
    now_loss_list = r1.lrange(redis_range_name, 0, -1)[::-1]  # [:: - 1] used for inversion. Here it is said that the List of redis is a LIFO mechanism
    now_loss_list = [eval(i) for i in now_loss_list]  # The stored character form needs to be changed by eval, which is better than using int float double directly
    return now_loss_list


if __name__ == '__main__':
    # update(now_loss())
    last_len = 0
    interrupt_time = 5  # The time interval for detecting updates can be flexibly adjusted according to the running status of the server and the running status of the code
    while True:  # Check whether redis is updated in an endless loop

        loss_list = now_loss()
        now_len = len(loss_list)
        update_len = now_len - last_len  # Compare the length to indicate whether there is updated data
        if update_len > 0:  # Update required
            print("Updated loss value")
            print(loss_list)
            update(loss_list)
            last_len = now_len
            time.sleep(interrupt_time)  # Sleep duration
        else:
            time.sleep(interrupt_time)
summary
1. Run the code of the model. Just submit the Loss value to Redis from time to time. Separating the visual code from the running model code is also helpful for code management.
2. It's more portable to store in redis. It connects multiple devices. Different environments are very good.
3. The visualization in this example is for reference only and relatively simple, including title, epoch description, reasonable XY axis scale design and other interface problems to be developed. I also hope all developers can share the visual aesthetic design.
If it helps you, you are welcome to reward