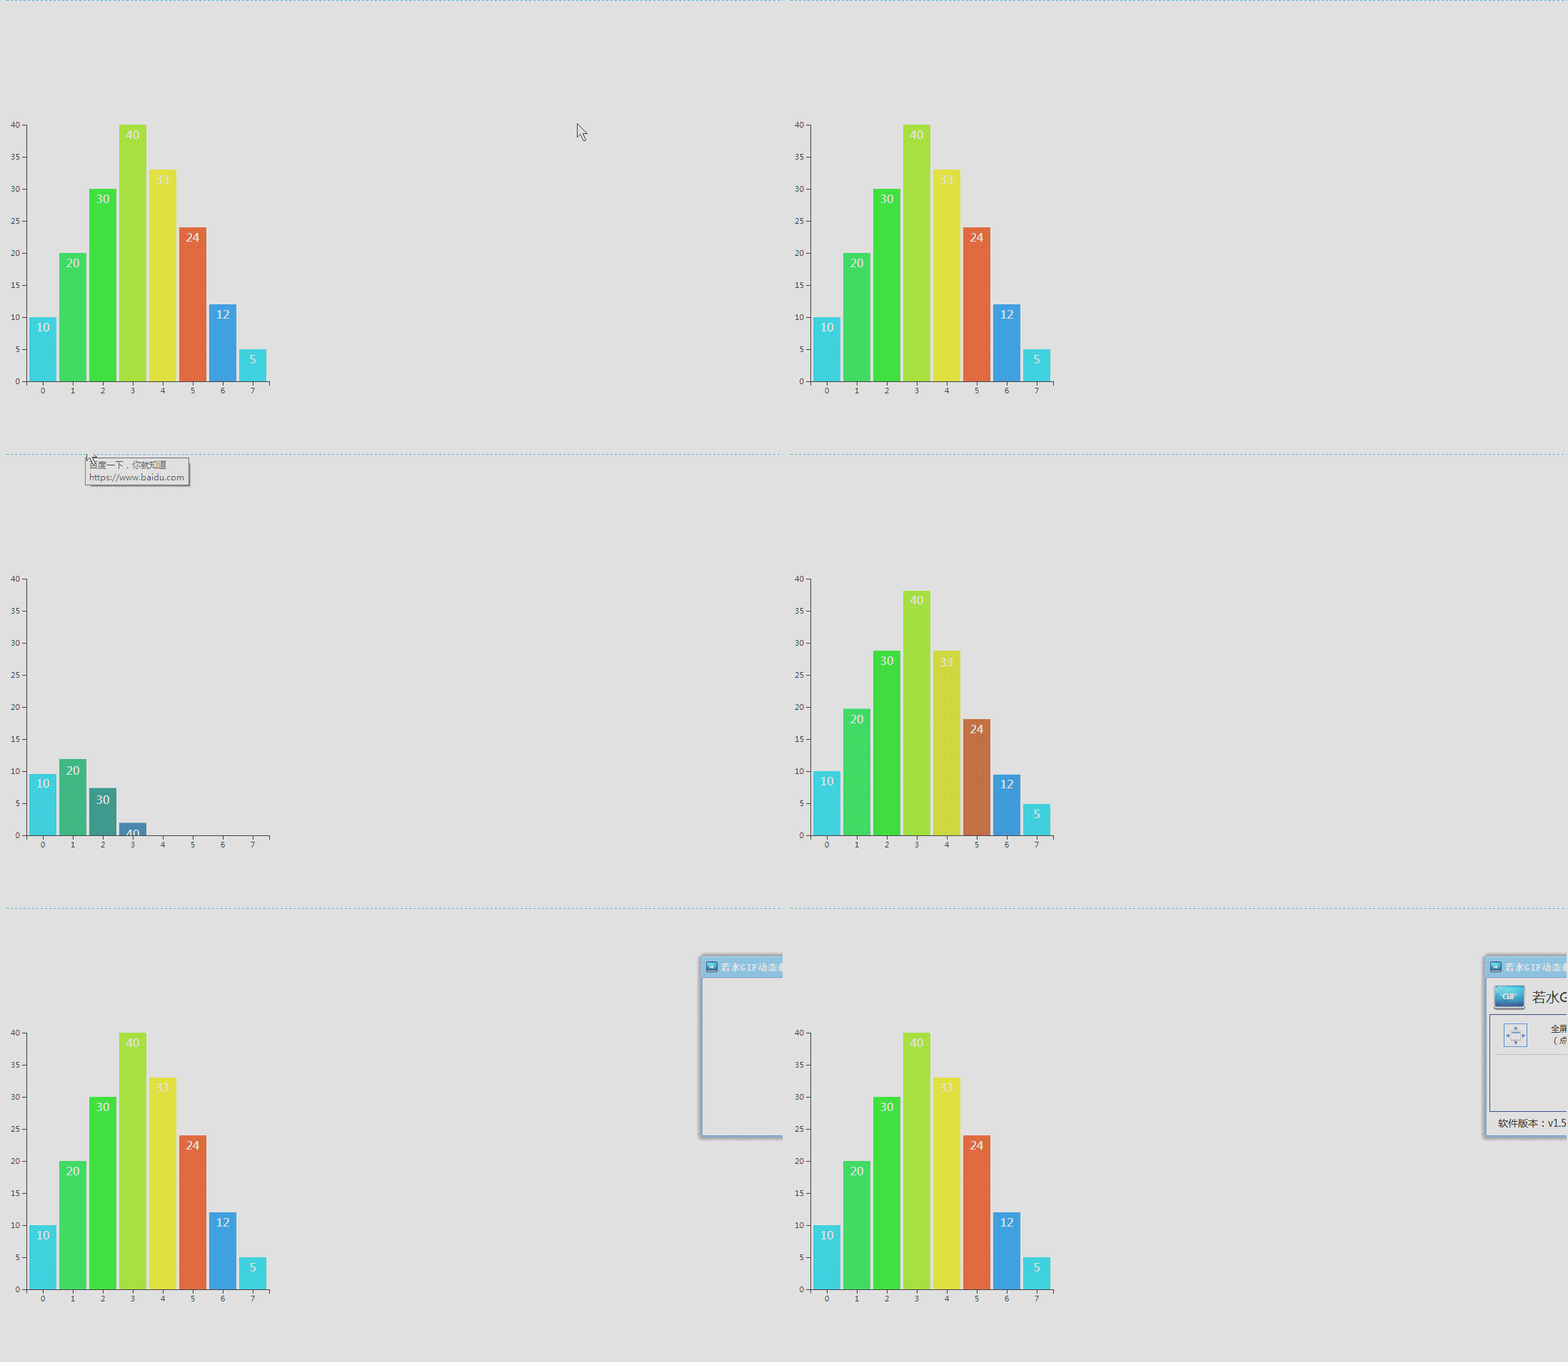
Recently, I learned D3 and wrote a small demo based on others' cases. I encountered some problems. Here's the record:
1. Some pits encountered:
(1) V3 and V4 versions in d3.js are quite different, so we must pay attention to the version;
(2) when referencing the JS library file of D3.js, you should install it through npm. Although D3.js is not famous, npm can install it. The installation command is:
npm installation: npm install d3
Front end import: import * as d3 from 'd3';
(3) analysis and import of css in react:
1: If the project is created through create react app, you can directly use the command:
import './styles.css';For import, please refer to the style import and operation of ant gold suit;
2: For non create react app projects, please refer to the article:
http://echizen.github.io/tech/2017/03-09-css-in-react
2.demo source code:
animSVG.js
import React, { Component } from 'react';
import * as SimulationData from './svgData';
import * as d3 from 'd3';
import './styles.css';
//Problems to be noted: v3 and v4 versions are quite different, which need high attention;
class AnimSVG extends React.Component {

    render() {
        {/* Define the color array of histogram; */ }
        const colors = ["#39D1DE", "#1CDB62", "#1FE015", "#A7E51F", "#E3E312", "#EA6A1F", "#29A0E3"];
        {/* canvas size  */ }
        var width = 400;
        var height = 400;

        {/* Add an SVG canvas to the body */ }
        var svg = d3.select("body")
            .append("svg")
            .attr("width", width)
            .attr("height", height);

        {/* White space around canvas */ }
        var padding = { left: 30, right: 30, top: 20, bottom: 20 };

        {/* Define an array */ }
        var dataset = [10, 20, 30, 40, 33, 24, 12, 5];

        {/* x Scale of axis */ }
        var xScale = d3.scale.ordinal()
            .domain(d3.range(dataset.length))
            .rangeRoundBands([0, width - padding.left - padding.right]);

        {/* y Scale of axis */ }
        var yScale = d3.scale.linear()
            .domain([0, d3.max(dataset)])
            .range([height - padding.top - padding.bottom, 0]);

        {/* Define x-axis */ }
        var xAxis = d3.svg.axis()
            .scale(xScale)
            .orient("bottom");

        {/* Define y axis */ }
        var yAxis = d3.svg.axis()
            .scale(yScale)
            .orient("left");

        {/* The width of the space between the rectangles; */ }
        var rectPadding = 4;

        //Add rectangle element
        var rects = svg.selectAll(".MyRect")
            .data(dataset)
            .enter()
            .append("rect")
            .attr("class", "MyRect")
            .attr("transform", "translate(" + padding.left + "," + padding.top + ")")
            .attr("x", function (d, i) {
                return xScale(i) + rectPadding / 2;
            })
            .attr("width", xScale.rangeBand() - rectPadding)
            .attr("y", function (d) {
                var min = yScale.domain()[0];
                return yScale(min);
            })
            .attr("height", function (d) {
                return 0;
            })
            .transition()
            .delay(function (d, i) {
                return i * 200;
            })
            .duration(2000)
            .ease("bounce")
            .style("fill", function (uselsssVO, index) {
                var currentColorIndex = index % (colors.length);
                return colors[currentColorIndex];
            })
            .attr("y", function (d) {
                return yScale(d);
            })
            .attr("height", function (d) {
                return height - padding.top - padding.bottom - yScale(d);
            });

        {/* Add text element */ }
        var texts = svg.selectAll(".MyText")
            .data(dataset)
            .enter()
            .append("text")
            .attr("class", "MyText")
            .attr("transform", "translate(" + padding.left + "," + padding.top + ")")
            .attr("x", function (d, i) {
                return xScale(i) + rectPadding / 2;
            })
            .attr("dx", function () {
                return (xScale.rangeBand() - rectPadding) / 2;
            })
            .attr("dy", function (d) {
                return 20;
            })
            .text(function (d) {
                return d;
            })
            .attr("y", function (d) {
                var min = yScale.domain()[0];
                return yScale(min);
            })
            .transition()
            .delay(function (d, i) {
                return i * 200;
            })
            .duration(2000)
            .ease("bounce")
            .attr("y", function (d) {
                return yScale(d);
            });

        {/* Add x axis */ }
        svg.append("g")
            .attr("class", "axis")
            .attr("transform", "translate(" + padding.left + "," + (height - padding.bottom) + ")")
            .call(xAxis);

        {/* Add y axis */ }
        svg.append("g")
            .attr("class", "axis")
            .attr("transform", "translate(" + padding.left + "," + padding.top + ")")
            .call(yAxis);

        return (
            <svg xmlns="http://www.w3.org/2000/svg"></svg>
        );
    }
}

export default AnimSVG;
styles.css
.axis path,
.axis line {
    fill: none;
    stroke: black;
    shape-rendering: crispEdges;
}

.axis text {
    font-family: sans-serif;
    font-size: 11px;
}

.MyRect {
    fill: steelblue;
}

.MyText {
    fill: white;
    text-anchor: middle;
}
3.demo effect: 