The paper is
Bioactivity descriptors for uncharacterized chemical compounds
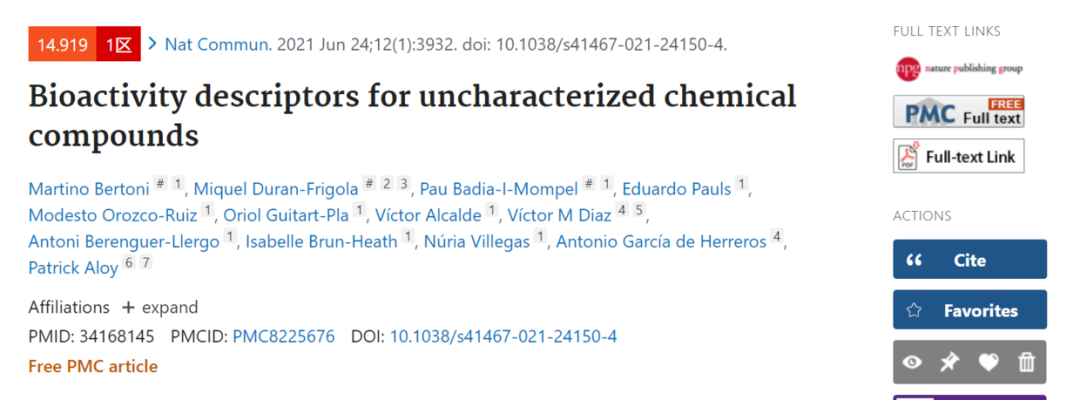
Local storage file name s41467-021-24150-4.pdf
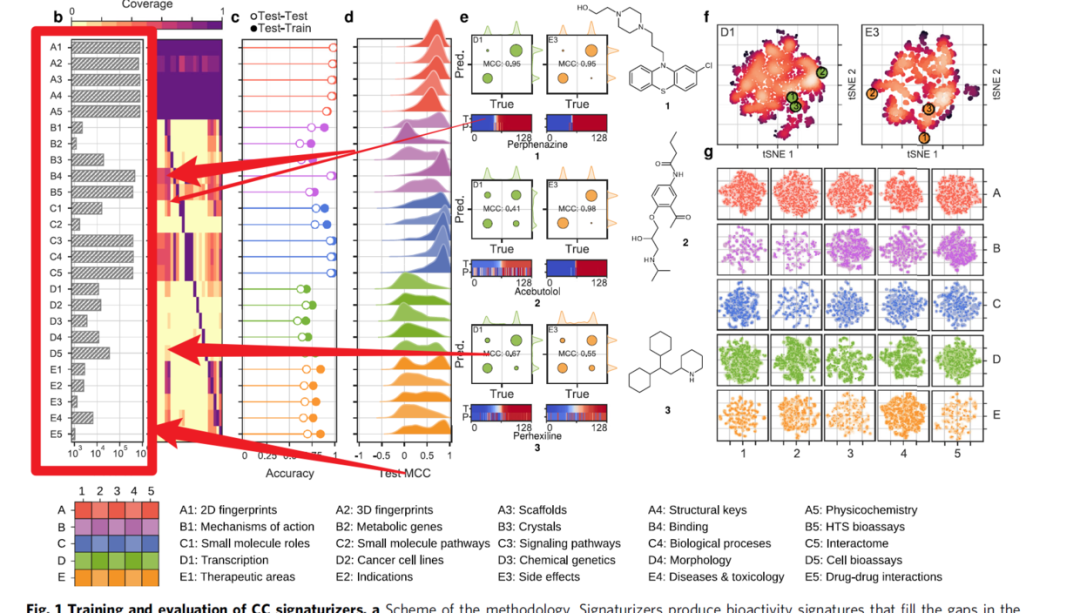
The official account of the public address asked some readers' comments on the implementation of some of the drawings in this paper, but I did not find the original data used for drawing. It's still troublesome to reproduce. When browsing the full text, I found one of the shaded bar graphs. This is still more useful. Because some journals may require color matching, only black and white and gray can be used. Distinguishing different groups and shading may be better. In a previous tweet, I introduced the R package patternplot to draw a bar chart with shading, but its code is quite different from the format of ggplot2. Recently, I found an R-package ggpattern, which is very convenient to draw a bar chart with shading or add pictures to the bar chart. Today's tweet briefly introduces this figure
ggpattern help document
- https://coolbutuseless.github.io/package/ggpattern/
The first is to install ggpattern
remotes::install_github("coolbutuseless/ggpattern")
View help documentation
help(package="ggpattern")
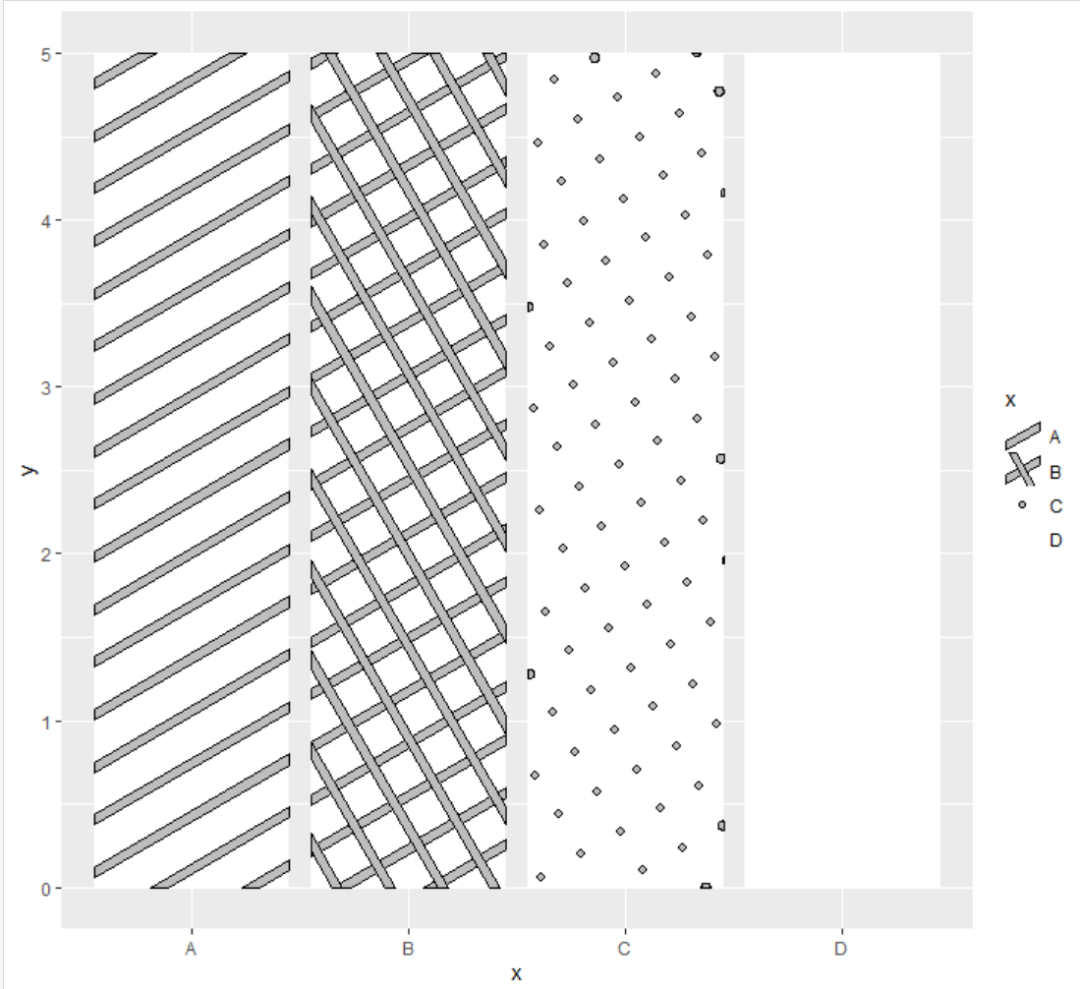
The function used for column filling is geom_col_pattern(), there are four filled contents, namely 'stripe' (default), 'crosshatch', 'point', and 'circle'
Make a simple column chart to see the effect
df<-data.frame(x=LETTERS[1:4],
               y=5)

library(ggplot2)
library(ggpattern)

ggplot()+
  geom_col_pattern(data=df,
                   aes(x=x,y=y,pattern=x),
                   #pattern="none",
                   pattern_fill="gray",
                   pattern_color="black",
                   fill="white")+
  scale_pattern_manual(values = c("stripe","crosshatch",
                                  "circle","none"))
here
- pattern_size corresponds to the internally filled border
- pattern_density corresponds to the thickness of the internal fill
- pattern_ How much is the internal filling corresponding to the setting of spacing
The help document says that point can also be used for filling, but I encountered an error when using it. I don't know the reason for this
such as
ggplot()+
  geom_col_pattern(data=df,
                   aes(x=x,y=y),
                   pattern="point",
                   pattern_fill="gray",
                   pattern_color="black",
                   fill="white")
Error reporting is
Error: Don't know the function for pattern point
Run `rlang::last_error()` to see where the error occurred.
Run rlang:: last as prompted_ Error(), return content
<error/rlang_error>
Don't know the function for pattern point
Backtrace:
  1. (function (x, ...) ...
 22. grid:::drawGTree(x)
 24. gridpattern:::makeContent.pattern(x)
 25. gridpattern:::get_pattern_fn(x$pattern)
 26. `%||%`(...)
Run `rlang::last_trace()` to see the full context.
At present, I can't understand the reason for the error report
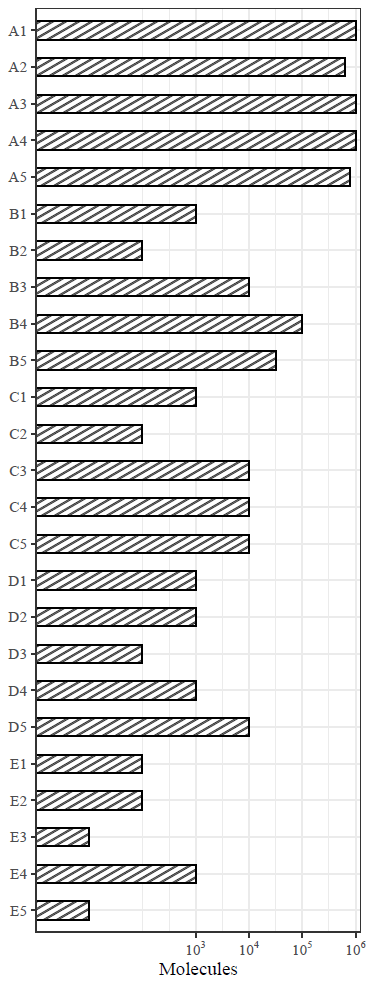
Next, imitate figure 1B in the paper
The first is to randomly construct a piece of data, as follows
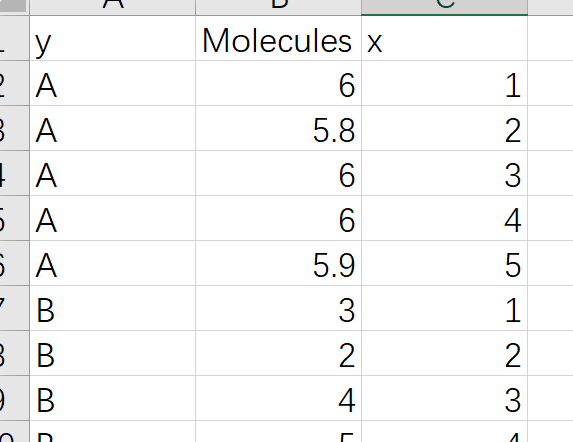
Read the dataset and paste the x and y columns together
library(readxl)
library(tidyverse)

df<-read_excel("NC_figure1B.xlsx")
df %>%
  mutate(new_col=paste(y,x,sep="")) -> df1
Mapping code
library(ggplot2)
library(ggpattern)
df1$new_col<-factor(df1$new_col,
                    levels = rev(df1$new_col))

ggplot()+
  geom_col_pattern(data=df1,aes(y=new_col,x=Molecules),
                   pattern="stripe",
                   pattern_fill="grey",
                   #pattern_color="blue",
                   pattern_density=0.2,
                   pattern_size=0,
                   fill="white",
                   color="black",
                   pattern_spacing=0.02,
                   width=0.5)+
  scale_x_continuous(expand = c(0,0),
                     limits = c(0,6.1),
                     breaks = c(3,4,5,6),
                     labels = c(expression(10^3),
                                expression(10^4),
                                expression(10^5),
                                expression(10^6)))+
  theme_bw()+
  labs(y=NULL)+
  ggsave(filename = "1b.pdf",
         width=3,
         height = 8,
         family="serif")