Catalog
Generate qualified random numbers
Weight assignment: Exponential Almon polynomial constraint consistency factor
Low Frequency Sequence Simulation (e.g. Year)
MIDAS Regression Example Monthly and Quarterly Data Converted to Same Frequency
Linear model based on least squares
Mixed Regression Based on Unconstrained
Nonlinear Estimation Based on midas_r
Sufficiency Test of Constraints
Example:

Based on the above functions and data requirements, an example of mixing regression is implemented using R code.The code is as follows:
R Code Implementation
Loading packages
library(midasr)
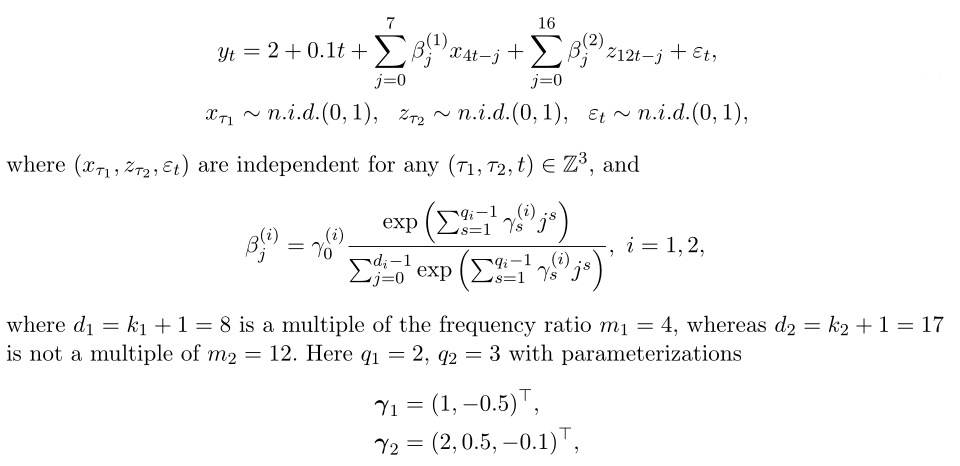
Generate qualified random numbers
set.seed(1001)  # Set random number seed
n <- 250#Low Frequency Data Sample Capacity
trend <- c(1:n)#Linear trend
x <- rnorm(4 * n)#High frequency explanatory variables, eg: quarterly data
z <- rnorm(12 * n)#High frequency explanatory variables, eg: monthly data
Weight assignment: Exponential Almon polynomial constraint consistency factor
Common forms of weighting functions:

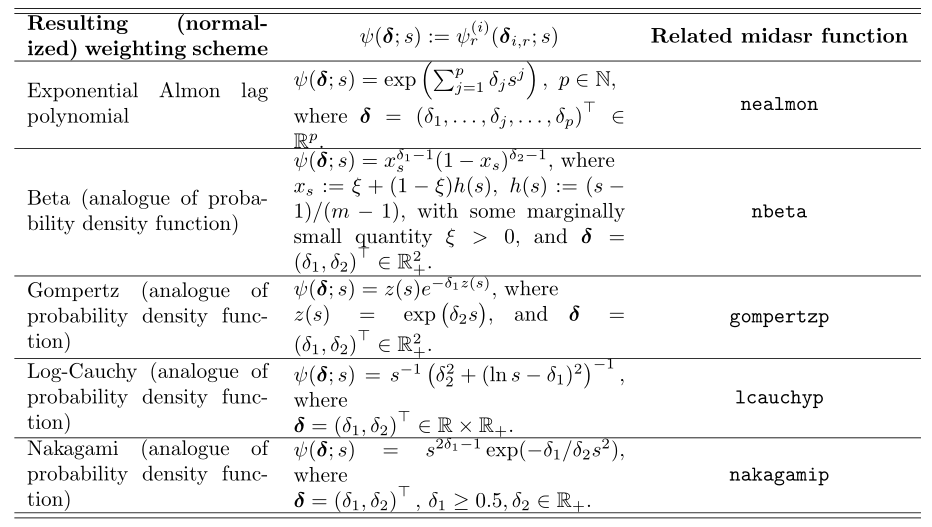
#Weight assignment: exponential Almon lag polynomial nealmon
fn_x <- nealmon(p = c(1, -0.5), d = 8)
fn_z <- nealmon(p = c(2, 0.5, -0.1), d = 17)
Low Frequency Sequence Simulation (e.g. Year)
y <- 2 + 0.1 * trend + mls(x, 0:7, 4) %*% fn_x + mls(z, 0:16, 12) %*% fn_z + rnorm(n)
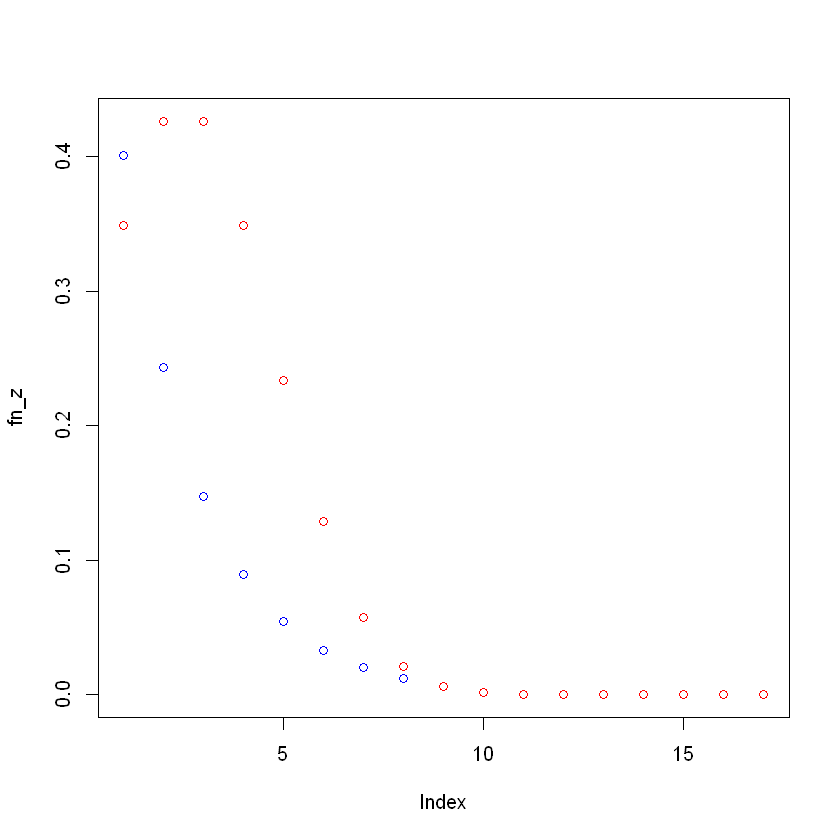
Plotting coefficient scatterplots
plot(fn_z, col = "red")
points(fn_x,col = "blue")

MIDAS Regression Example Monthly and Quarterly Data Converted to Same Frequency
Linear model based on least squares
eq_u1 <- lm(y ~ trend + mls(x, k = 0:7, m = 4) + mls(z, k = 0:16, m = 12))
summary(eq_u1)
eq_u1 results:
Call:
lm(formula = y ~ trend + mls(x, k = 0:7, m = 4) + mls(z, k = 0:16,
    m = 12))

Residuals:
    Min      1Q  Median      3Q     Max
-2.2651 -0.6489  0.1073  0.6780  2.7707

Coefficients:
                                 Estimate Std. Error t value Pr(>|t|)
(Intercept)                     1.9694327  0.1261210  15.615  < 2e-16 ***
trend                           0.1000072  0.0008769 114.047  < 2e-16 ***
mls(x, k = 0:7, m = 4)X.0/m     0.5268124  0.0643322   8.189 2.07e-14 ***
mls(x, k = 0:7, m = 4)X.1/m     0.3782006  0.0641497   5.896 1.38e-08 ***
mls(x, k = 0:7, m = 4)X.2/m     0.1879689  0.0680465   2.762 0.006219 **
mls(x, k = 0:7, m = 4)X.3/m    -0.0052409  0.0658730  -0.080 0.936658
mls(x, k = 0:7, m = 4)X.4/m     0.1504419  0.0627623   2.397 0.017358 *
mls(x, k = 0:7, m = 4)X.5/m     0.0104345  0.0655386   0.159 0.873647
mls(x, k = 0:7, m = 4)X.6/m     0.0698753  0.0692803   1.009 0.314270
mls(x, k = 0:7, m = 4)X.7/m     0.1463317  0.0650285   2.250 0.025412 *
mls(z, k = 0:16, m = 12)X.0/m   0.3671055  0.0618960   5.931 1.14e-08 ***
mls(z, k = 0:16, m = 12)X.1/m   0.3502401  0.0599615   5.841 1.83e-08 ***
mls(z, k = 0:16, m = 12)X.2/m   0.4514656  0.0659546   6.845 7.37e-11 ***
mls(z, k = 0:16, m = 12)X.3/m   0.3733747  0.0577702   6.463 6.42e-10 ***
mls(z, k = 0:16, m = 12)X.4/m   0.3609667  0.0700954   5.150 5.75e-07 ***
mls(z, k = 0:16, m = 12)X.5/m   0.2155748  0.0632036   3.411 0.000769 ***
mls(z, k = 0:16, m = 12)X.6/m   0.0648163  0.0630194   1.029 0.304828
mls(z, k = 0:16, m = 12)X.7/m   0.0665581  0.0673284   0.989 0.323955
mls(z, k = 0:16, m = 12)X.8/m  -0.0014853  0.0624569  -0.024 0.981048
mls(z, k = 0:16, m = 12)X.9/m   0.0466486  0.0675116   0.691 0.490305
mls(z, k = 0:16, m = 12)X.10/m  0.0384882  0.0664136   0.580 0.562824
mls(z, k = 0:16, m = 12)X.11/m -0.0077722  0.0591409  -0.131 0.895564
mls(z, k = 0:16, m = 12)X.12/m -0.0283221  0.0620632  -0.456 0.648589
mls(z, k = 0:16, m = 12)X.13/m -0.0375062  0.0608348  -0.617 0.538179
mls(z, k = 0:16, m = 12)X.14/m  0.0297271  0.0652273   0.456 0.649018
mls(z, k = 0:16, m = 12)X.15/m  0.0184075  0.0588059   0.313 0.754558
mls(z, k = 0:16, m = 12)X.16/m -0.0546460  0.0677214  -0.807 0.420574
---
Signif. codes:  0 '***' 0.001 '**' 0.01 '*' 0.05 '.' 0.1 ' ' 1

Residual standard error: 0.9383 on 222 degrees of freedom
  (1 observation deleted due to missingness)
Multiple R-squared:  0.9855,	Adjusted R-squared:  0.9838
F-statistic: 579.3 on 26 and 222 DF,  p-value: < 2.2e-16
Mixed Regression Based on Unconstrained
eq_u2 <- midas_u(y ~ trend + mls(x, 0:7, 4) + mls(z, 0:16, 12))
summary(eq_u2)
eq_u2 results:
Call:
lm(formula = y ~ trend + mls(x, 0:7, 4) + mls(z, 0:16, 12), data = ee)

Residuals:
    Min      1Q  Median      3Q     Max
-2.2651 -0.6489  0.1073  0.6780  2.7707

Coefficients:
                         Estimate Std. Error t value Pr(>|t|)
(Intercept)             1.9694327  0.1261210  15.615  < 2e-16 ***
trend                   0.1000072  0.0008769 114.047  < 2e-16 ***
mls(x, 0:7, 4)X.0/m     0.5268124  0.0643322   8.189 2.07e-14 ***
mls(x, 0:7, 4)X.1/m     0.3782006  0.0641497   5.896 1.38e-08 ***
mls(x, 0:7, 4)X.2/m     0.1879689  0.0680465   2.762 0.006219 **
mls(x, 0:7, 4)X.3/m    -0.0052409  0.0658730  -0.080 0.936658
mls(x, 0:7, 4)X.4/m     0.1504419  0.0627623   2.397 0.017358 *
mls(x, 0:7, 4)X.5/m     0.0104345  0.0655386   0.159 0.873647
mls(x, 0:7, 4)X.6/m     0.0698753  0.0692803   1.009 0.314270
mls(x, 0:7, 4)X.7/m     0.1463317  0.0650285   2.250 0.025412 *
mls(z, 0:16, 12)X.0/m   0.3671055  0.0618960   5.931 1.14e-08 ***
mls(z, 0:16, 12)X.1/m   0.3502401  0.0599615   5.841 1.83e-08 ***
mls(z, 0:16, 12)X.2/m   0.4514656  0.0659546   6.845 7.37e-11 ***
mls(z, 0:16, 12)X.3/m   0.3733747  0.0577702   6.463 6.42e-10 ***
mls(z, 0:16, 12)X.4/m   0.3609667  0.0700954   5.150 5.75e-07 ***
mls(z, 0:16, 12)X.5/m   0.2155748  0.0632036   3.411 0.000769 ***
mls(z, 0:16, 12)X.6/m   0.0648163  0.0630194   1.029 0.304828
mls(z, 0:16, 12)X.7/m   0.0665581  0.0673284   0.989 0.323955
mls(z, 0:16, 12)X.8/m  -0.0014853  0.0624569  -0.024 0.981048
mls(z, 0:16, 12)X.9/m   0.0466486  0.0675116   0.691 0.490305
mls(z, 0:16, 12)X.10/m  0.0384882  0.0664136   0.580 0.562824
mls(z, 0:16, 12)X.11/m -0.0077722  0.0591409  -0.131 0.895564
mls(z, 0:16, 12)X.12/m -0.0283221  0.0620632  -0.456 0.648589
mls(z, 0:16, 12)X.13/m -0.0375062  0.0608348  -0.617 0.538179
mls(z, 0:16, 12)X.14/m  0.0297271  0.0652273   0.456 0.649018
mls(z, 0:16, 12)X.15/m  0.0184075  0.0588059   0.313 0.754558
mls(z, 0:16, 12)X.16/m -0.0546460  0.0677214  -0.807 0.420574
---
Signif. codes:  0 '***' 0.001 '**' 0.01 '*' 0.05 '.' 0.1 ' ' 1

Residual standard error: 0.9383 on 222 degrees of freedom
  (1 observation deleted due to missingness)
Multiple R-squared:  0.9855,	Adjusted R-squared:  0.9838
F-statistic: 579.3 on 26 and 222 DF,  p-value: < 2.2e-16
The eq_u1 and eq_u2 results based on least squares and unconstrained mixing regression at the same frequency are consistent!
Nonlinear Estimation Based on midas_r
eq_r <- midas_r(y ~ trend + mls(x, 0:7, 4, nealmon) + mls(z, 0:16, 12, nealmon), start = list(x = c(1,-0.5), z = c(2, 0.5, -0.1)))
summary(eq_r)
Convergence Test
The Euclidean norm of the gradient and the hessian eigenvalue of the gradient are calculated by calculating the gradient and the hessian matrix to test whether the necessary and sufficient conditions for convergence are satisfied.Then determine if the gradient norm is close to zero and the eigenvalue is positive
deriv_tests(eq_r, tol = 1e-06)
Result:
$`first`
[1] FALSE

$second
[1] TRUE

$gradient
[1]  0.005542527  0.173490055 -0.005754945  0.028655981 -0.030150807  0.019224017  0.053829528

$eigenval
[1] 1.047988e+07 5.891393e+04 3.664513e+02 1.221231e+02 8.116275e+01 5.148844e+01 4.598507e+01
Coefficient Output
coef(eq_r)#Returns the coefficient of significance for the t-test
Result:
(Intercept)       trend          x1          x2          z1          z2          z3
 1.98820762  0.09988275  1.35336157 -0.50747744  2.26312231  0.40927986 -0.07293300
coef(eq_r, midas = TRUE)#Return all coefficients
Result:
 (Intercept)        trend           x1           x2           x3           x4           x5           x6           x7
1.988208e+00 9.988275e-02 5.480768e-01 3.299490e-01 1.986333e-01 1.195797e-01 7.198845e-02 4.333793e-02 2.608997e-02
          x8           z1           z2           z3           z4           z5           z6           z7           z8
1.570648e-02 3.346806e-01 4.049071e-01 4.233810e-01 3.826120e-01 2.988388e-01 2.017282e-01 1.176921e-01 5.934435e-02
          z9          z10          z11          z12          z13          z14          z15          z16          z17
2.586203e-02 9.740853e-03 3.170901e-03 8.921121e-04 2.169239e-04 4.558760e-05 8.280130e-06 1.299807e-06 1.763484e-07
On the basis of eq_r, the function amweights is used to form several standard periodic function constraints
amweights(p = c(1, -0.5), d = 8, m = 4, weight = nealmon, type = "C")
nealmon(p = c(1, -0.5), d = 4)

eq_r1 <- midas_r(y ~ trend + mls(x, 0:7, 4, amweights, nealmon, "C") + mls(z, 0:16, 12, nealmon), start = list(x = c(1, -0.5), z = c(2, 0.5, -0.1)))
summary(eq_r1)
Other Weighting Forms
fn <- gompertzp#Weight setting for probability density function
eq_r2 <- midas_r(y ~ trend + mls(x, 0:7, 4, nealmon) + mls(z, 0:16, 12, fn), start = list(x = c(1,-0.5), z = c(1, 0.5, 0.1)))
summary(eq_r2)
eq_r3 <- midas_r(y ~ trend + mls(x, 0:7, 4) + mls(z, 0:16, 12, nealmon), start = list(z = c(1,-0.5)))
summary(eq_r3)

eq_r4 <- midas_r(y ~ trend + mls(y, 1:2, 1) + mls(x, 0:7, 4, nealmon), start = list(x = c(1,-0.5)))
summary(eq_r4)

eq_r5 <- midas_r(y ~ trend + mls(y, 1:2, 1, "*") + mls(x, 0:7, 4, nealmon), start = list(x = c(1,-0.5)))
summary(eq_r5)

eq_r6 <- midas_r(y ~ trend + mls(y, 1:4, 1, nealmon) + mls(x, 0:7, 4, nealmon), start = list(y = c(1, -0.5), x = c(1, -0.5)))
summary(eq_r6)

eq_r7 <- midas_r(y ~ trend + mls(x, 0:7, 4, amweights, nealmon, "B"), start = list(x = c(1, 1, -0.5)))                                                                                         summary(eq_r7)

eq_r8 <- midas_r(y ~ trend + mls(x, 0:7, 4, amweights, nealmon, "C"), start = list(x = c(1, -0.5)))                                                                                         summary(eq_r8)

eq_r9 <- midas_r(y ~ trend + mls(x, 0:7, 4, amweights, nealmon, "A"), start = list(x = c(1, 1, 1, -0.5)))
summary(eq_r9)
fn <- function(p, d) {
  p[1] * c(1:d)^p[2]
}
eq_r10 <- midas_r(y ~ trend + mls(x, 0:101, 4, fn), start = list(x = rep(0, 2)))
summary(eq_r10)
Sufficiency Test of Constraints
As long as the errors are independent and identically distributed, the hAh_test test can be used, while the hAhr_test is a HAC-Roust robust version test.As long as no significant hac is observed in the residuals, the hAh_test test test is more accurate in small samples.
eq_r12 <- midas_r(y ~ trend + mls(x, 0:7, 4, nealmon) + mls(z, 0:16, 12, nealmon), start = list(x = c(1, -0.5), z = c(2, 0.5, -0.1)))
summary(eq_r12)
#Sufficiency Test of Constraints
hAh_test(eq_r12)
hAhr_test(eq_r12)
Result:
hAh restriction test

data:
hAh = 16.552, df = 20, p-value = 0.6818

hAh restriction test (robust version)

data:
hAhr = 14.854, df = 20, p-value = 0.7847
Contrast: Reduce the number of parameters constrained by the function of variable z from 17 to 2
eq_r13 <- midas_r(y ~ trend + mls(x, 0:7, 4, nealmon) + mls(z, 0:12, 12, nealmon), start = list(x = c(1, -0.5), z = c(2, -0.1)))
hAh_test(eq_r13)
hAhr_test(eq_r13)
summary(eq_r13)
Result:
	hAh restriction test

data:
hAh = 36.892, df = 17, p-value = 0.00348


	hAh restriction test (robust version)

data:
hAhr = 32.879, df = 17, p-value = 0.01168
Reject the original assumption that there are insufficient constraints
Optimal Model Selection
step1: The function expand_weights_lags defines the potential set of models for each model
set_x <- expand_weights_lags(weights = c("nealmon", "almonp"), from = 0, to = c(5, 10), m = 1, start = list(nealmon = rep(1, 2), almonp = rep(1, 3)))


set_z <- expand_weights_lags(weights = c("nealmon", "nbeta"), from = 1, to = c(2, 3), m = 1, start = list(nealmon = rep(0,2), nbeta = rep(0.5, 3)))
step2: Estimates for all possible models
The function midas_r_ic_table returns a summary table of all models, along with the corresponding values of common information criteria and the empirical size of the parameter constraint adequacy test (default is the hAh_test test test test).The results of the derivative test and the convergence state of the optimization function are given.
eqs.ic <- midas_r_ic_table(y ~ trend + mls(x, 0, m = 4) + fmls(z, 0, m = 12), table = list(z = set_z,x = set_x), start = c(`(Intercept)` = 0, trend = 0))

mod <- modsel(eqs.ic, IC = "AIC", type = "restricted")
step3: View a candidate model to fine-tune its convergence and update the results:
eqs_ic$candlist[[5]] <- update(eqs_ic$candlist[[5]], Ofunction = "nls")

eqs_ic <- update(eqs_ic)
Select model manually
step1: training set (in-sample prediction), test set (out-of-sample prediction) segmentation
datasplit <- split_data(list(y = y, x = x, z = z, trend = trend), insample = 1:200, outsample = 201:250)
step2: Fit the selected models separately
mod1 <- midas_r(y ~ trend + mls(x, 4:14, 4, nealmon) + mls(z, 12:22, 12, nealmon), data = datasplit$indata, start = list(x = c(10, 1, -0.1), z = c(2, -0.1)))

mod2 <- midas_r(y ~ trend + mls(x, 4:20, 4, nealmon) + mls(z, 12:25, 12, nealmon), data = datasplit$indata, start = list(x = c(10, 1, -0.1), z = c(2, -0.1)))
step3:Calculation
avgf <- average_forecast(list(mod1, mod2), data = list(y = y, x = x, z = z, trend = trend), insample = 1:200, outsample = 201:250, type = "fixed", measures = c("MSE", "MAPE", "MASE"), fweights = c("EW", "BICW", "MSFE", "DMSFE"))In-sample and out-of-sample prediction accuracy output:
avgf$accuracy
Result comparison:
$`individual`
                                                              Model MSE.out.of.sample MAPE.out.of.sample
1 y ~ trend + mls(x, 4:14, 4, nealmon) + mls(z, 12:22, 12, nealmon)          1.848474           4.474242
2 y ~ trend + mls(x, 4:20, 4, nealmon) + mls(z, 12:25, 12, nealmon)          1.763432           4.391594
  MASE.out.of.sample MSE.in.sample MAPE.in.sample MASE.in.sample
1          0.8155477      1.768720       14.05880      0.6992288
2          0.7976764      1.726365       13.56287      0.6897242

$average
  Scheme      MSE     MAPE      MASE
1     EW 1.803640 4.432918 0.8066121
2   BICW 1.763433 4.391595 0.7976766
3   MSFE 1.802640 4.431945 0.8064017
4  DMSFE 1.801787 4.431112 0.8062216
mod1,mod2 prediction output:
avgf$forecast
Result comparison:
          [,1]     [,2]
 [1,] 22.24057 22.38300
 [2,] 22.12774 22.13778
 [3,] 22.22678 22.21942
 [4,] 22.44535 22.61872
 [5,] 22.36448 22.46157
 [6,] 22.49847 22.66663
 [7,] 22.70192 22.70818
 [8,] 22.49411 22.53326
 [9,] 22.47978 22.54235
[10,] 22.43439 22.46522
[11,] 22.61563 22.57788
[12,] 22.87686 22.88271
[13,] 22.59329 22.64370
[14,] 23.39675 23.47606
[15,] 23.25864 23.27932
[16,] 22.97588 23.09488
[17,] 23.13196 23.21956
[18,] 24.05489 24.04334
[19,] 24.11690 24.16742
[20,] 23.79328 23.91429
[21,] 24.58047 24.58925
[22,] 24.33794 24.45825
[23,] 23.96658 24.03107
[24,] 24.00510 24.12939
[25,] 23.96473 23.99645
[26,] 24.02198 24.04416
[27,] 25.01521 24.91966
[28,] 24.47063 24.59918
[29,] 24.58748 24.51964
[30,] 24.69662 24.72768
[31,] 25.19092 25.22659
[32,] 25.57452 25.72345
[33,] 25.06312 25.17678
[34,] 24.99302 25.09359
[35,] 25.13005 25.16293
[36,] 25.85870 25.85633
[37,] 25.43593 25.46734
[38,] 25.80690 25.88224
[39,] 26.80900 26.82394
[40,] 26.44056 26.63095
[41,] 26.04786 26.17996
[42,] 26.09545 26.29647
[43,] 25.99309 25.98112
[44,] 25.89755 26.03643
[45,] 25.99814 26.18442
[46,] 26.25727 26.38797
[47,] 26.79563 26.92593
[48,] 26.57034 26.68217
[49,] 26.53808 26.51001
[50,] 26.72772 26.76183
Combination prediction effect output:
avgf$avgforecast
Result comparison:
Among them, EW: weighted combination based on eigenvalues; BICW: weighted combination based on BIC information criteria; MSFE: weighted combination based on mean square error of prediction; DMSFE: discounted MSFE
         EW     BICW     MSFE    DMSFE
 [1,] 22.31178 22.38299 22.31346 22.31489
 [2,] 22.13276 22.13778 22.13288 22.13298
 [3,] 22.22310 22.21942 22.22301 22.22294
 [4,] 22.53204 22.61872 22.53408 22.53582
 [5,] 22.41303 22.46157 22.41417 22.41515
 [6,] 22.58255 22.66663 22.58453 22.58622
 [7,] 22.70505 22.70818 22.70512 22.70519
 [8,] 22.51369 22.53326 22.51415 22.51454
 [9,] 22.51107 22.54235 22.51180 22.51244
[10,] 22.44980 22.46522 22.45017 22.45048
[11,] 22.59675 22.57788 22.59631 22.59593
[12,] 22.87979 22.88271 22.87986 22.87991
[13,] 22.61849 22.64370 22.61909 22.61960
[14,] 23.43641 23.47606 23.43734 23.43814
[15,] 23.26898 23.27932 23.26922 23.26943
[16,] 23.03538 23.09488 23.03678 23.03798
[17,] 23.17576 23.21956 23.17679 23.17767
[18,] 24.04912 24.04334 24.04898 24.04887
[19,] 24.14216 24.16742 24.14276 24.14326
[20,] 23.85379 23.91429 23.85521 23.85643
[21,] 24.58486 24.58925 24.58497 24.58505
[22,] 24.39809 24.45825 24.39951 24.40072
[23,] 23.99882 24.03107 23.99958 24.00023
[24,] 24.06724 24.12938 24.06870 24.06996
[25,] 23.98059 23.99645 23.98096 23.98128
[26,] 24.03307 24.04416 24.03334 24.03356
[27,] 24.96744 24.91967 24.96631 24.96535
[28,] 24.53491 24.59918 24.53642 24.53771
[29,] 24.55356 24.51964 24.55277 24.55208
[30,] 24.71215 24.72768 24.71252 24.71283
[31,] 25.20876 25.22659 25.20918 25.20954
[32,] 25.64898 25.72345 25.65074 25.65224
[33,] 25.11995 25.17678 25.12129 25.12244
[34,] 25.04331 25.09359 25.04449 25.04550
[35,] 25.14649 25.16293 25.14688 25.14721
[36,] 25.85751 25.85633 25.85749 25.85746
[37,] 25.45163 25.46734 25.45200 25.45232
[38,] 25.84457 25.88224 25.84546 25.84622
[39,] 26.81647 26.82394 26.81665 26.81680
[40,] 26.53575 26.63095 26.53799 26.53991
[41,] 26.11391 26.17996 26.11546 26.11679
[42,] 26.19596 26.29647 26.19833 26.20035
[43,] 25.98711 25.98112 25.98696 25.98684
[44,] 25.96699 26.03642 25.96862 25.97002
[45,] 26.09128 26.18442 26.09348 26.09535
[46,] 26.32262 26.38797 26.32416 26.32548
[47,] 26.86078 26.92593 26.86232 26.86363
[48,] 26.62626 26.68217 26.62757 26.62870
[49,] 26.52404 26.51001 26.52371 26.52343
[50,] 26.74478 26.76183 26.74518 26.74552