sketch
QCustomPlot is a graphic library based on Qt C + +, which is used for drawing and data visualization - making beautiful 2D charts - curves, trends, coordinate charts, histograms, etc., and providing high-performance services for real-time visualization applications. It has no further dependencies and is well documented.
download
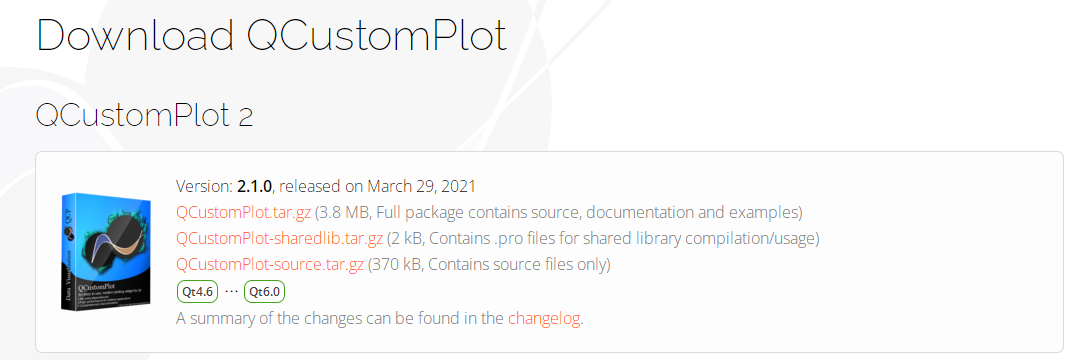
get into QCustomPlot download page , download the latest complete package (including source code, documents and examples)!
Unzip the downloaded installation package, including documents, examples, change logs, GPL authorization, and the two most important files qcustomplot.h and qcustomplot.cpp.
to configure
file
The complete API documentation is in complete API documentation Above, or as part of the complete package, can be found in the extracted directory. It contains a hierarchy of HTML documents and qch help files for QtCreator/Assistant integration. If you use QtCreator or assistant, you should consider using qch files, which will greatly improve work efficiency!
Integrated into QtCreator/Assistant
The integration qch file is quite simple:
- Copy the qcustomplot.qch file to the place where you need to store it (for example, the local QtCreator configuration directory).
- In QtCreator, select tools - > Options - > help - >
Document, you will see a list of loaded document modules and the button to add / remove modules. Click the "add..." button and select the qcustomplot.qch file.
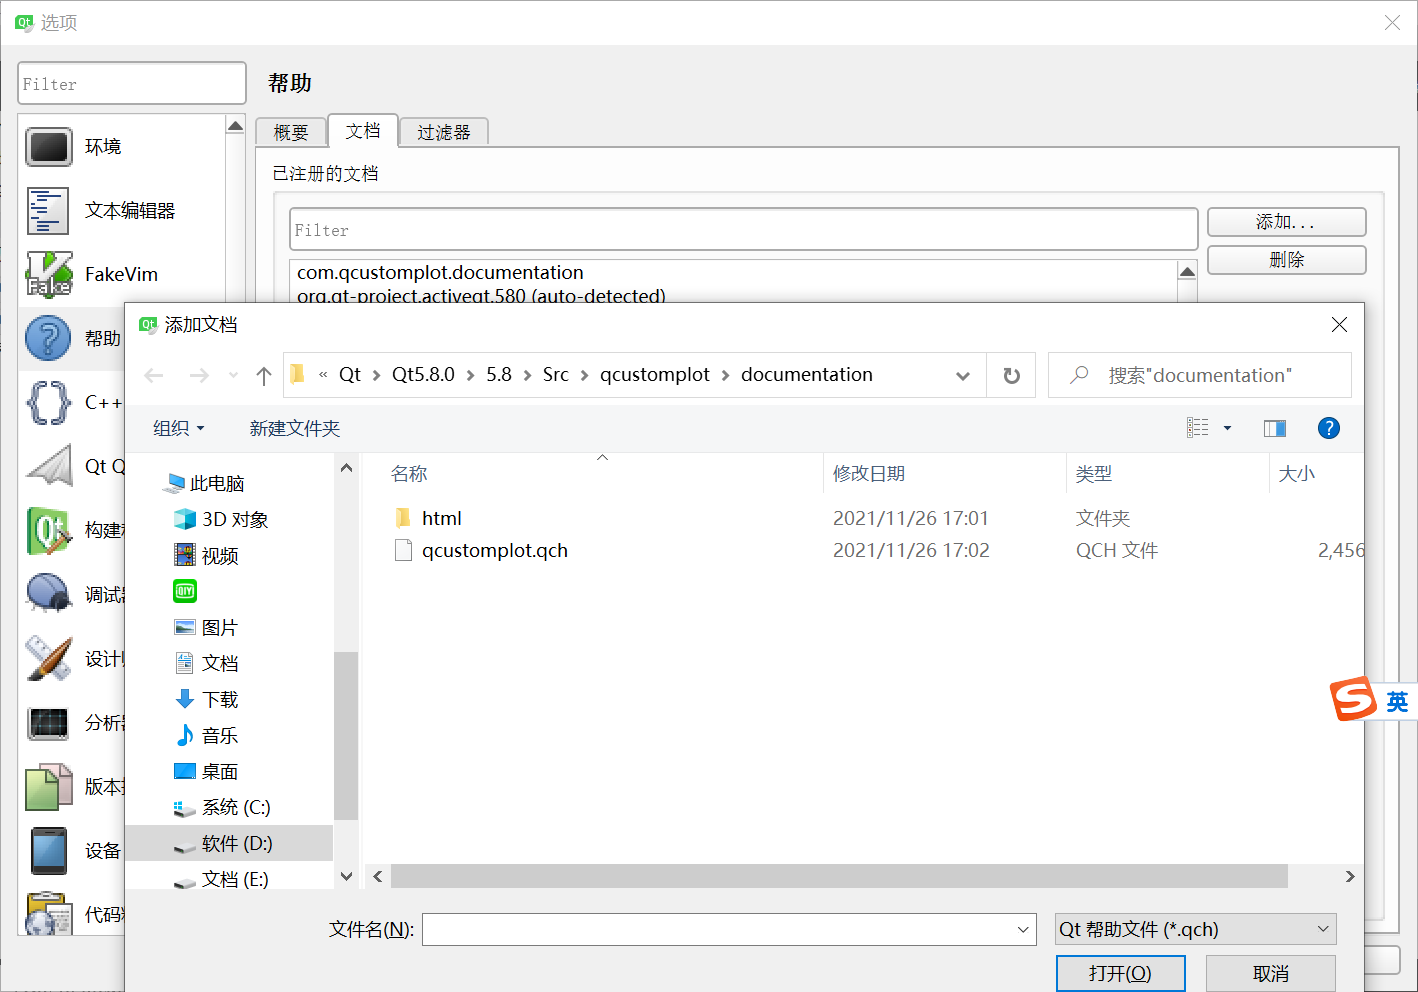
In this way, we have finished adding. You can search QCustomPlot related classes or functions through: Help - > index. When you place the cursor on any QCustomPlot related class or function and press F1, the corresponding document item will pop up, just like Qt component.
use
In examples, we will see some self-contained examples, which can be run to see the effect.
If it is used in your own project, the following configuration is required:
First, you need to add in pro (because the export function exists in QCustomPlot, the printsupport module is used):
QT += printsupport
Then, copy qcustomplot.h and qcustomplot.cpp to the project directory, right-click - > Add existing files... And add these two files to the project.
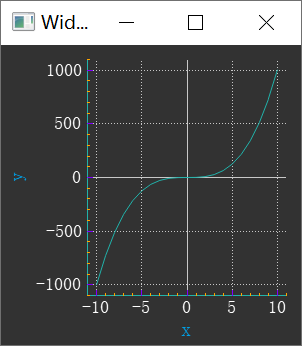
Next, let's implement a graph. In order to enhance the effect, we set some styles.
effect
Source code
 QCustomPlot *pCustomPlot = new QCustomPlot(this);
    pCustomPlot->resize(300, 300);

    // The variable array stores the data of the coordinates of the drawing, and stores the data of x and y coordinates respectively. 101 is the data length
    QVector<double> x(101), y(101);

    // Add data. Here we show that y = x^3. For positive and negative symmetry, X is from - 10 to + 10
    for (int i = 0; i < 101; ++i)
    {
        x[i] = i/5 - 10;
        y[i] = qPow(x[i], 3);  // The y-th power of x;
    }

    // Add a curve to the drawing area QCustomPlot
    QCPGraph *pGraph = pCustomPlot->addGraph();

    // Add data
    pCustomPlot->graph(0)->setData(x, y);

    // Sets the axis name
    pCustomPlot->xAxis->setLabel("x");
    pCustomPlot->yAxis->setLabel("y");

    // Set background color
    pCustomPlot->setBackground(QColor(50, 50, 50));

    pGraph->setPen(QPen(QColor(32, 178, 170)));

    // Set x/y axis text color, axis color, font, etc
    pCustomPlot->xAxis->setTickLabelColor(Qt::white);
    pCustomPlot->xAxis->setLabelColor(QColor(0, 160, 230));
    pCustomPlot->xAxis->setBasePen(QPen(QColor(32, 178, 170)));
    pCustomPlot->xAxis->setTickPen(QPen(QColor(128, 0, 255)));
    pCustomPlot->xAxis->setSubTickPen(QColor(255, 165, 0));
    QFont xFont = pCustomPlot->xAxis->labelFont();
    xFont.setPixelSize(20);
    pCustomPlot->xAxis->setLabelFont(xFont);

    pCustomPlot->yAxis->setTickLabelColor(Qt::white);
    pCustomPlot->yAxis->setLabelColor(QColor(0, 160, 230));
    pCustomPlot->yAxis->setBasePen(QPen(QColor(32, 178, 170)));
    pCustomPlot->yAxis->setTickPen(QPen(QColor(128, 0, 255)));
    pCustomPlot->yAxis->setSubTickPen(QColor(255, 165, 0));
    QFont yFont = pCustomPlot->yAxis->labelFont();
    yFont.setPixelSize(20);
    pCustomPlot->yAxis->setLabelFont(yFont);

    // Set the axis display range, otherwise only the default range can be seen
    pCustomPlot->xAxis->setRange(-11, 11);
    pCustomPlot->yAxis->setRange(-1100, 1100);
If we need to export, we can call the corresponding save... Interface.
For example, export a picture in PNG format with width of 400px and width of 300px:
pCustomPlot->savePng("customPlot.png", 400, 300);