Using python for image processing, now you need to read out any area of the image and convert it into a one-dimensional array, which is convenient for subsequent convolution operation.
There are two ways to do this:
convert function
from PIL import Image
import numpy as np
import matplotlib.pyplot as plt
def ImageToMatrix(filename):
im = Image.open(filename) # Read pictures
im.show() # display picture
width,height = im.size
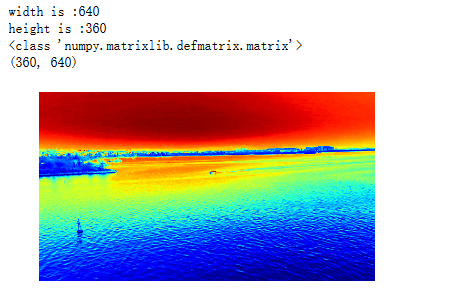
print("width is :" + str(width))
print("height is :" + str(height))
im = im.convert("L") # Pic -- > mat conversion, you can choose different modes. Here is the specific description of the function source code
data = im.getdata()
data = np.matrix(data,dtype='float')/255.0
new_data = np.reshape(data * 255.0,(height,width))
new_im = Image.fromarray(new_data)
# Show pictures from matrix data
new_im.show()
return new_data
def MatrixToImage(data):
data = data*255
new_im = Image.fromarray(data.astype(np.uint8))
return new_im
'''
convert(self, mode=None, matrix=None, dither=None, palette=0, colors=256)
| Returns a converted copy of this image. For the "P" mode, this
| method translates pixels through the palette. If mode is
| omitted, a mode is chosen so that all information in the image
| and the palette can be represented without a palette.
|
| The current version supports all possible conversions between
| "L", "RGB" and "CMYK." The **matrix** argument only supports "L"
| and "RGB".
|
| When translating a color image to black and white (mode "L"),
| the library uses the ITU-R 601-2 luma transform::
|
| L = R * 299/1000 + G * 587/1000 + B * 114/1000
|
| The default method of converting a greyscale ("L") or "RGB"
| image into a bilevel (mode "1") image uses Floyd-Steinberg
| dither to approximate the original image luminosity levels. If
| dither is NONE, all non-zero values are set to 255 (white). To
| use other thresholds, use the :py:meth:`~PIL.Image.Image.point`
| method.
|
| :param mode: The requested mode. See: :ref:`concept-modes`.
| :param matrix: An optional conversion matrix. If given, this
| should be 4- or 12-tuple containing floating point values.
| :param dither: Dithering method, used when converting from
| mode "RGB" to "P" or from "RGB" or "L" to "1".
| Available methods are NONE or FLOYDSTEINBERG (default).
| :param palette: Palette to use when converting from mode "RGB"
| to "P". Available palettes are WEB or ADAPTIVE.
| :param colors: Number of colors to use for the ADAPTIVE palette.
| Defaults to 256.
| :rtype: :py:class:`~PIL.Image.Image`
| :returns: An :py:class:`~PIL.Image.Image` object.
'''Original image: 
filepath = "./imgs/"

imgdata = ImageToMatrix("./imgs/0001.jpg")
print(type(imgdata))
print(imgdata.shape)

plt.imshow(imgdata) # display picture
plt.axis('off')     # Do not show axis
plt.show()
Operation result:
mpimg function
import matplotlib.pyplot as plt # plt for displaying pictures
import matplotlib.image as mpimg # mpimg for reading pictures
import numpy as np
def readPic(picname, filename):
img = mpimg.imread(picname)
# Now img is a np.array, which can be processed arbitrarily
weight,height,n = img.shape #(512, 512, 3)
print("the original pic: \n" + str(img))
plt.imshow(img) # display picture
plt.axis('off') # Do not show axis
plt.show()
# Take the first dimension data of the matrix after reshape, that is, the required data list
img_reshape = img.reshape(1,weight*height*n)[0]
print("the 1-d image data :\n "+str(img_reshape))
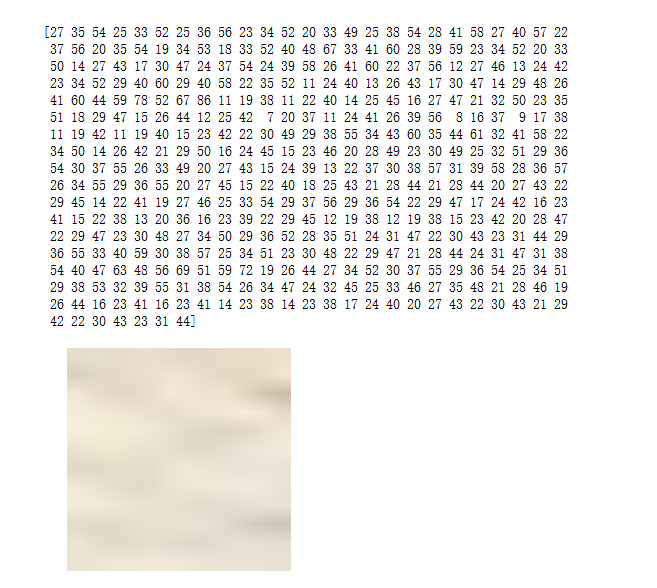
# A small block (12 * 12 * 3) of (300300) area is intercepted, and the image data of this area is converted into one-dimensional array
img_cov = np.random.randint(1,2,(12,12,3)) # Here, use np.ones() to initialize the array, and it will appear that the array element is of float type. Use NP. Random. Random to ensure that it is of int type
for j in range(12):
for i in range(12):
img_cov[i][j] = img[300+i][300+j]
img_reshape = img_cov.reshape(1,12*12*3)[0]
print((img_cov))
print(img_reshape)
# Print the image of the 12 * 12 * 3 area
plt.imshow(img_cov)
plt.axis('off')
plt.show()
# Writing file
# Open: open the file in append mode. If no corresponding file is found, create a file with this name
with open(filename, 'a') as f:
f.write(str(img_reshape))
return img_reshape
if __name__ == '__main__':
picname = './imgs/0001.jpg'
readPic(picname, "data.py")Read out data (12 * 12 * 3), each pixel point is arranged in the order of R, G, B, and the effect of displaying this area as a picture: