1, Principle
Reference blog:
Python implementation of DBSCAN clustering algorithm_ Xu Yi's column - CSDN blog_ dbscan python https://blog.csdn.net/xyisv/article/details/88918448 DBSCAN is a density based clustering algorithm. This kind of density clustering algorithm generally assumes that the category can be determined by the tightness of sample distribution. Samples of the same category are closely connected, that is, there must be samples of the same category not far from any sample of the category.
By classifying the closely connected samples into one class, a cluster category is obtained. By dividing all groups of closely connected samples into different categories, we get the final results of all clustering categories.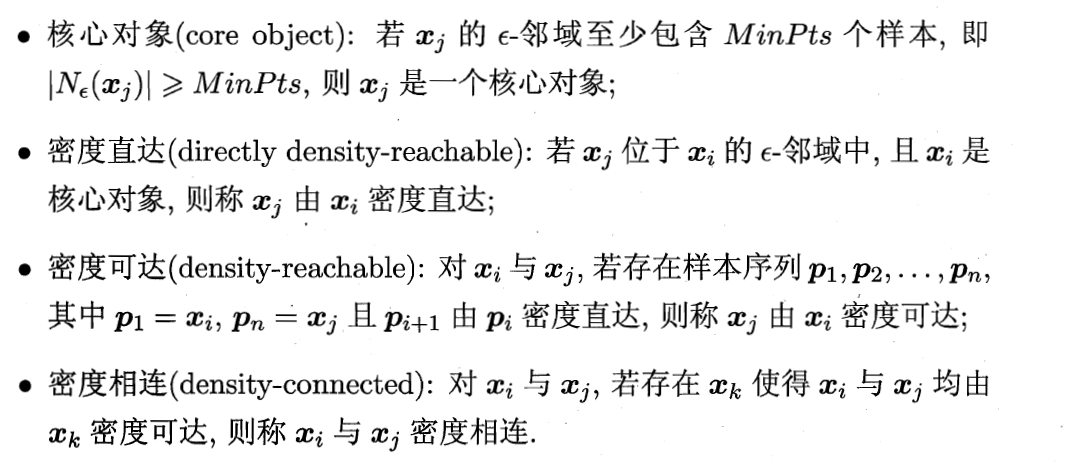

x1 is the core object, x2 is directly from x1 density, x3 is up to x1 density, and x3 is connected with x4 density
2, Python practice
Reference link:
Learn Python from scratch [31] - DBSCAN clustering (practical part) - cloud + community - Tencent cloud (tencent.com)https://cloud.tencent.com/developer/article/1480298 In Python's sklearn module, the cluster sub module integrates common clustering algorithms, such as K-means clustering, density clustering and hierarchical clustering. For density clustering, readers can directly call the DBSCAN "class" in the cluster sub module. The syntax and parameter meanings of the "class" are as follows:
cluster.DBSCAN(eps=0.5, min_samples=5, metric='euclidean',
              metric_params=None, algorithm='auto',
              leaf_size=30, p=None, n_jobs=1)
eps: Used to set the in density clusteringεField, i.e. radius, defaults to 0.5;
min_samples: Used to setεThe minimum sample size in the field, which is 5 by default;
metric: Specifies the method for calculating the distance between points. The default is Euclidean distance;
metric_params: Used to specify metric Corresponding other parameter values;
algorithm: In the process of calculating the distance between points, an algorithm for pointing to search the nearest sample point; Default to'auto',Indicates that density clustering will automatically select an appropriate search method; If yes'ball_tree',It means to search the nearest neighbor using the ball tree; If yes'kd_tree',Then it means using K-D The tree searches for the nearest neighbor; If yes'brute',It means using violence to search for the nearest neighbor;
leaf_size: When parameter algorithm by'ball_tree'or'kd_tree'It is used to specify the maximum sample size contained in the leaf node of the tree. The default is 30; This parameter will affect the construction of search tree and the speed of searching the nearest neighbor;
p: When parameter metric For Minkowski distance('minkowski'),p=1,Represents the Manhattan distance between calculation points; p=2,Indicates the Euclidean distance between calculation points; the default value of this parameter is 2;
n_jobs: Used to set the required for parallel computing of density clustering algorithm CPU Quantity. The default value is 1, which means only 1 is used CPU Run the algorithm, i.e. do not use the parallel operation function;
It should be noted that in the DBSCAN "class" In, the parameters eps and min_samples need to be adjusted at the same time, that is, several candidate values are usually specified and a reasonable threshold value is selected from the candidate values; when the parameter eps is fixed, the larger the parameter min_samples, the fewer core objects will be formed, and many abnormal points will be misjudged, and the number of clusters will increase. On the contrary, a large number of core objects will be generated, resulting in The number of clusters is reduced; when the parameter min_samples is fixed, the larger the parameter eps, more points will fall into the cluster ε If the parameters eps and min_samples are unreasonable, the increase or decrease of the number of clusters is often wrong. For example, samples that should be clustered into one class are clustered into multiple classes due to the increase of the number of clusters; they should not be clustered into one The samples of class are clustered into one class due to the reduction of the number of clusters.
Actual combat I
Reference link:
import numpy as np
from sklearn.cluster import DBSCAN
from sklearn import metrics
from sklearn.datasets._samples_generator import make_blobs
from sklearn.preprocessing import StandardScaler
import matplotlib.pyplot as plt
import seaborn as sns #Visualization Library
# Generate cluster center point
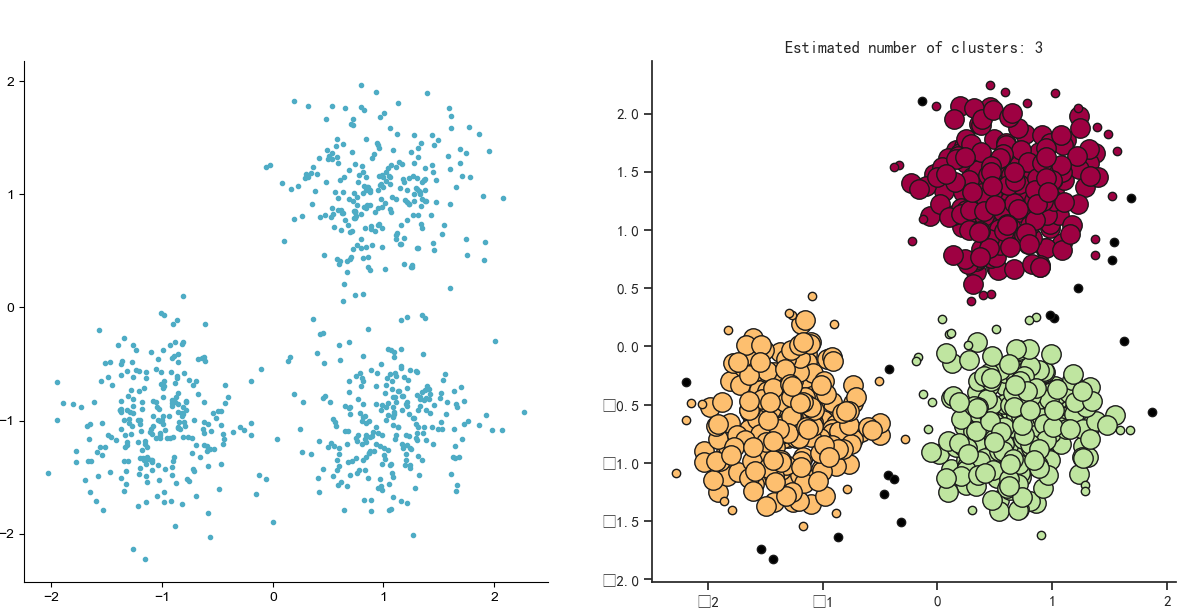
centers = [[1, 1], [-1, -1], [1, -1]]
# Generate sample dataset
X, labels_true = make_blobs(n_samples=750, centers=centers, cluster_std=0.4,random_state=0)
#Canvas settings
fig = plt.figure(figsize=(12,5))
fig.subplots_adjust(left=0.02, right=0.98, bottom=0.05, top=0.9)
ax = fig.add_subplot(1,2,1)
row, _ = np.shape(X)
#Draw subgraphs, unclustered points
for i in range(row):
ax.plot(X[i, 0], X[i, 1], '#4EACC5', marker='.')
# The StandardScaler is standardized for each feature dimension, not for samples.
X = StandardScaler().fit_transform(X)
# Call density clustering DBSCAN
db = DBSCAN(eps=0.3, min_samples=10).fit(X)
# print(db.labels_) # db.labels_ is the clustering index of all samples, and the non clustering index is - 1
# print(db.core_sample_indices_) # Index of all core samples
core_samples_mask = np.zeros_like(db.labels_, dtype=bool) # Set the full false vector of the number and length of a sample
core_samples_mask[db.core_sample_indices_] = True #Set the core sample section to true
labels = db.labels_
n_clusters_ = len(set(labels)) - (1 if -1 in labels else 0)
# Obtain the number of clusters. (in the clustering result, - 1 indicates that there are no clusters as discrete points)
# Model evaluation
print('The estimated number of clusters is: %d' % n_clusters_)
print("homogeneity: %0.3f" % metrics.homogeneity_score(labels_true, labels)) # Each cluster contains only members of a single class.
print("Integrity: %0.3f" % metrics.completeness_score(labels_true, labels)) # All members of a given class are assigned to the same cluster.
print("V-measure: %0.3f" % metrics.v_measure_score(labels_true, labels)) # Harmonic average of homogeneity and integrity
print("Adjusted Rand index: %0.3f" % metrics.adjusted_rand_score(labels_true, labels))
print("Adjust mutual information: %0.3f" % metrics.adjusted_mutual_info_score(labels_true, labels))
print("Contour coefficient: %0.3f" % metrics.silhouette_score(X, labels))
sns.set(font='SimHei',style='ticks')
unique_labels = set(labels)
colors = [plt.cm.Spectral(each) for each in np.linspace(0, 1, len(unique_labels))]
ax = fig.add_subplot(1,2,2)
for k, col in zip(unique_labels, colors):
if k == -1: # The samples with clustering result of - 1 are discrete points
# Draw discrete points in black
col = [0, 0, 0, 1]
class_member_mask = (labels == k) # Set all sample positions belonging to the cluster to true
xy = X[class_member_mask & core_samples_mask] # Take out all core samples belonging to this class and draw them with large icons
ax.plot(xy[:, 0], xy[:, 1], 'o', markerfacecolor=tuple(col),markeredgecolor='k', markersize=14)
xy = X[class_member_mask & ~core_samples_mask] # Take out all non core samples belonging to this class and draw them with small icons
ax.plot(xy[:, 0], xy[:, 1], 'o', markerfacecolor=tuple(col),markeredgecolor='k', markersize=6)
plt.title('Estimated number of clusters: %d' % n_clusters_)
sns.despine()
plt.show()The estimated number of clusters is: 3
Homogeneity: 0.953
Integrity: 0.883
V-measure: 0.917
Adjusted Rand index: 0.952
Adjust mutual information: 0.916
Contour coefficient: 0.626
The Rand is used to measure the fit of the two distributions. The larger the value is, the more consistent the clustering result is with the real situation. The value range [-1,1], the closer the value is to 1, the better the clustering effect is.
Experimental diagram:
Actual combat II
Reference link: DBSCAN clustering algorithm Python implementation Xu Yi's column CSDN blog dbscan pythonhttps://blog.csdn.net/xyisv/article/details/88918448
from sklearn import datasets
import numpy as np
import random
import matplotlib.pyplot as plt
import time
import copy
#def defines function + function name (parameter), return value: return()
def find_neighbor(j, x, eps):
N = list()
for i in range(x.shape[0]):
temp = np.sqrt(np.sum(np.square(x[j] - x[i]))) # Calculate Euclidean distance
#If the distance is less than eps
if temp <= eps:
#append is used to add a new object at the end of the list
N.append(i)
#Returns the index of the neighbor
return set(N)
def DBSCAN(X, eps, min_Pts):
k = -1
neighbor_list = [] # The neighborhood used to store each data
omega_list = [] # Core object collection
gama = set([x for x in range(len(X))]) # Initially mark all points as not accessed
cluster = [-1 for _ in range(len(X))] # clustering
for i in range(len(X)):
neighbor_list.append(find_neighbor(i, X, eps))
#Take the penultimate one for if. If it is greater than the set number of samples, it is the core point
if len(neighbor_list[-1]) >= min_Pts:
omega_list.append(i) # Add samples to the core object collection
omega_list = set(omega_list) # Convert to set for easy operation
while len(omega_list) > 0:
#Deep replication gama
gama_old = copy.deepcopy(gama)
j = random.choice(list(omega_list)) # Select a core object at random
#k count, starting from 0 for the first
k = k + 1
#Initialize Q
Q = list()
#Record access point
Q.append(j)
#Remove j from gama, no access points left
gama.remove(j)
while len(Q) > 0:
#The first point is assigned to q, and the q queue is output to q, first in, first out.
q = Q[0]
Q.remove(q)
if len(neighbor_list[q]) >= min_Pts:
#&Bitwise and operator: two values participating in the operation. If both corresponding bits are 1, the result of this bit is 1, otherwise it is 0
delta = neighbor_list[q] & gama
deltalist = list(delta)
for i in range(len(delta)):
#Add access point in Q
Q.append(deltalist[i])
#Remove access points from gama, no access points left
gama = gama - delta
#Original unreachable points - remaining unreachable points = access points
Ck = gama_old - gama
Cklist = list(Ck)
for i in range(len(Ck)):
#Type k
cluster[Cklist[i]] = k
#Remaining core points
omega_list = omega_list - Ck
return cluster
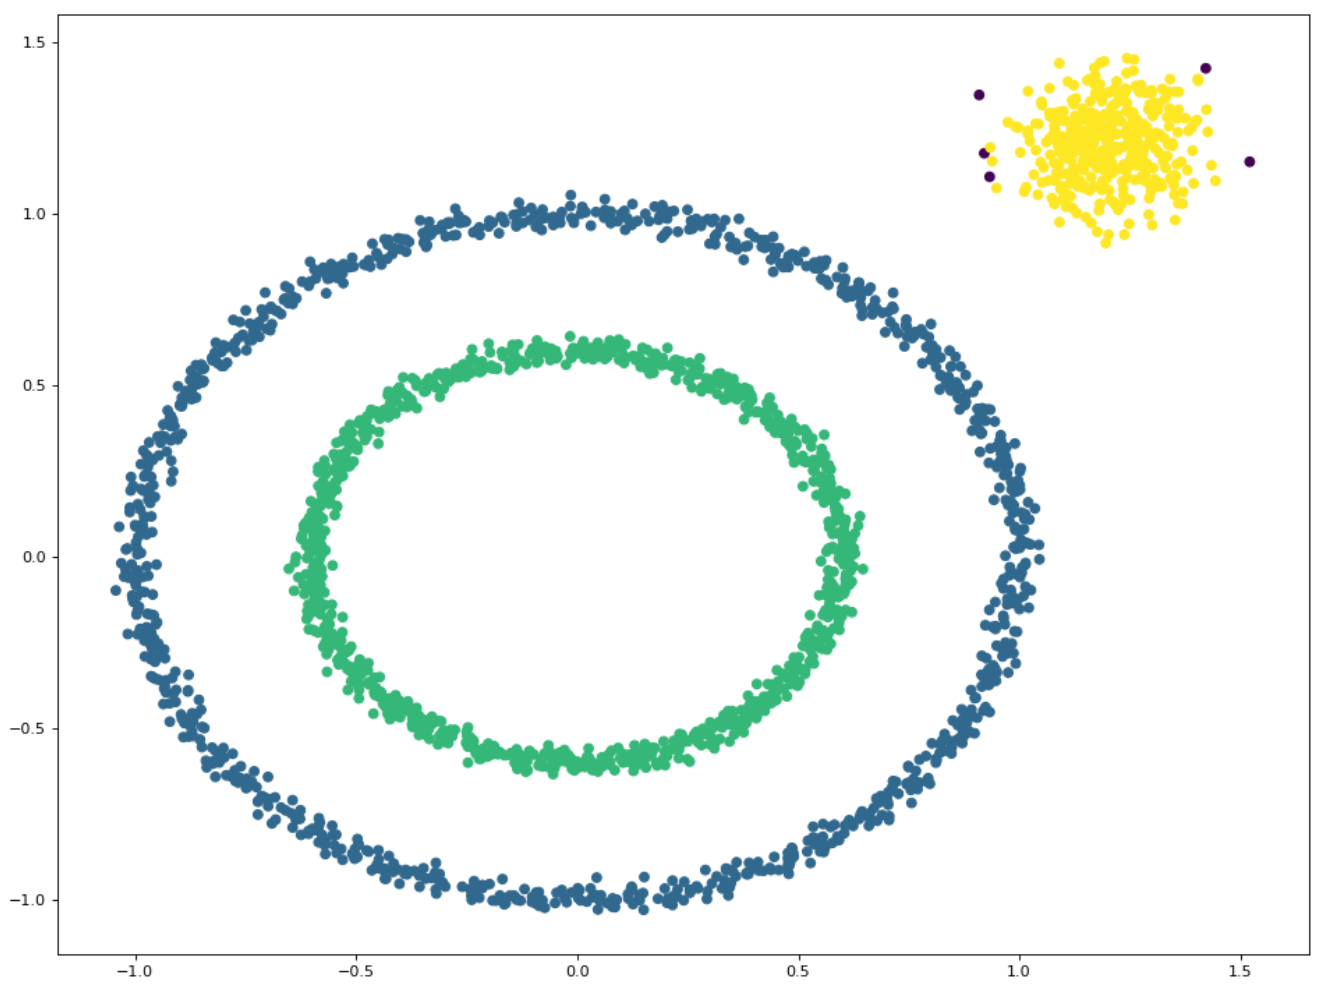
#Create a sample set of large circles containing smaller circles
X1, y1 = datasets.make_circles(n_samples=2000, factor=.6, noise=.02)
#Generate test data of clustering algorithm
X2, y2 = datasets.make_blobs(n_samples=400, n_features=2, centers=[[1.2, 1.2]], cluster_std=[[.1]], random_state=9)
X = np.concatenate((X1, X2))
#Radius judged as neighbor
eps = 0.08
#Number of samples judged as core points
min_Pts = 10
begin = time.time()
C = DBSCAN(X, eps, min_Pts)
end = time.time()-begin
plt.figure()
plt.scatter(X[:, 0], X[:, 1], c=C)
plt.show()
print(end)
print(X)Result diagram: