Data visualization
1.matplotlib
matplotlib is probably the most widely used suite in Python 2D drawing. It allows users to easily graph data and provide a variety of output formats. This will explore the common use of matplotlib.
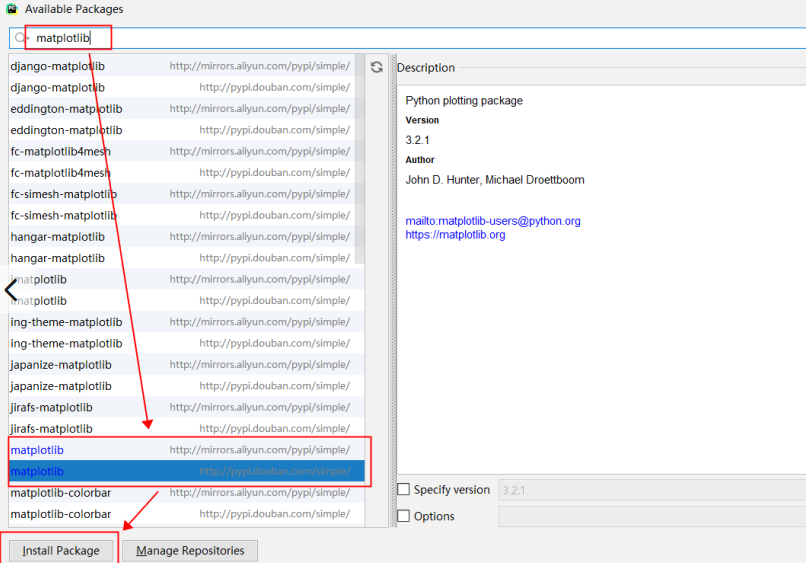
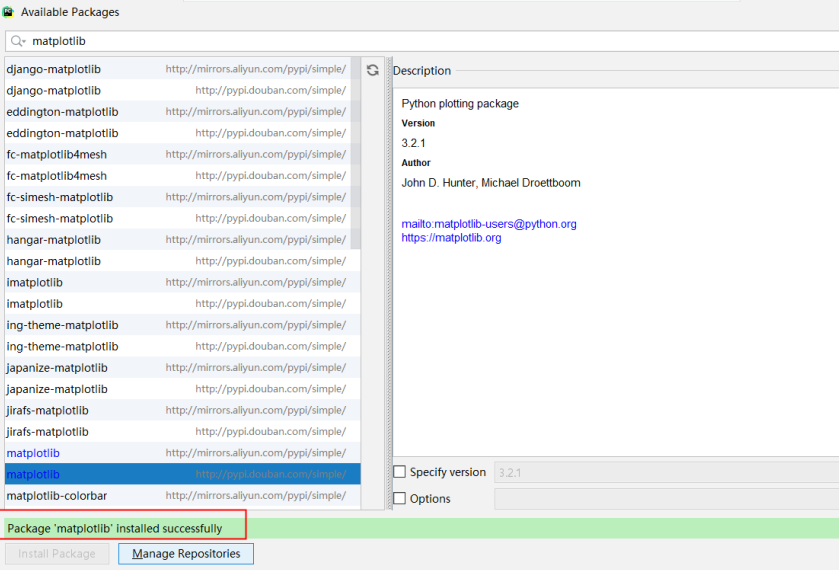
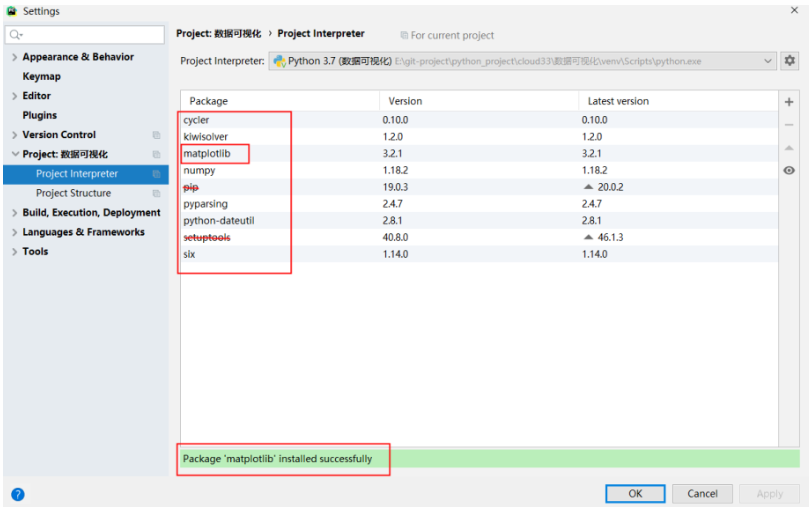
Install matplotib
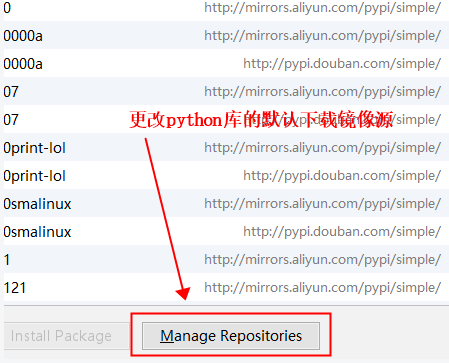
pip install -i https://pypi.douban.com/simple/ matplotlib
Test matplotib
$python
>>>import matplotlib
>>>
#If there is no error message output, the installation of matplotlib is successful.
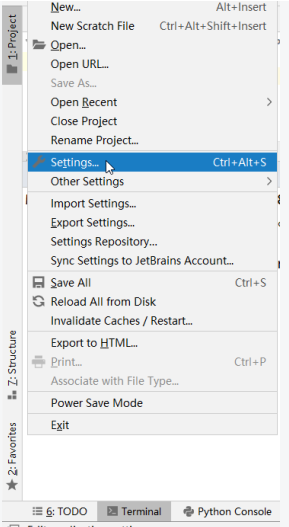
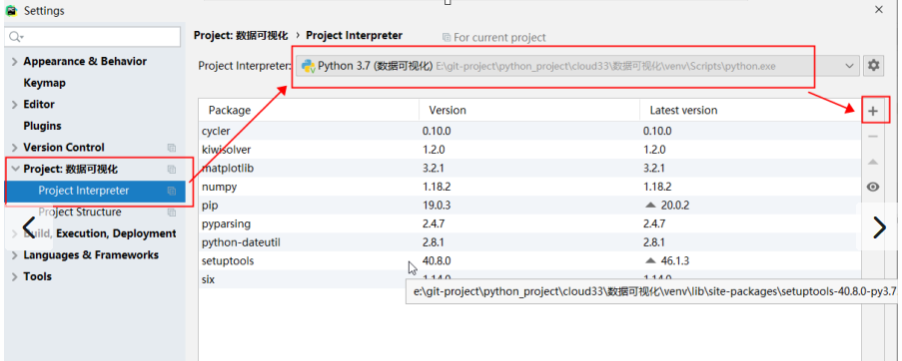
This may not be recognized by pyCharm. You can do the following

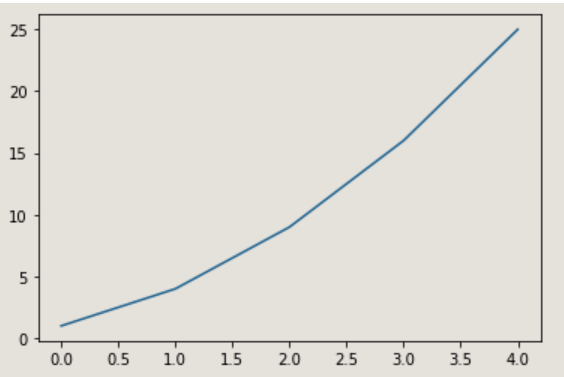
Example 1 (line)
import matplotlib.pyplot as plt
squares = [1,4,9,16,25]
plt.plot(squares)
plt.show()
Example 2 (line)
import matplotlib.pyplot as plt
squares = [1,4,9,16,25]

#Change the width of the line: linewidth
plt.plot(squares,linewidth=5)

#Set the title of the icon and label the axis
plt.title('queares number',fontsize=24)
plt.xlabel('value',fontsize=24)
plt.ylabel('quares value',fontsize=24)

# Set the scale mark size
plt.tick_params(axis="both",labelsize=14)

plt.show()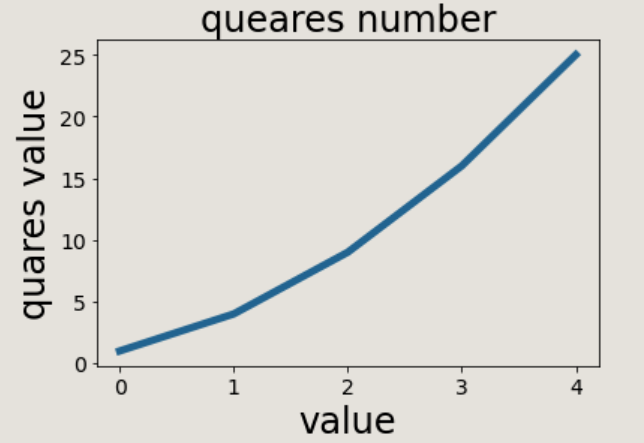
Example 3 (line)
import matplotlib.pyplot as plt

#Capture value
input_values = [1,2,3,4,5]
#Output value
squares = [1,4,9,16,25]

#Change the width of the line: linewidth
plt.plot(input_values,squares,linewidth=5)

#Set the title of the icon and label the axis
plt.title('queares number',fontsize=24)
plt.xlabel('value',fontsize=24)
plt.ylabel('quares value',fontsize=24)

# Set the scale mark size
plt.tick_params(axis="both",labelsize=14)

plt.show()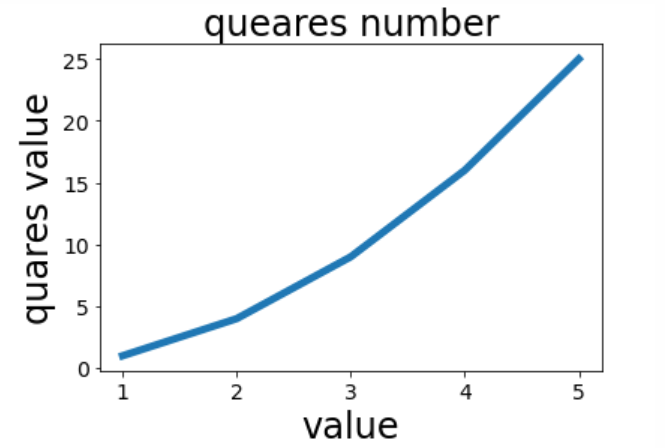
Example 4 (single point)
import matplotlib.pyplot as plt

plt.scatter(2,4)
plt.show()

Example 5 (single point)
import matplotlib.pyplot as plt

plt.scatter(2,4)

#Set icon title and label axis
plt.title('squares numbers',fontsize=24)
plt.xlabel('value',fontsize=24)
plt.ylabel('squares of value',fontsize=14)

# Set the scale mark size
plt.tick_params(axis="both",which='major',labelsize=14)

plt.show()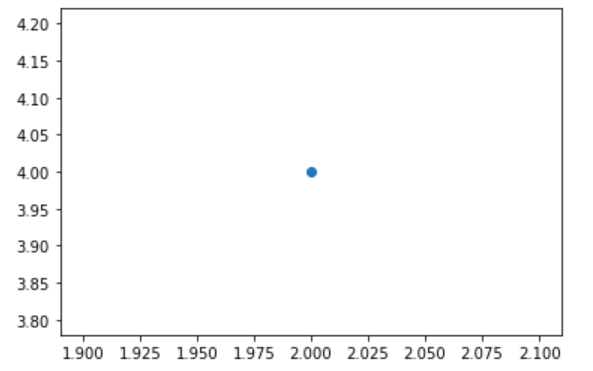
Example 6 (multipoint)
import matplotlib.pyplot as plt

x_values = [1,2,3,4,5]
y_values = [1,4,9,16,25]
plt.scatter(x_values,y_values,s=100)

#Set icon title and label axis
plt.title('squares numbers',fontsize=24)
plt.xlabel('value',fontsize=24)
plt.ylabel('squares of value',fontsize=14)

# Set the scale mark size
plt.tick_params(axis="both",which='major',labelsize=14)

plt.show()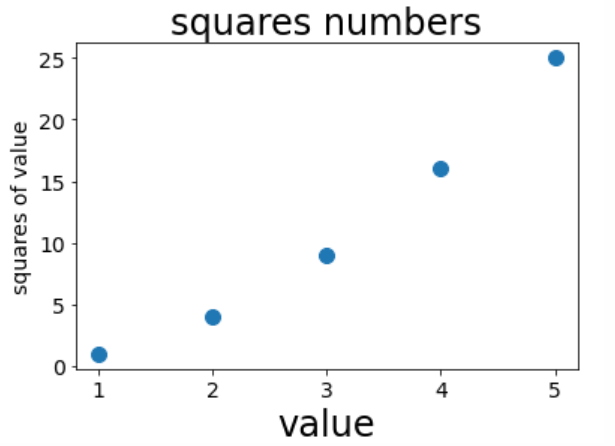
Example 7 (multipoint connection)
import matplotlib.pyplot as plt

x_values = list(range(1,1001))
y_values = [x ** 2 for x in x_values]
plt.scatter(x_values,y_values,s=100)

#Set icon title and label axis
plt.title('squares numbers',fontsize=24)
plt.xlabel('value',fontsize=24)
plt.ylabel('squares of value',fontsize=14)

# Set the scale mark size
plt.tick_params(axis="both",which='major',labelsize=14)

#Set the value range of each coordinate axis
plt.axis([0,1100,0,1100000])

plt.show()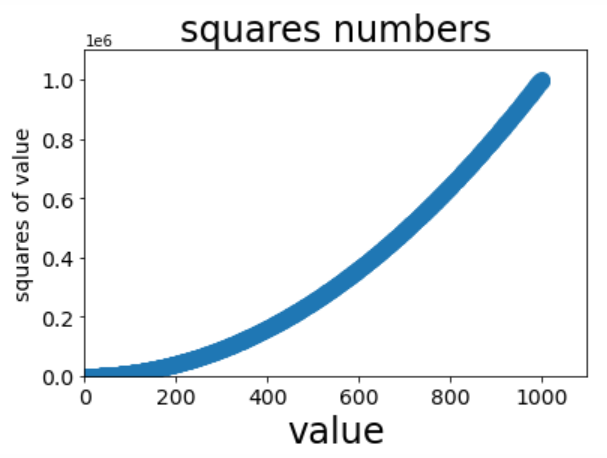
Analysis
Instance 8 (multipoint connection, custom color)
# Custom colors
import matplotlib.pyplot as plt

x_values = list(range(1,1001))
y_values = [x ** 2 for x in x_values]
plt.scatter(x_values,y_values,c='red',s=100)

#Set icon title and label axis
plt.title('squares numbers',fontsize=24)
plt.xlabel('value',fontsize=24)
plt.ylabel('squares of value',fontsize=14)

# Set the scale mark size
plt.tick_params(axis="both",which='major',labelsize=14)

#Set the value range of each coordinate axis
plt.axis([0,1100,0,1100000])

plt.show()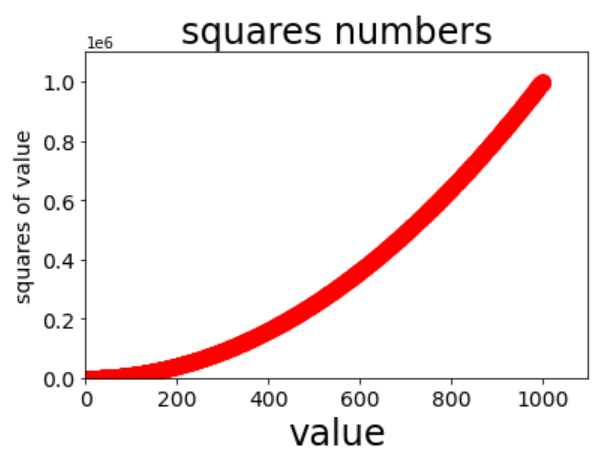
Example 9 (multipoint connection, custom color)
# Custom colors
import matplotlib.pyplot as plt

x_values = list(range(1,1001))
y_values = [x ** 2 for x in x_values]

#Parameter c represents the components of red, green and blue
plt.scatter(x_values,y_values,c=(0,0.5,0.2),s=100)

#Set icon title and label axis
plt.title('squares numbers',fontsize=24)
plt.xlabel('value',fontsize=24)
plt.ylabel('squares of value',fontsize=14)

# Set the scale mark size
plt.tick_params(axis="both",which='major',labelsize=14)

#Set the value range of each coordinate axis
plt.axis([0,1100,0,1100000])

plt.show()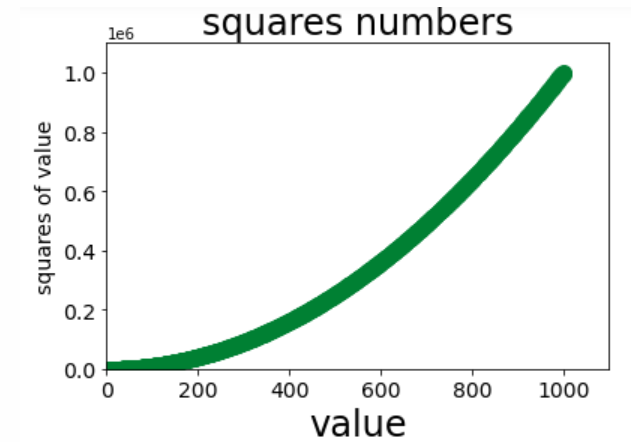
Example 10 (multi-point connection, custom color, gradient, save picture)
# Custom colors
import matplotlib.pyplot as plt
x_values = list(range(1,1001))
y_values = [x ** 2 for x in x_values]
# Set parameter c to a list of y values, and use parameter cmap to tell plot which color map to use
plt.scatter(x_values,y_values,c=y_values,cmap=plt.cm.Blues,s=100)
#Set icon title and label axis
plt.title('squares numbers',fontsize=24)
plt.xlabel('value',fontsize=24)
plt.ylabel('squares of value',fontsize=14)
# Set the scale mark size
plt.tick_params(axis="both",which='major',labelsize=14)
#Set the value range of each coordinate axis
plt.axis([0,1100,0,1100000])
# plt.show()
# Bbox includes ='tight '-- > subtracts the extra blank area of the chart
# Save the picture as squares1.png
plt.savefig('squares1.png',bbox_inches='tight') 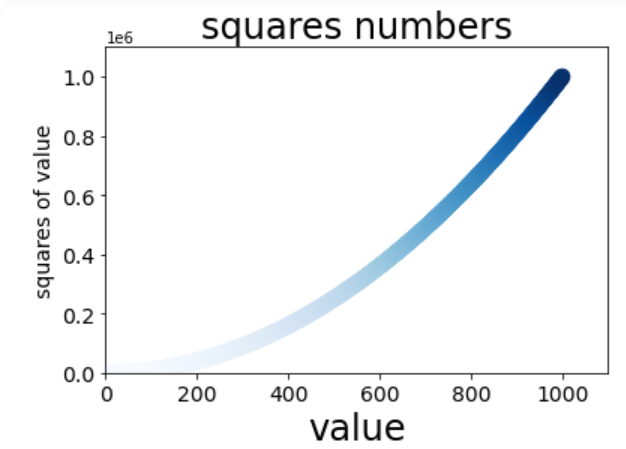
Example 11 (multipoint connection, custom color, gradient, save picture)
import matplotlib.pyplot as plt

# plt.scatter(2,4)
x_values = list(range(1, 1001))
y_values = [x ** 2 for x in x_values]
# plt.scatter(x_values, y_values,c='red', s=50)
## Parameter c represents the components of red, green and blue
# plt.scatter(x_values, y_values,c=(0,0.5,0.2), s=50)
## Set parameter c to a list of y values, and use parameter cmap to tell plot which color map to use
plt.scatter(x_values, y_values,c=y_values,cmap=plt.cm.Reds, s=50)

# Set icon title and label axis
plt.title('squares numbers', fontsize=24)
plt.xlabel('value', fontsize=24)
plt.ylabel('square of value', fontsize=14)

# Set mark size for scale
plt.tick_params(axis='both', which='major', labelsize=14)

# Set the value range of each coordinate axis
plt.axis([0,1100,0,1100000])

# plt.show()
# Save the picture as squares22.png
plt.savefig('squares22.png',bbox_inches='tight')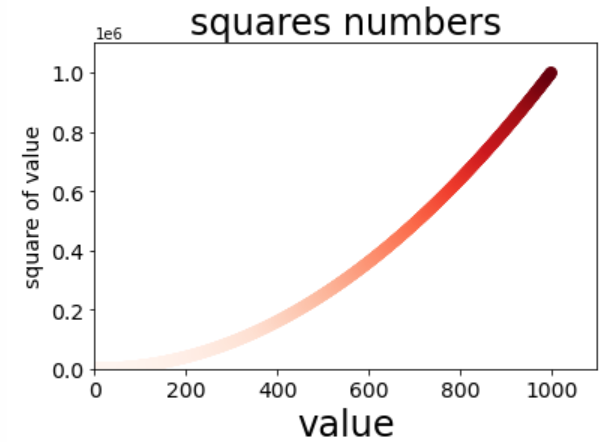
2. Random walk
# Random walk
from random import choice

class RandomWalk():
    """-Classes generating random walk data"""

    def __init__(self,num_points=5000):
        """Initialize random walk properties"""
        self.num_points = num_points

        # All random walks start at (0,0)
        self.x_values = [0]
        self.y_values = [0]

    def fill_walk(self):
        """Calculate all points included in random walk"""

        # Keep walking until the list reaches the specified length
        while len(self.x_values) < self.num_points:
            # Decide where to go and how far to go in this direction
            x_direction = choice([1,-1])
            x_distance = choice([0,1,2,3,4])
            x_step = x_direction * x_distance

            y_direction = choice([1,-1])
            y_distance = choice([0,1,2,3,4])
            y_step = y_direction * y_distance

            # Refuse to step in place
            if x_step == 0 and y_step ==0:
                continue

            # Calculate the values of x and y for the next point
            next_x =self.x_values[-1] + x_step
            next_y =self.y_values[-1] + y_step

            #
            # Keep walking until the list reaches the specified length
        while len(self.x_values) < self.num_points:
            # Decide where to go and how far to go in this direction
            x_direction = choice([1, -1])
            x_distance = choice([0, 1, 2, 3, 4])
            x_step = x_direction * x_distance

            y_direction = choice([1, -1])
            y_distance = choice([0, 1, 2, 3, 4])
            y_step = y_direction * y_distance

            # Never walk in the same place
            if x_step == 0 and y_step == 0:
                continue

            # Calculate the values of x and y for the next point
            next_x = self.x_values[-1] + x_step
            next_y = self.y_values[-1] + y_step

            #
            self.x_values.append(next_x)
            self.y_values.append(next_y)
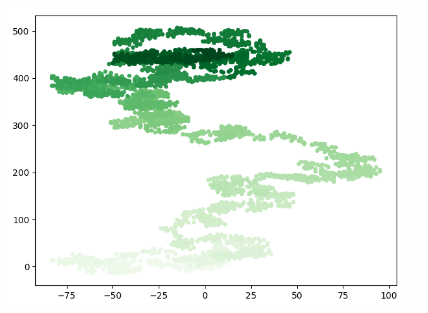
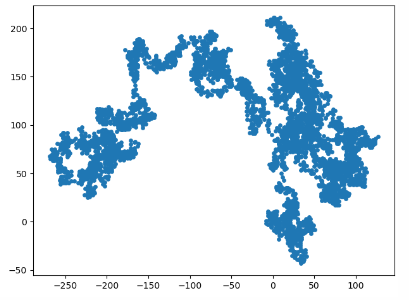
Example 1 (random walk, custom color)
import matplotlib.pyplot as plt
from Example.mpl_squares import RandomWalk

# Create a RandomWalk instance and draw all the included points
rw = RandomWalk()
rw.fill_walk()

# Point coloring
point_numbers = list(range(rw.num_points))
plt.scatter(rw.x_values, rw.y_values, c=point_numbers,cmap=plt.cm.Greens,s=15)

# Hidden border
# plt.axes().get_xaxis().set_visible(False)
# plt.axes().get_yaxis().set_visible(False)
plt.show()
Example 2 (random walk, continue to generate)
import matplotlib.pyplot as plt
from Example.mpl_squares import RandomWalk

while True:
    # Create a RandomWalk instance and draw all the included points
    rw = RandomWalk()
    rw.fill_walk()
    plt.scatter(rw.x_values, rw.y_values, s=15)

    # Hidden border
    # plt.axes().get_xaxis().set_visible(False)
    # plt.axes().get_yaxis().set_visible(False)

    plt.show()

    keep_running = input('Keep walking?(y/n)')
    if keep_running == 'n':
        break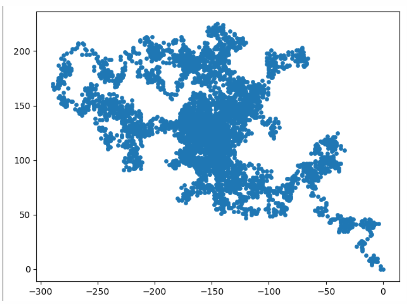
Output results:
Keep walking? (y/n) y
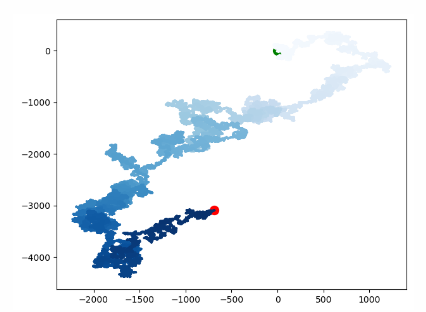
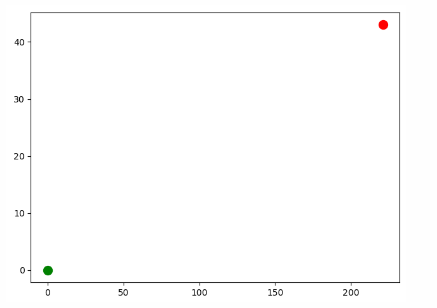
Example 3 (random walk, control points, distance between multiple points)
import matplotlib.pyplot as plt
from Example.mpl_squares import RandomWalk

# Create a RandomWalk instance and draw all the included points
rw = RandomWalk()
rw.fill_walk()

# Point coloring
point_numbers = list(range(rw.num_points))

plt.scatter(0,0,c='green',s=100)
plt.scatter(rw.x_values[-1],rw.y_values[-1],c='red',s=100)

# plt.scatter(rw.x_values, rw.y_values, c=point_numbers,cmap=plt.cm.Greens,s=15)

# Hidden border
# plt.axes().get_xaxis().set_visible(False)
# plt.axes().get_yaxis().set_visible(False)
plt.show()
Example 4 (random walk, control points (control the distance between multiple points) + custom points)
import matplotlib.pyplot as plt
from Example.mpl_squares import RandomWalk

# Create a RandomWalk instance and draw all the included points
rw = RandomWalk(500000)
rw.fill_walk()

# Point coloring
point_numbers = list(range(rw.num_points))

plt.scatter(0,0,c='green',s=100)
plt.scatter(rw.x_values[-1],rw.y_values[-1],c='red',s=100)
plt.scatter(rw.x_values, rw.y_values, c=point_numbers,cmap=plt.cm.Blues,s=1)

# Hidden border
# plt.axes().get_xaxis().set_visible(False)
# plt.axes().get_yaxis().set_visible(False)

plt.figure(dpi=128, figsize=(10,6))
plt.show()