This paper mainly summarizes the functions and methods used in learning pandas, and records them here to prevent forgetting.
Python Data Analysis--Pandas Knowledge Points (1)
The following will be a summary on the basis of knowledge point one.
13. Simple calculation
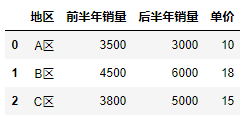
Create a new data table df
1 import pandas as pd
2
3 df = pd.DataFrame({"region": ["A area","B area", "C area"],
4                    "Sales in the first half of the year": [3500, 4500,3800],
5                    "Sales in the latter half of the year": [3000, 6000,5000],
6                    "Unit Price": [10, 18, 15]})
7 df
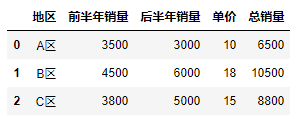
13.1 Additive calculation
There are two ways, one is to use the add() function: a.add(b) to represent the sum of a and b, the other is to use the addition symbol "+" directly.
1 #The first way: utilize add()function
2 # df["Total sales volume"] = df["Sales in the first half of the year"].add(df["Sales in the latter half of the year"])
3 #The second way: "+"
4 df["Total sales volume"] = df["Sales in the first half of the year"] + df["Sales in the latter half of the year"]
5 df
The results of both operations are the same:

For the cumulative sum and the above two methods are also applicable, there is another way to use the apply() function, reference documents: https://blog.csdn.net/luckarecs/article/details/72869051
Here we introduce two parameters of the apply(func, axis = 0) function. The official documentation of the apply() function is as follows: http://pandas.pydata.org/pandas-docs/stable/generated/pandas.DataFrame.apply.html?highlight=apply#pandas.DataFrame.apply
The first parameter, func, is a function for each row or column. The lambda function is used here: it receives any number of parameters and returns a single calculation result.
The second parameter axis=0 denotes the data for calculating rows and rows, and axis=1 denotes the data for calculating columns and columns.
1 #Because the region can't participate in the calculation, So in df1 Delete areas in data tables
2 df1 = df.drop(["region","Unit Price"], axis = 1, inplace = False)
3 #Yes df1 Data table for cumulative operation, Subsequently added df In the table.
4 df["Total sales volume"] = df1.apply(lambda x: x.sum(), axis = 1)
5 df
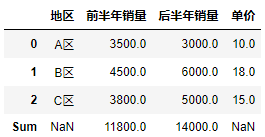
1 #Delete area and unit price,The total of three regions in the first half year and the second half year are calculated respectively..
2 df2 = df.drop(["region","Unit Price"], axis = 1, inplace = False)
3 #utilize apply After calculating the function,Add to Data Table
4 df.loc["Sum"] = df2.apply(lambda x: x.sum(), axis = 0 )
5 df
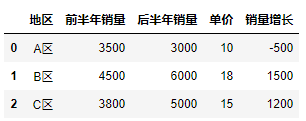
13.2 subtraction operation
There are also two ways: one is to use the sub() function, the other is to use the subtraction operator "-".
1 #Function method: Be careful A.sub(B)Express A-B
2 df["Sales growth"] = df["Sales in the latter half of the year"].sub(df["Sales in the first half of the year"])
3 #operator: "-"
4 df["Sales growth"] = df["Sales in the latter half of the year"] - df["Sales in the first half of the year"]
5 df
Two ways, the same result:
13.3 Multiplication
There are also two ways: one is to use mul() function: A.mul(B) to express the product of A and B, the other is the multiplication operator "*"
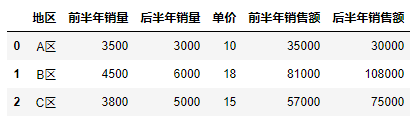
1 #Function method: A.mul(B)
2 df["Sales in the first half of the year"] = df["Sales in the first half of the year"].mul(df["Unit Price"])
3 #operator: "*"
4 df["Sales in the latter half of the year"] = df["Sales in the latter half of the year"] * df["Unit Price"]
5 df
13.4 Division
There are also two kinds: one is to use the div() function: A.div(B) to express: A divided by B, and the other is to use the division operator "/".
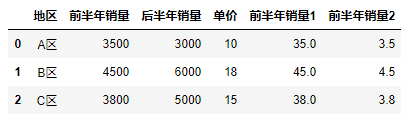
1 #Function method
2 df["Sales in the first half of the year 1"] = df["Sales in the first half of the year"].div(100)
3 #Operator method
4 df["Sales in the first half of the year 2"] = df["Sales in the first half of the year"] / 1000
5 df
13.5 Other operations
13.5.1 Integration and Remaining
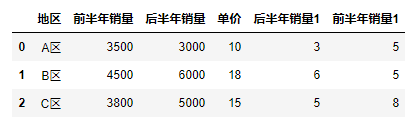
1 #Rounding symbol: "//"
2 df["Sales in the latter half of the year 1"] = df["Sales in the latter half of the year"] // 1000
3 #Redundancy symbol: "%"
4 df["Sales in the first half of the year 1"] = df["Sales in the first half of the year"] // 100 % 10
5 df
13.5.2 Aggregation Operations
An aggregate function is used to calculate a set of data and return a single value, such as max() function, min() function and mean() function.
1 #Finding the Maximum Sales in the First Half Year
2 df1 = df["Sales in the first half of the year"].max()
3 #Find the Minimum Sales in the Later Half Year
4 df2 = df["Sales in the latter half of the year"].min()
5 #Finding the Mean Value of Unit Price
6 df3 = df["Unit Price"].mean()
7 df1, df2 ,df3
(4500, 3000, 14.333333333333334)
14.0-1 standardization
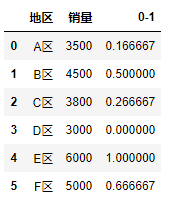
0-1 standardization is a linear transformation of the original data to map its results to the values of the [0,1] interval. The calculation formula is: new data = (original data-minimum) / (maximum-minimum)
1 import pandas as pd
2 df = pd.DataFrame({"region": ["A area","B area", "C area", "D area", "E area", "F area"],
3                    "Sales volume": [3500, 4500,3800,3000, 6000,5000]})
4 #Using the formula, the original data is 0.-1 Standardized Processing
5 df["0-1"] = (df["Sales volume"] - df["Sales volume"].min()) / (df["Sales volume"].max() - df["Sales volume"].min())
6 df
15. Data grouping
Data grouping is to divide the original data into different groups according to a certain standard according to the needs of statistical research. The main purpose is to observe the distribution characteristics of data. After grouping data, the frequency of data in each group is calculated, and finally the frequency distribution table is formed.
The functions used for data grouping in pandas are cut(x, bins, right = True, labels = None):
The first parameter x refers to the data to be grouped
The second parameter, bins, refers to the criteria for partitioning, i.e. the upper and lower bounds for defining groups.
The third parameter, right = True, denotes right closed and left unclosed; when right = False, it denotes right unclosed and left closed, defaulting to True.
The fourth parameter is the content of the custom grouping
More cut() functions refer to official documentation: http://pandas.pydata.org/pandas-docs/stable/generated/pandas.cut.html?highlight=cut#pandas.cut
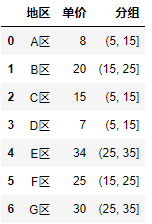
1 import pandas as pd
2 df = pd.DataFrame({"region": ["A area","B area", "C area", "D area", "E area", "F area", "G area"],
3                    "Unit Price": [ 8 , 20, 15, 7, 34, 25, 30]})
4 #Group unit prices: (5,15),(15,25),(25,35)
5 bins = [5, 15, 25, 35]
6 #utilize cut()Functions grouping unit prices, And add it to the original data table
7 df["Grouping"] = pd.cut(df.Unit Price, bins)
8 df
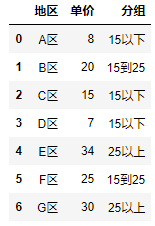
Custom labels:
1 import pandas as pd
2 df = pd.DataFrame({"region": ["A area","B area", "C area", "D area", "E area", "F area", "G area"],
3                    "Unit Price": [ 8 , 20, 15, 7, 34, 25, 30]})
4 bins = [5, 15, 25, 35]
5 #custom labels
6 labels = ["15 Following", "15 To 25", "25 Above"]
7 df["Grouping"] = pd.cut(df.Unit Price, bins, labels = labels)
8 df
16. Date Conversion
Date conversion refers to the conversion of character types to date formats.
16.1 to_datetime method
You can use to_datetime(arg, format = None) function transformation
The first parameter arg is a string that needs to be converted, such as "2018/09/01"
The second parameter format is the format of the date in the original string, such as the format of "2018/09/01" is "% Y/%m/%d".
Commonly used formats are:% y denotes two-digit years,% Y denotes four-digit years,% m denotes months,% d denotes a day in a month,% H denotes 24-hour hours,% I denotes 12-hour hours,% M denotes minutes,% S denotes seconds.
to_datetime() function official documentation: http://pandas.pydata.org/pandas-docs/stable/generated/pandas.to_datetime.html?highlight=to_datetime#pandas.to_datetime
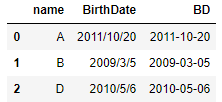
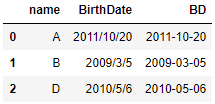
1 import pandas as pd
2 df = pd.DataFrame({"name":["A","B","D"],
3                   "BirthDate": ["2011/10/20","2009/3/5","2010/5/6"]})
4 #Convert to date format
5 df["BD"] = pd.to_datetime(df.BirthDate,format = "%Y/%m/%d")
6 df
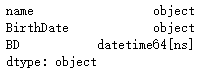
1 #View data types
2 df.dtypes
16.2 datetime.strptime() method
With the help of the datetime class in the datetime module strptime() Method to convert character type to date format.
There are two parameters in the strptime(date_string, format) method. The first parameter is the string to be converted, and the second parameter is the format of the date in the string.
1 import pandas as pd
2 from datetime import datetime
3 df = pd.DataFrame({"name":["A","B","D"],
4                   "BirthDate": ["2011/10/20","2009/3/5","2010/5/6"]})
5 #Convert to date format
6 df["BD"] = df["BirthDate"].apply(lambda x: datetime.strptime(x, "%Y/%m/%d"))
7 df
17. Date formatting
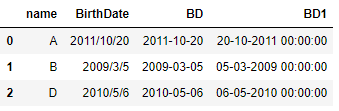
Date formatting is to output the date as a character type according to the specified format, here with the help of the datetime class in the datetime module. strftime() Method realization:
1 import pandas as pd
2 from datetime import datetime
3 df = pd.DataFrame({"name":["A","B","D"],
4                   "BirthDate": ["2011/10/20","2009/3/5","2010/5/6"]})
5 #Convert to date format
6 df["BD"] = df["BirthDate"].apply(lambda x: datetime.strptime(x, "%Y/%m/%d"))
7 #DateFormatter
8 df["BD1"] = df["BD"].apply(lambda x: datetime.strftime(x, "%d-%m-%Y %H:%M:%S"))
9 df
18. Date extraction
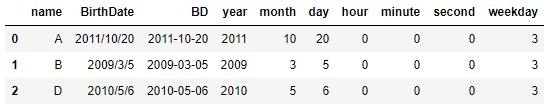
Extract part of the date from the date format, such as year, month, etc. Grammar: Column converted to date format. dt. Attributes to be extracted.
 1 import pandas as pd
 2 from datetime import datetime
 3 df = pd.DataFrame({"name":["A","B","D"],
 4                   "BirthDate": ["2011/10/20","2009/3/5","2010/5/6"]})
 5 df["BD"] = df["BirthDate"].apply(lambda x: datetime.strptime(x, "%Y/%m/%d"))
 6 df["year"] = df["BD"].dt.year
 7 df["month"] = df["BD"].dt.month
 8 df["day"] = df["BD"].dt.day
 9 df["hour"] = df["BD"].dt.hour
10 df["minute"] = df["BD"].dt.minute
11 df["second"] = df["BD"].dt.second
12 df["weekday"] = df["BD"].dt.weekday
13 df
The above is the summary of this study, which will be updated continuously in the future.