- Original author: brain in new VAT
- Article link: https://www.toutiao.com/i7028498316396839432/?tt_ from=weixin&utm_ campaign=client_ share&wxshare_ count=1×tamp=1638613017&app=news_ article&utm_ source=weixin&utm_ medium=toutiao_ ios&use_ new_ style=1&req_ id=2021120418165701015015608914163D60&share_ token=01C2E436-7124-40A6-B871-E04C0656CE78&group_ id=7028498316396839432
Monte Carlo simulation (or probabilistic simulation) is a technology used to understand the impact of financial sector risks and uncertainties, project management, costs and other predictive machine learning models.
Risk analysis is part of almost every decision we make, because we often face uncertainty, fuzziness and variability in life. In addition, even if we have unprecedented information, we can't accurately predict the future.
Monte Carlo simulation enables us to see all possible results and evaluate the risk impact, thus allowing better decision-making under uncertainty.
In this article, we will understand the Monte Carlo simulation method through five different examples. The code for this tutorial can be found on Github and Google Colab.
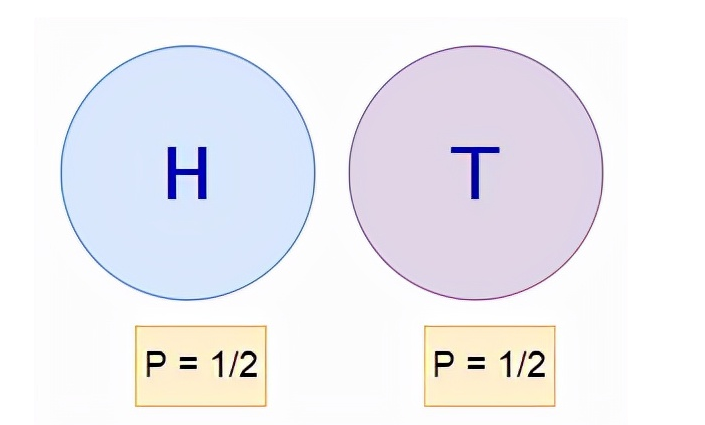
1. Coin flip example
The probability of tossing an unbiased coin face up is 1 / 2. However, is there any way we can prove it experimentally? In this example, we will use the Monte Carlo method to simulate 5000 coin tosses to find out why the probability of facing up is always 1 / 2. If we flip this coin many, many times, we can achieve higher accuracy.
## Import library
import random
import numpy as np
import matplotlib.pyplot as plt
## Coin function
def coin_filp():

    return random.randint(0,1) # Generate 01 random number
## Monte Carlo Simulation

prob_list1 = [] # An empty list stores probability values

def monte_carlo(n):
    """
    n Is the number of simulations
    """
    results = 0
    for i in range(n):
        flip_result = coin_filp()
        results =results + flip_result

        # Calculating probability value
        prob_value = results/(i+1)

        # append the probability values to the list
        prob_list1.append(prob_value)

        # plot the results
        plt.axhline(y = 0.5,color = 'red',linestyle='-')
        plt.xlabel('Iterations')
        plt.ylabel('Probability')
        plt.plot(prob_list1)

    return results/n
# calling the function

answer = monte_carlo(5000)
print('Final value:',answer)
Final value: 0.4968
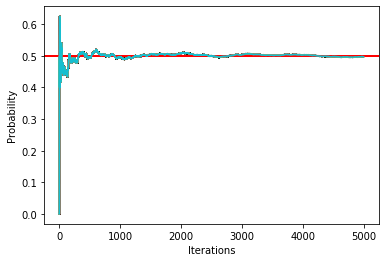
As shown in the figure above, after 5000 iterations, the probability of positive upward is 0.502. Therefore, this is how we use Monte Carlo simulation to find the probability value.
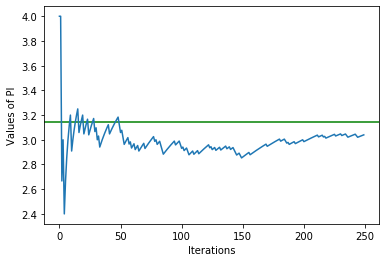
2. Estimates Π (pi)
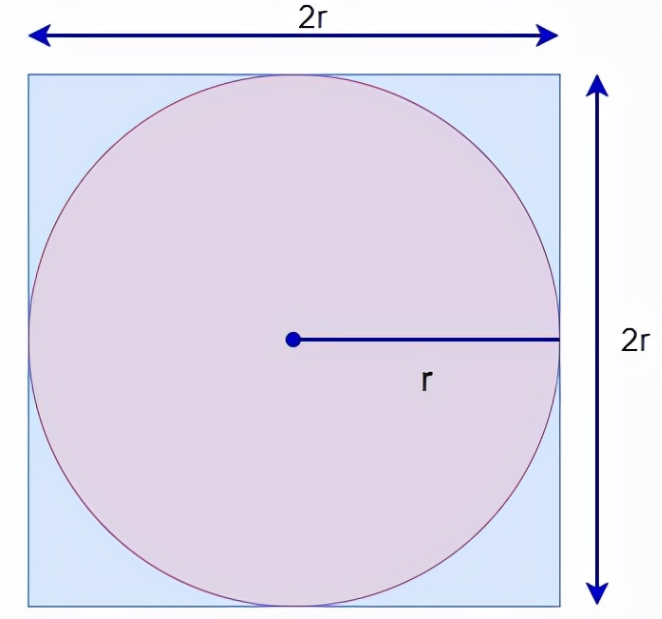
To estimate the value of PI, we need the square and the area of the circle. To find these areas, we will randomly place points on the surface and calculate the points that fall in the circle and the points that fall in the square. This will give us an estimate of their area. Therefore, we will use the point count as the area instead of the size of the actual area.
## Import library
import turtle
import random
import matplotlib.pyplot as plt
import math
## Draw point
# to visualize the random points
mypen = turtle.Turtle()
mypen.hideturtle()
mypen.speed(0)

# drawing a square
mypen.up()
mypen.setposition(-100,-100)
mypen.down()
mypen.fd(200)
mypen.left(90)
mypen.fd(200)
mypen.left(90)
mypen.fd(200)
mypen.left(90)
mypen.fd(200)
mypen.left(90)

# drawing a circle
mypen.up()
mypen.setposition(0,-100)
mypen.down()
mypen.circle(100)
# Initialization data
# to count the points inside and outside the circle
in_circle = 0
out_circle = 0

# to store the values of the PI
pi_values = []
# Main function
# running for 5 times
for i in range(5):
for j in range(50):
# generate random numbers
x = random.randrange(-100,100)
y = random.randrange(-100,100)
# check if the number lies outside the circle
if (x**2+y**2>100**2):
mypen.color('black')
mypen.up()
mypen.goto(x,y)
mypen.down()
mypen.dot()
out_circle = out_circle + 1
else:
mypen.color('red')
mypen.up()
mypen.goto(x,y)
mypen.down()
mypen.dot()
in_circle = in_circle + 1
# calculating the value of PI
pi = 4.0 * in_circle/(in_circle + out_circle)
# append the values of PI in list
pi_values.append(pi)
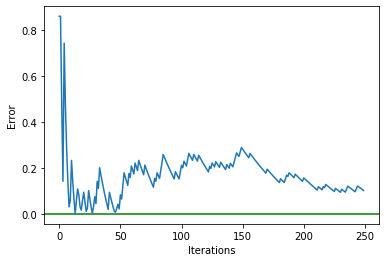
# Calculating the errors
avg_pi_errors = [abs(math.pi - pi) for pi in pi_values]
# Print the final values of PI for each iterations
print(pi_values[-1])
3.12
2.96
2.8533333333333335
3.0
3.04
# Draw image
# Plot the PI values
plt.axhline(y=math.pi,color='g',linestyle='-')
plt.plot(pi_values)
plt.xlabel('Iterations')
plt.ylabel('Values of PI')
plt.show()
plt.axhline(y = 0.0,color = 'g',linestyle='-')
plt.plot(avg_pi_errors)
plt.xlabel('Iterations')
plt.ylabel('Error')
plt.show()
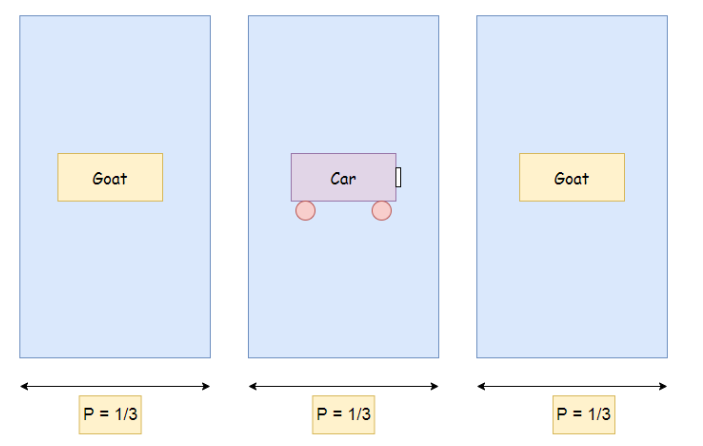
Monty Hall problem
Suppose in a game program, you can choose one of three doors: behind a door is a car; Behind the other doors are goats. You pick a door, for example, door 1. The host knows what is behind the door. Open another door, for example, door 3. There is a goat. The host then asks you: do you want to stick to your choice or choose another door?
Is it good for you to change doors?
According to the probability, it's good for us to change the door. Let's understand:
Initially, the probability of obtaining a car (P) was the same for all three doors (P = 1/3).
Now suppose the contestant chooses door 1. Then the host opened the third door. There was a goat behind the door. Next, the host asked the contestants if they wanted to change doors?
We'll see why it's better to change doors:
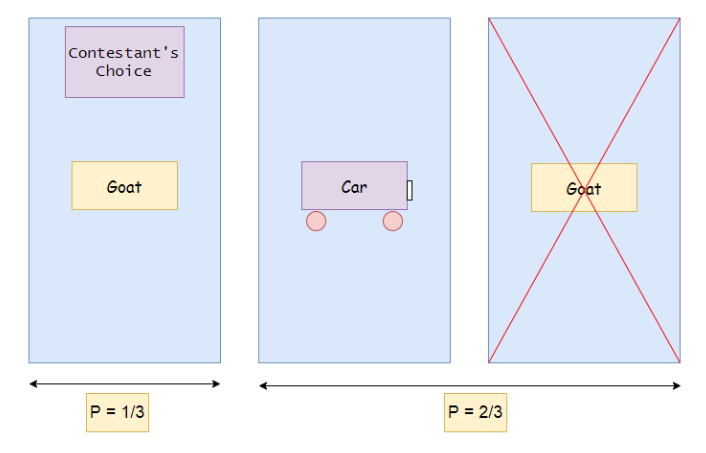
In the above figure, we can see that after the host opens door 3, the probability of owning a car at both doors increases to 2 / 3. Now we know that the probability of goat on the third door and car on the second door has increased to 2 / 3. Therefore, it is more advantageous to change the door.
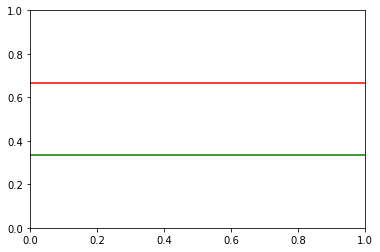
## Import library
import random
import matplotlib.pyplot as plt
## Initialization data
# 1 = car
# 2 = goat
doors = ['goat','goat','car']

switch_win_probability = []
stick_win_probability = []

plt.axhline(y = 0.66666,color = 'r',linestyle='-')
plt.axhline(y = 0.33333,color = 'g',linestyle='-')
<matplotlib.lines.Line2D at 0x205f5578648>
import random
import matplotlib.pyplot as plt
## Initialization data
# 1 = car
# 2 = goat
doors = ['goat','goat','car']

switch_win_probability = []
stick_win_probability = []


# monte carlo simulation

def monte_carlo(n):

    # calculating switch and stick wins:
    switch_wins = 0
    stick_wins = 0

    for i in range(n):
        # randomly placing the car and goats behind three doors
        random.shuffle(doors)

        # contestant's choice
        k = random.randrange(2)

        # If the contestant doesn't get car
        if doors[k] != 'car':
            switch_wins += 1
        else:
            stick_wins += 1

        # updatating the list values
        switch_win_probability.append(switch_wins/(i+1))
        stick_win_probability.append(stick_wins/(i+1))

        # plotting the data
        plt.plot(switch_win_probability)
        plt.plot(stick_win_probability)

    # print the probability values
    print('Winning probability if you always switch',switch_win_probability[-1])
    print('Winning probability if you always stick to your original choice:',stick_win_probability[-1])
[the external chain picture transfer fails. The source station may have an anti-theft chain mechanism. It is recommended to save the picture and upload it directly (img-q0oAMCrF-1638621844579)(output_30_0.png)]
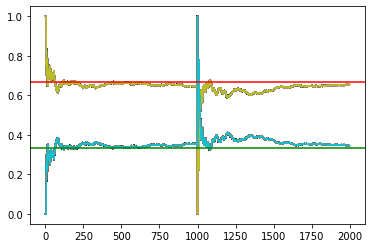
monte_carlo(1000)
plt.axhline(y = 0.66666,color = 'r',linestyle='-')
plt.axhline(y = 0.33333,color = 'g',linestyle='-')
Winning probability if you always switch 0.655
Winning probability if you always stick to your original choice: 0.345


<matplotlib.lines.Line2D at 0x205f40976c8>
4. Buffon's need problem
Buffon, a French aristocrat, issued the following questions in 1777:
Suppose we throw a short needle on a piece of scribing paper - how likely is it that the needle just crosses the line?
The probability depends on the distance between the lines on the paper (d), the length of the needle we throw (l), or more precisely, the ratio l/d. For this example, we can consider the needle l ≤ D. In short, our purpose is to assume that the needle cannot cross two different lines at the same time. Surprisingly, the answer to this question involves PI.
import random
import matplotlib.pyplot as plt
import math
def monte_carlo(runs,needles,n_lenth,b_width):
# Empty list to store pi values:
pi_values = []
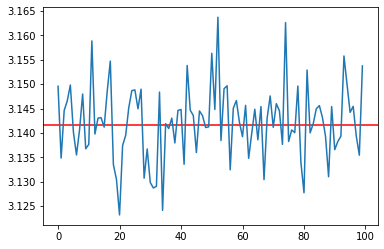
# Horizontal line for actual value of PI
plt.axhline(y=math.pi,color = 'r',linestyle='-')
# For all runs:
for i in range(runs):
# Initialize number of hits as 0
nhits = 0
# For all needles
for j in range(needles):
# We will find the distance from the nearest vertical line
# min = 0,max = b_width/2
x = random.uniform(0,b_width/2.0)
# The theta value will be from 0 to pi/2
theta = random.uniform(0,math.pi/2)
# checking if the needle crosses the line or not
xtip = x - (n_lenth/2.0)*math.cos(theta)
if xtip < 0 :
nhits += 1
# Going with the formula
numerator = 2.0 * n_lenth * needles
denominator = b_width * nhits
# Append the final value of pi
pi_values.append((numerator/denominator))
# Final pi value after all iterations
print(pi_values[-1])
# Plotting the graph:
plt.plot(pi_values)
# Total number of runs
runs = 100
# Total number of needles
needles = 100000
# Length of needle
n_lenth = 2
# space between 2 verical lines
b_width = 2
# Calling the main function
monte_carlo(runs,needles,n_lenth,b_width)
3.153728495513821
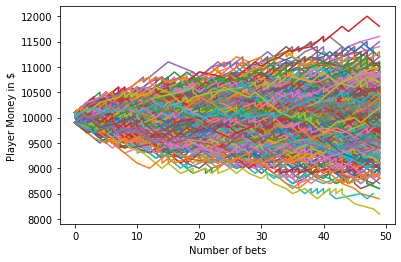
5. Why do dealers always win?
How do casinos make money? The trick is simple - "the more you play, the more the casino makes. Let's see how it works through a simple Monte Carlo simulation example.
Considering a hypothetical game, players must choose a chip from a bag of chips.
Rules:
- There are 1 ~ 100 chips in the bag.
- Users can bet on an even or odd number of chips.
- In this game, 10 and 11 are special numbers. If we bet on an even number, 10 will count as an odd number, and if we bet on an odd number, 11 will count as an even number.
- If we bet on an even number and we get 10, then we lose.
- If we bet on an odd number and we get 11, we lose.
If we bet on an odd number, our probability of winning is 49 / 100. The dealer's probability of winning is 51 / 100. Therefore, for an odd number bet, the dealer's profit is = 51 / 100 - 49 / 100 = 200 / 10000 = 0.02 = 2%
If we bet on an even number, the user's probability of winning is 49 / 100. The dealer's probability of winning is 51 / 100. Therefore, for an even number bet, the dealer's profit is = 51 / 100-49 / 100 = 200 / 10000 = 0.02 = 2%
In short, for every $1 bet, $0.02 belongs to the dealer. In contrast, the minimum profit of roulette dealer is 2.5%. Therefore, we are sure that you are more likely to win in a hypothetical game than roulette.
import random
import matplotlib.pyplot as plt


# Place your bet:
# User can choose even or odd number
choice = input("Don you want to bet on Even number or odd number\n")

# For even
if choice =='Even':
    def pickNote():
        # get random number between 1-100
        note = random.randint(1,100)

        # check for our game conditions
        # Notice that 10 isn't considered as even number
        if note%2 != 0 or note == 10:
            return False
        elif note%2 ==0:
            return True

# For odd
elif choice =='Odd':
    def pickNote():
        # get random number between 1-100
        note = random.randint(1,100)

        # check for our game conditions
        # Notice that 10 isn't considered as even number
        if note%2 == 0 or note == 11:
            return False
        elif note%2 == 1:
            return True
Don you want to bet on Even number or odd number
Odd
# Main function
def play(total_money ,bet_money,total_plays):

    num_of_plays = []
    money = []

    # start with play number 1
    play = 1

    for play in range(total_plays):
        # Win
        if pickNote():
            # Add the money to our funds
            total_money = total_money + bet_money
            # append the play number
            num_of_plays.append(play)
            # append the new fund amout
            money.append(total_money)
        # Lose
        if pickNote():
            # Add the money to our funds
            total_money = total_money - bet_money
            # append the play number
            num_of_plays.append(play)
            # append the new fund amout
            money.append(total_money)
        # Plot the data
    plt.ylabel('Player Money in $')
    plt.xlabel('Number of bets')
    plt.plot(num_of_plays,money)
    final_funds = []
        # Final values after all the iterations
    final_funds.append(money[-1])
    return( final_funds)
 # Run 10 time
    # Modify the number of times here
for i in range(1000):
    ending_fund = play(10000,100,50)
print(ending_fund)
print(sum(ending_fund))

# print the money the player ends with
print('The player started with $10,000')
print('The player left with $',str(sum(ending_fund)/len(ending_fund)))
[10400]
10400
The player started with $10,000
The player left with $ 10400.0