Reptile thinking
The first step is to get the data we need
Tencent, Netease, clove doctor and other platforms have real-time data of the epidemic. After crawling the data of each platform, it is found that the data returned by Dr. lilac is static. If you want to crawl in Tencent and Netease, you need to use some functions of selenium library to crawl, which is more troublesome. So I chose the simple clove. Using requests + beautifulsop to crawl data
def get_one_page(url):
    try:
        headers = {
            'User-Agent': 'Mozilla/5.0 (Windows NT 6.1; WOW64) AppleWebKit/537.36 (KHTML, like Gecko) Chrome/64.0.3282.119 Safari/537.36'}
        response = requests.get(url,headers=headers)
        response.encoding = 'utf-8' #Specify utf-8 encoding format here or garbled
        if response.status_code == 200:
            soup = BeautifulSoup(response.text, "html.parser")
            return soup
        return None
    except RequestException:
        return None
Step 2 data processing
After crawling to the html code of the web page containing the data we want, we can analyze it and further extract the data we want (city, number of confirmed cases, number of deaths, number of cures, etc.)
def main():
    url = 'https://ncov.dxy.cn/ncovh5/view/pneumonia'
    soup = get_one_page(url)
    #Use regular matching and search for content with id getAreaStat in script tag
    information = re.search(r'\[(.*)\]', str(soup.find('script', attrs={'id': 'getAreaStat'})))
    information = json.loads(information.group(0))#Turn to list
    data = [] #For data visualization and map drawing
    lists = [] #Export csv statistics all data
    #The specific data format obtained is roughly as follows
    #{'cityName': 'Wuhan', 'currentconfirmedcount': 30042, 'confirmedcount': 32994, 'anticipated count': 0, 'currentcount': 1916, 'deadcount': 1036, 'locationid': 420100}
    for area in information:
        data.append([area['provinceShortName'], area['confirmedCount']])
        for city in area['cities']:
            lists.append([city['cityName'],city['currentConfirmedCount'],city['confirmedCount'],city['suspectedCount'],city['curedCount'],city['deadCount']])
    save_data_as_csv('covid_Excel', lists)
    print(data)
    echarts(data)
Step 3 data persistence
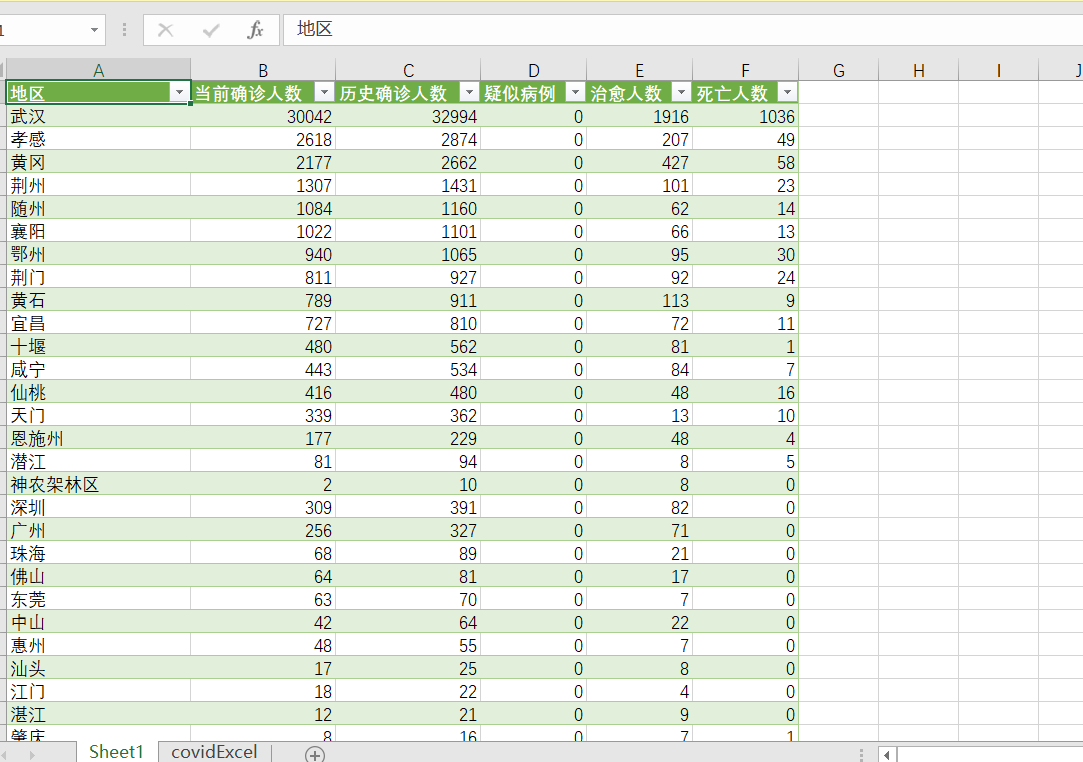
After we climb down the data, we need to store the data. Here we choose to store the data in csv format. The author wants to save it and use it to push it to WeChat everyday official account, so that I do not need to open browser search.
def save_data_as_csv(filename, data):
        filename = filename.replace(":", " ")  # Adjustment time
        with open(filename + ".csv", "w", newline="",encoding='utf-8') as f:
            writer = csv.writer(f)
            writer.writerow(["region", "Current number of confirmed cases","Number of historical confirmed cases","Suspected case","Cure number","death toll"])
            for i in data:
                writer.writerow(i)
            f.close()
The effect is as shown in the figure
Step 4 data visualization
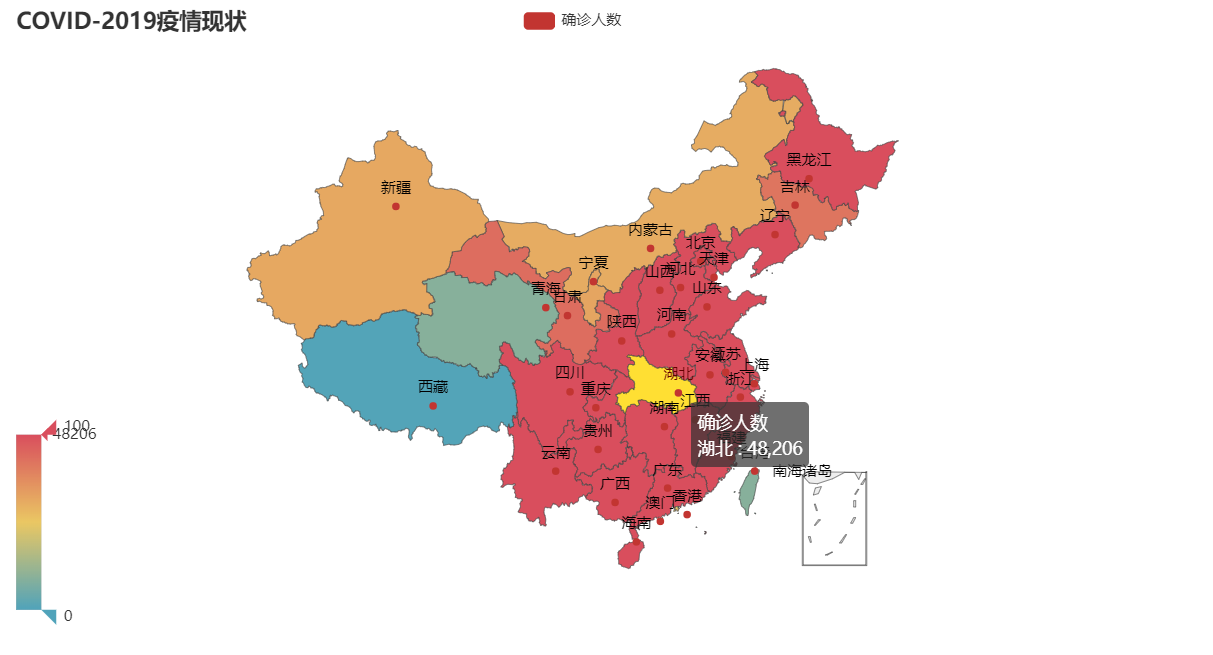
Of course, it is not intuitive to view these useful data through excel, we can visualize them. Here we choose to use the very easy-to-use eckarts. In python, it's pyecharts. In the process of using this wheel, you need to pay attention to that if it's python 3 or above, it only supports V1.0 or above. Many usage may be different from the old version. Please refer to here for details https://pyecharts.org/#/zh-cn/geography_charts
The implementation function code is as follows:
def echarts(data):
    map = Map().add("Confirmed number", data,"china").set_series_opts(label_opts=opts.LabelOpts(is_show=True)).set_global_opts(
        visualmap_opts=opts.VisualMapOpts(),
        title_opts=opts.TitleOpts(title="COVID-2019 Epidemic situation"),)
    # Type = "effectscatter", is "random = true, effect" scale = 5 makes the point divergent
    map.render(path="pneumonia.html")
Detailed renderings
Please move to the specific code https://github.com/yuchen8888/covid_spider

